
Importations de biens et services de l'Indonésie par année ($ US), 1967–2025
| Année | $ US | Rang mondial |
|---|---|---|
| Importations | Rang mondial | |
| 2025 | 297 002 335 695 $ US | #31 |
| 2024 | 286 245 903 351 $ US | #29 |
| 2023 | 269 460 535 789 $ US | #30 |
| 2022 | 276 506 804 558 $ US | #30 |
| 2021 | 222 923 845 056 $ US | #30 |
| 2020 | 165 646 843 302 $ US | #32 |
| 2019 | 213 034 646 335 $ US | #30 |
| 2018 | 230 045 612 385 $ US | #29 |
| 2017 | 194 777 319 196 $ US | #31 |
| 2016 | 170 835 000 830 $ US | #31 |
| 2015 | 178 863 652 306 $ US | #30 |
| 2014 | 217 485 215 770 $ US | #30 |
| 2013 | 225 519 356 300 $ US | #27 |
| 2012 | 229 362 102 380 $ US | #24 |
| 2011 | 212 996 885 267 $ US | #27 |
| 2010 | 169 158 027 610 $ US | #30 |
| 2009 | 115 216 544 854 $ US | #31 |
| 2008 | 146 706 628 549 $ US | #31 |
| 2007 | 109 755 093 425 $ US | #33 |
| 2006 | 93 411 754 076 $ US | #33 |
| 2005 | 85 533 801 154 $ US | #30 |
| 2004 | 70 744 690 514 $ US | #31 |
| 2003 | 54 323 622 341 $ US | #33 |
| 2002 | 51 638 437 161 $ US | #30 |
| 2001 | 49 355 195 402 $ US | #28 |
| 2000 | 50 264 686 470 $ US | #29 |
| 1999 | 38 402 067 922 $ US | #34 |
| 1998 | 41 249 712 042 $ US | #31 |
| 1997 | 60 700 151 259 $ US | #24 |
| 1996 | 60 116 979 038 $ US | #24 |
| 1995 | 55 882 279 824 $ US | #25 |
| 1994 | 44 869 883 142 $ US | #25 |
| 1993 | 37 555 937 063 $ US | #25 |
| 1992 | 34 720 875 700 $ US | #26 |
| 1991 | 30 891 188 671 $ US | #27 |
| 1990 | 27 157 275 247 $ US | #29 |
| 1989 | 21 718 472 096 $ US | #31 |
| 1988 | 18 725 515 167 $ US | #31 |
| 1987 | 17 006 296 443 $ US | #27 |
| 1986 | 16 401 727 040 $ US | #27 |
| 1985 | 17 860 217 184 $ US | #24 |
| 1984 | 19 342 945 144 $ US | #23 |
| 1983 | 23 354 265 850 $ US | #19 |
| 1982 | 23 709 141 549 $ US | #19 |
| 1981 | 21 847 220 118 $ US | #26 |
| 1980 | 16 076 492 704 $ US | #29 |
| 1979 | 12 125 156 525 $ US | #29 |
| 1978 | 10 727 293 584 $ US | #27 |
| 1977 | 9 198 072 289 $ US | #25 |
| 1976 | 7 764 096 386 $ US | #27 |
| 1975 | 6 693 975 904 $ US | #28 |
| 1974 | 5 526 987 952 $ US | #30 |
| 1973 | 3 170 120 482 $ US | #32 |
| 1972 | 2 078 072 289 $ US | #34 |
| 1971 | 1 553 301 764 $ US | #36 |
| 1970 | 1 449 315 068 $ US | #36 |
| 1969 | 1 236 196 319 $ US | - |
| 1968 | 1 102 291 013 $ US | - |
| 1967 | 955 991 033 $ US | - |
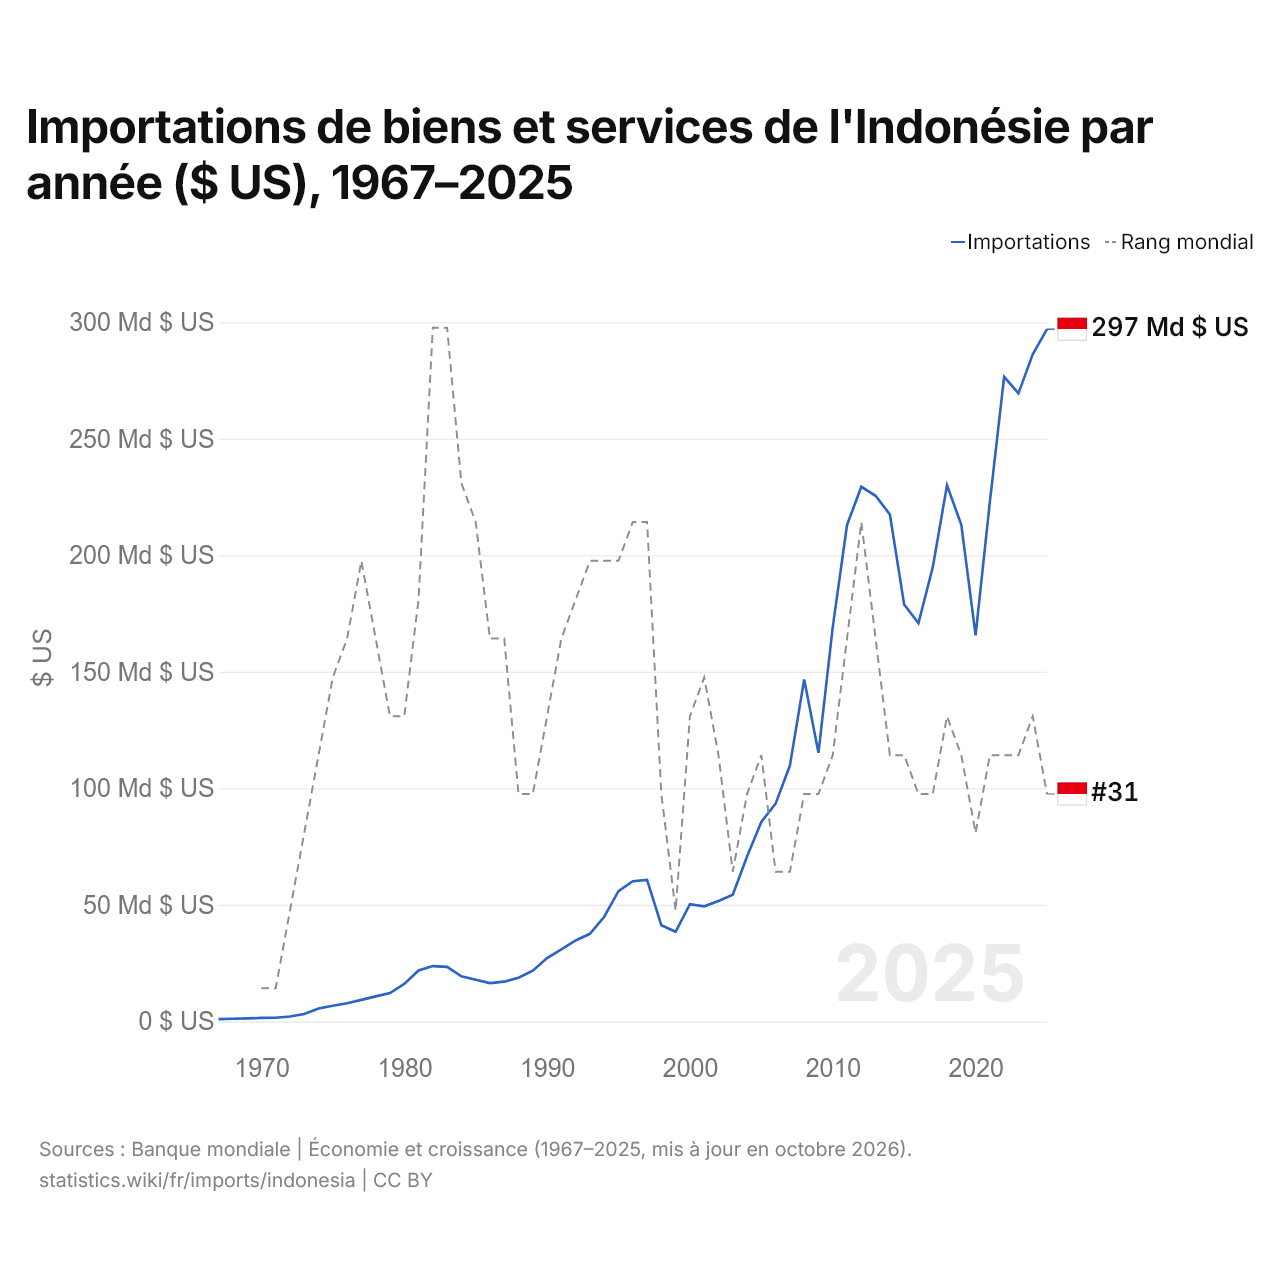
En 2025, les importations de biens et services de l'Indonésie s'élevaient à 297 milliards de dollars, contre 956 millions de dollars en 1967. Elles se classaient au 31e rang mondial, en baisse par rapport au 29e rang en 2024. Leur meilleur rang a été le 19e, occupé pour la dernière fois en 1983.
En 2025, les importations de biens et services de l'Indonésie étaient les 13es plus élevées de 44 pays situés en Asie. En 2025, les exportations de l'Indonésie dépassaient ses importations de 33,3 milliards de dollars, soit un excédent commercial. Le commerce de l'Indonésie, exportations et importations réunies, équivalait à 43,4 % de son PIB en 2025, au 146e rang mondial.
Importations de biens de l'Indonésie par catégorie, 2025
Importations de biens, 2025: 242 Md $US
En 2025, la première catégorie des importations de biens de l'Indonésie était « machines, électronique et véhicules », avec 36,2 %, suivie de « pétrole, gaz, minerais et autres matières premières », avec 21,5 %.
Origines des importations de biens de l'Indonésie : les 10 premières, 2025
| Rang | Pays | Importations de biens | Part | |
|---|---|---|---|---|
| 1 |
 Chine |
87,5 Md $US | 36,2 % | vs Chine |
| 2 |
 Singapour |
19,2 Md $US | 7,93 % | vs Singapour |
| 3 |
 Japon |
14,5 Md $US | 5,98 % | vs Japon |
| 4 |
 États-Unis |
12,9 Md $US | 5,33 % | |
| 5 |
 Malaisie |
11,1 Md $US | 4,6 % | vs Malaisie |
| 6 |
 Australie |
9,36 Md $US | 3,87 % | vs Australie |
| 7 |
 Thaïlande |
8,91 Md $US | 3,68 % | vs Thaïlande |
| 8 |
 Corée du Sud |
7,90 Md $US | 3,27 % | vs Corée du Sud |
| 9 |
 Vietnam |
6,15 Md $US | 2,54 % | vs Vietnam |
| 10 |
 Inde |
4,84 Md $US | 2 % | vs Inde |
| Autres partenaires et non précisés | 59,5 Md $US | 24,6 % |
Importations de biens de l'Indonésie depuis ses 5 principales origines ($ US), 2001–2025
| Année | $ US | ||||
|---|---|---|---|---|---|
| Chine | Singapour | Japon | États-Unis | Malaisie | |
| 2025 | 87 537 279 000 $ US | 19 167 750 000 $ US | 14 469 435 000 $ US | 12 879 530 000 $ US | 11 125 097 000 $ US |
| 2024 | 72 729 136 000 $ US | 21 526 174 000 $ US | 14 964 917 000 $ US | 11 999 667 000 $ US | 10 919 258 000 $ US |
| 2023 | 62 880 868 000 $ US | 18 409 523 000 $ US | 16 516 575 000 $ US | 11 325 834 000 $ US | 10 760 558 000 $ US |
| 2022 | 67 723 698 000 $ US | 19 409 474 000 $ US | 17 176 667 000 $ US | 11 681 585 000 $ US | 12 475 634 000 $ US |
| 2021 | 56 211 017 000 $ US | 15 413 128 000 $ US | 14 256 264 000 $ US | 11 305 738 000 $ US | 9 450 854 000 $ US |
| 2020 | 39 634 710 000 $ US | 12 341 238 000 $ US | 10 672 054 000 $ US | 8 641 588 000 $ US | 6 933 024 000 $ US |
| 2019 | 44 930 621 000 $ US | 17 589 850 000 $ US | 15 661 831 000 $ US | 9 318 897 000 $ US | 7 775 274 000 $ US |
| 2018 | 45 537 831 000 $ US | 21 439 522 000 $ US | 17 976 712 000 $ US | 10 212 286 000 $ US | 8 602 839 000 $ US |
| 2017 | 35 767 190 000 $ US | 16 888 782 000 $ US | 15 241 424 000 $ US | 8 149 432 000 $ US | 8 796 734 000 $ US |
| 2016 | 30 800 493 000 $ US | 14 548 301 000 $ US | 12 984 774 000 $ US | 7 319 167 000 $ US | 7 200 947 000 $ US |
| 2015 | 29 410 891 000 $ US | 18 022 558 000 $ US | 13 263 523 000 $ US | 7 614 746 000 $ US | 8 530 668 000 $ US |
| 2014 | 30 624 380 000 $ US | 25 186 115 000 $ US | 17 007 579 000 $ US | 8 188 542 000 $ US | 10 855 394 000 $ US |
| 2013 | 29 849 460 000 $ US | 25 581 520 000 $ US | 19 284 588 000 $ US | 9 081 821 000 $ US | 13 322 533 000 $ US |
| 2012 | 29 387 067 000 $ US | 26 087 259 000 $ US | 22 767 831 000 $ US | 11 614 235 000 $ US | 12 243 573 000 $ US |
| 2011 | 26 212 186 000 $ US | 25 964 666 000 $ US | 19 436 612 000 $ US | 10 834 043 000 $ US | 10 404 867 000 $ US |
| 2010 | 20 424 217 000 $ US | 20 240 831 000 $ US | 16 965 801 000 $ US | 9 415 997 000 $ US | 8 648 721 000 $ US |
| 2009 | 14 002 170 000 $ US | 15 550 398 000 $ US | 9 843 729 000 $ US | 7 094 374 000 $ US | 5 688 431 000 $ US |
| 2008 | 15 249 201 000 $ US | 21 790 140 000 $ US | 15 129 173 000 $ US | 7 897 981 000 $ US | 8 923 145 000 $ US |
| 2007 | 8 557 876 000 $ US | 9 839 795 000 $ US | 6 526 674 000 $ US | 4 797 496 000 $ US | 6 411 927 000 $ US |
| 2006 | 6 636 895 000 $ US | 10 034 535 000 $ US | 5 515 773 000 $ US | 4 066 343 000 $ US | 3 193 334 000 $ US |
| 2005 | 5 842 863 000 $ US | 9 470 718 000 $ US | 6 906 255 000 $ US | 3 885 796 000 $ US | 2 148 526 000 $ US |
| 2004 | 4 101 331 000 $ US | 6 082 772 000 $ US | 6 081 608 000 $ US | 3 235 508 000 $ US | 1 681 946 000 $ US |
| 2003 | 2 957 469 000 $ US | 4 155 125 000 $ US | 4 228 257 000 $ US | 2 702 375 000 $ US | 1 138 189 000 $ US |
| 2002 | 2 427 369 000 $ US | 4 099 631 000 $ US | 4 409 307 000 $ US | 2 644 085 000 $ US | 1 037 400 000 $ US |
| 2001 | 1 842 680 000 $ US | 3 147 055 000 $ US | 4 689 470 000 $ US | 3 209 693 000 $ US | 1 005 464 000 $ US |
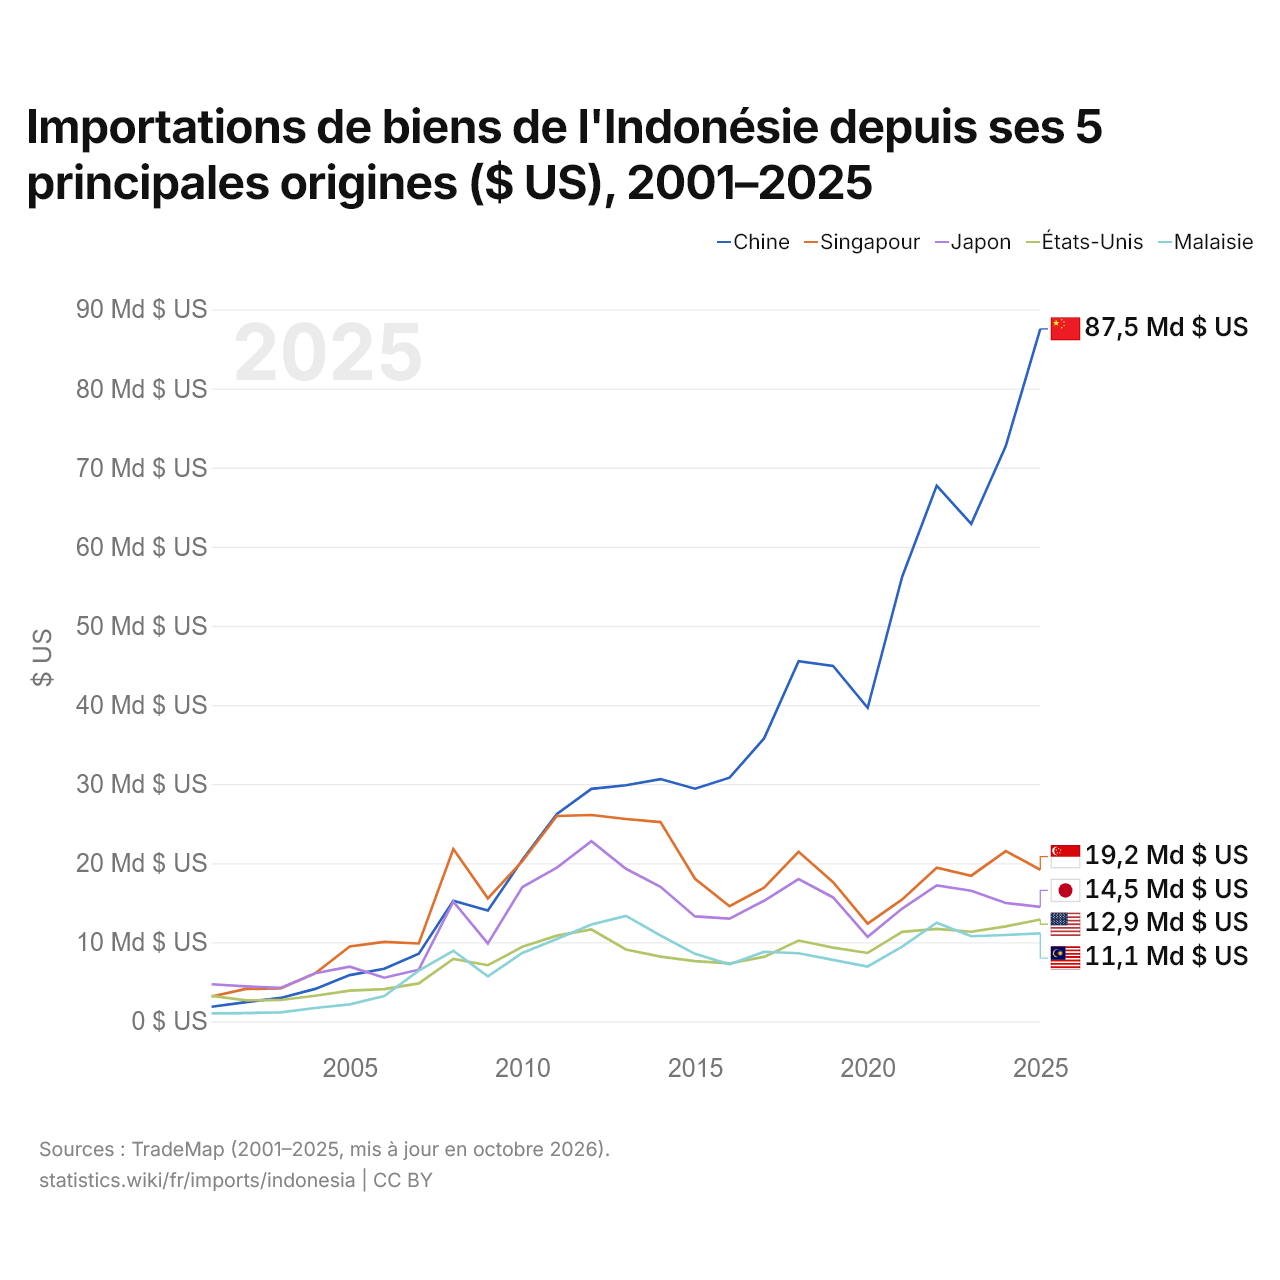
En 2025, les importations de biens s'élevaient à 87,5 milliards de dollars en provenance de la Chine, 19,2 milliards de dollars en provenance de Singapour, 14,5 milliards de dollars en provenance du Japon, 12,9 milliards de dollars en provenance des États-Unis et 11,1 milliards de dollars en provenance de la Malaisie. Le premier rang des cinq fournisseurs de l'Indonésie est occupé par la Chine depuis 2010. Le changement le plus récent dans leur ordre remonte à 2023, quand les importations de l'Indonésie en provenance des États-Unis ont dépassé celles en provenance de la Malaisie.
Importations de biens et de services de l'Indonésie ($ US), 1981–2025
| Année | $ US | |
|---|---|---|
| Biens | Services | |
| 2025 | 230 581 522 915 $ US | 62 784 681 426 $ US |
| 2024 | 223 252 072 443 $ US | 57 574 713 021 $ US |
| 2023 | 211 411 267 167 $ US | 51 282 914 151 $ US |
| 2022 | 229 865 938 720 $ US | 43 164 681 974 $ US |
| 2021 | 189 029 265 041 $ US | 28 549 785 478 $ US |
| 2020 | 135 100 529 877 $ US | 24 771 467 209 $ US |
| 2019 | 164 947 632 106 $ US | 39 282 377 515 $ US |
| 2018 | 180 953 286 762 $ US | 37 691 919 314 $ US |
| 2017 | 150 068 581 019 $ US | 32 706 819 012 $ US |
| 2016 | 129 151 796 501 $ US | 30 407 205 820 $ US |
| 2015 | 135 075 912 646 $ US | 30 917 551 577 $ US |
| 2014 | 168 310 224 944 $ US | 33 540 622 407 $ US |
| 2013 | 176 255 994 169 $ US | 35 014 246 820 $ US |
| 2012 | 178 666 955 242 $ US | 34 224 073 081 $ US |
| 2011 | 157 283 706 173 $ US | 31 691 424 917 $ US |
| 2010 | 118 963 180 843 $ US | 26 460 993 705 $ US |
| 2009 | 80 979 004 083 $ US | 23 152 014 904 $ US |
| 2008 | 107 667 285 875 $ US | 28 470 106 457 $ US |
| 2007 | 76 775 450 000 $ US | 24 578 378 119 $ US |
| 2006 | 66 053 110 000 $ US | 21 560 945 150 $ US |
| 2005 | 64 071 490 000 $ US | 22 196 827 494 $ US |
| 2004 | 46 615 850 000 $ US | 20 856 309 281 $ US |
| 2003 | 39 546 170 000 $ US | 17 400 415 710 $ US |
| 2002 | 35 651 870 000 $ US | 17 044 883 633 $ US |
| 2001 | 34 668 480 000 $ US | 15 880 142 609 $ US |
| 2000 | 40 365 380 000 $ US | 15 637 083 130 $ US |
| 1999 | 30 598 450 000 $ US | 12 376 063 498 $ US |
| 1998 | 31 942 145 700 $ US | 12 088 211 673 $ US |
| 1997 | 46 223 000 000 $ US | 16 607 000 000 $ US |
| 1996 | 44 240 000 000 $ US | 15 139 000 000 $ US |
| 1995 | 40 921 000 000 $ US | 13 540 000 000 $ US |
| 1994 | 32 322 000 000 $ US | 11 416 000 000 $ US |
| 1993 | 28 376 000 000 $ US | 9 846 000 000 $ US |
| 1992 | 26 774 000 000 $ US | 8 100 000 000 $ US |
| 1991 | 24 834 000 000 $ US | 6 564 000 000 $ US |
| 1990 | 21 455 000 000 $ US | 6 056 000 000 $ US |
| 1989 | 16 310 000 000 $ US | 5 439 000 000 $ US |
| 1988 | 13 831 000 000 $ US | 4 606 000 000 $ US |
| 1987 | 12 532 000 000 $ US | 4 440 000 000 $ US |
| 1986 | 11 938 000 000 $ US | 4 256 000 000 $ US |
| 1985 | 12 705 000 000 $ US | 5 135 000 000 $ US |
| 1984 | 15 047 000 000 $ US | 4 239 000 000 $ US |
| 1983 | 17 726 000 000 $ US | 4 311 000 000 $ US |
| 1982 | 17 854 000 000 $ US | 4 862 000 000 $ US |
| 1981 | 16 542 000 000 $ US | 4 998 000 000 $ US |
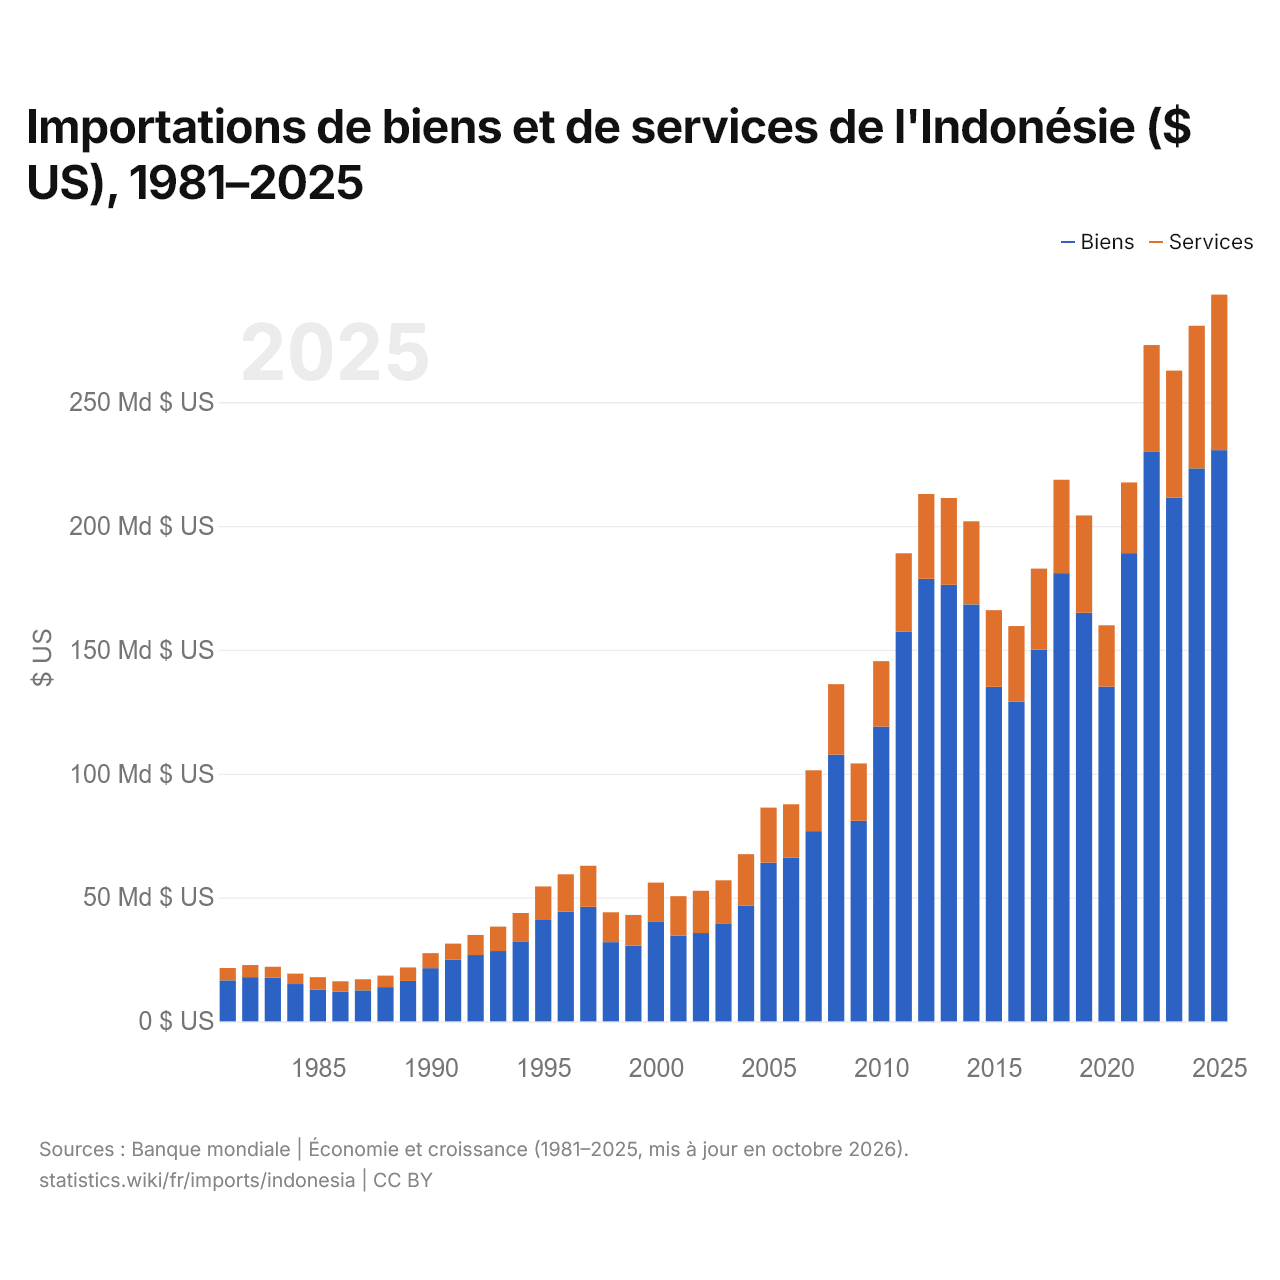
En 2025, les importations de biens de l'Indonésie s'élevaient à 231 milliards de dollars et celles de services à 62,8 milliards de dollars ; les services représentaient 21,4 % du total, contre 23,2 % en 1981.
L'Indonésie dans le classement mondial des importations, 2025
| Rang | Pays | Importations | Part mondiale | |
|---|---|---|---|---|
| 28 |
 Suède |
342 Md $US | 1,01 % | |
| 29 |
Malaisie
|
309 Md $US | 0,92 % | vs Malaisie |
| 30 |
 Autriche |
303 Md $US | 0,9 % | |
| 31 |
 Indonésie |
297 Md $US | 0,88 % | |
| 32 |
 Danemark |
273 Md $US | 0,81 % | |
| 33 |
 Tchéquie |
239 Md $US | 0,71 % | |
| 34 |
 Philippines |
196 Md $US | 0,58 % | vs Philippines |
Importations de biens et services de l'Indonésie, % du PIB, 1960–2025
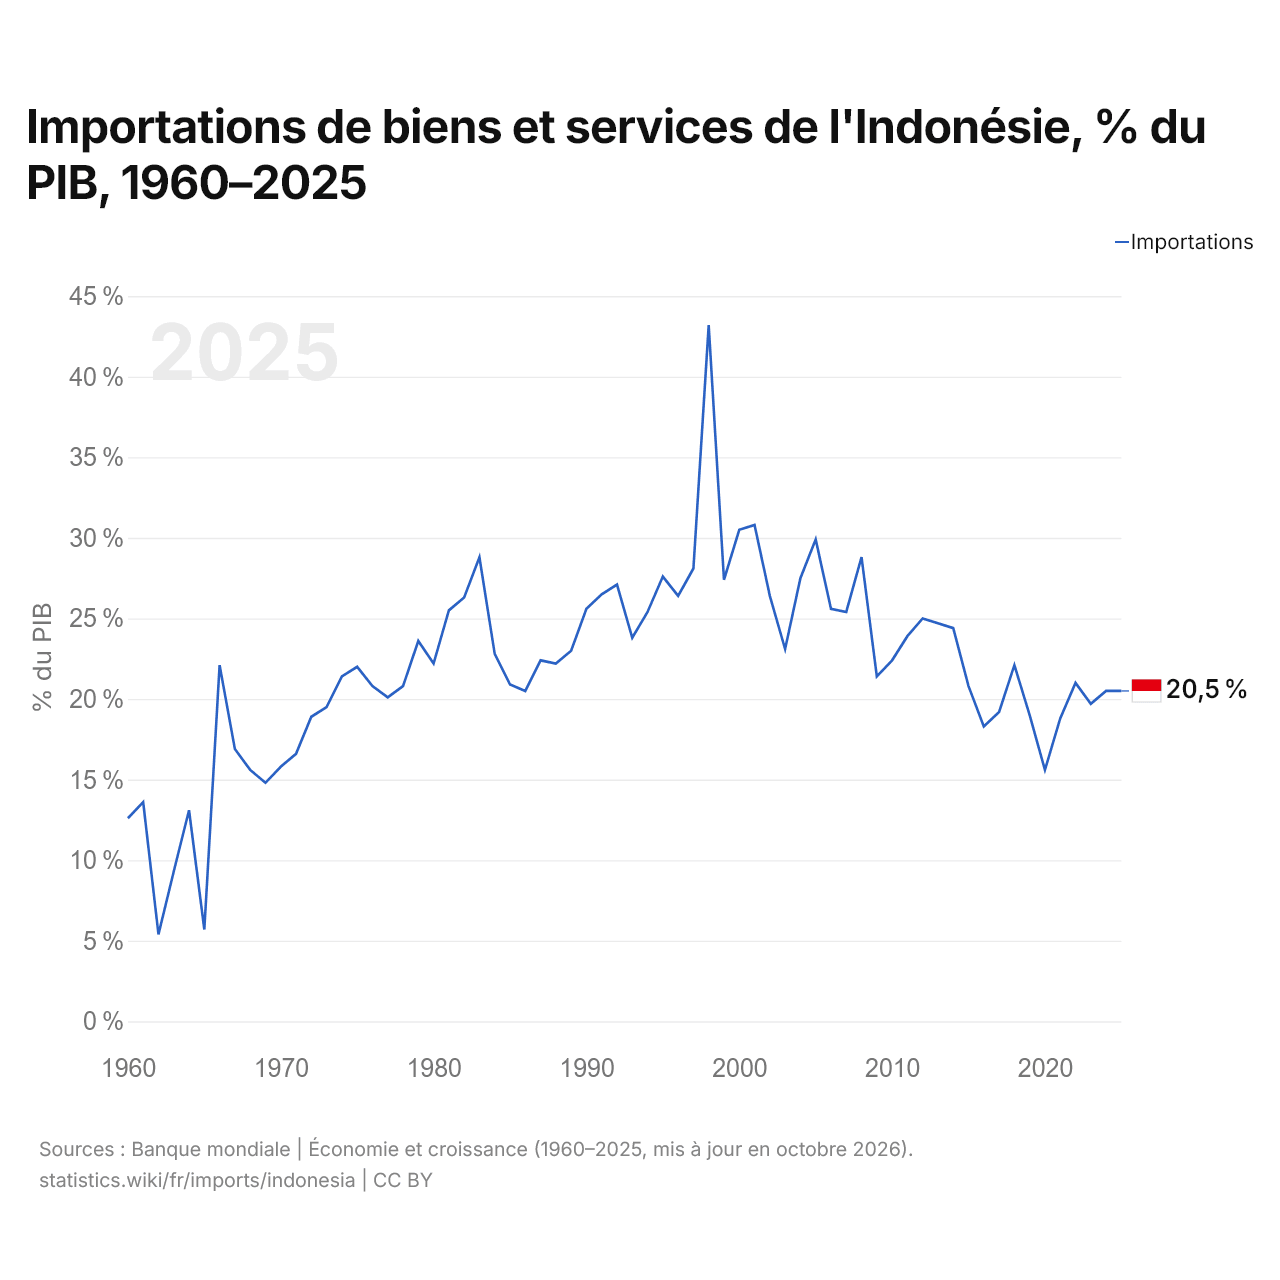
En 2025, les importations de biens et services de l'Indonésie équivalaient à 20,5 % de son PIB, contre 12,6 % en 1960. La part la plus élevée a été de 43,2 %, en 1998.
Comparer les importations de l'Indonésie avec celles d'autres pays
Sources :
- TradeMap (2001–2025, mis à jour en octobre 2026)
- Banque mondiale | Économie et croissance (1960–2025, mis à jour en octobre 2026)
Creative Commons Attribution (CC BY) : vous pouvez copier, partager, adapter et réutiliser ce contenu, y compris à des fins commerciales, à condition de citer statistics.wiki et d’indiquer les modifications apportées. Les sources citées ci-dessus peuvent avoir leurs propres conditions de licence.