
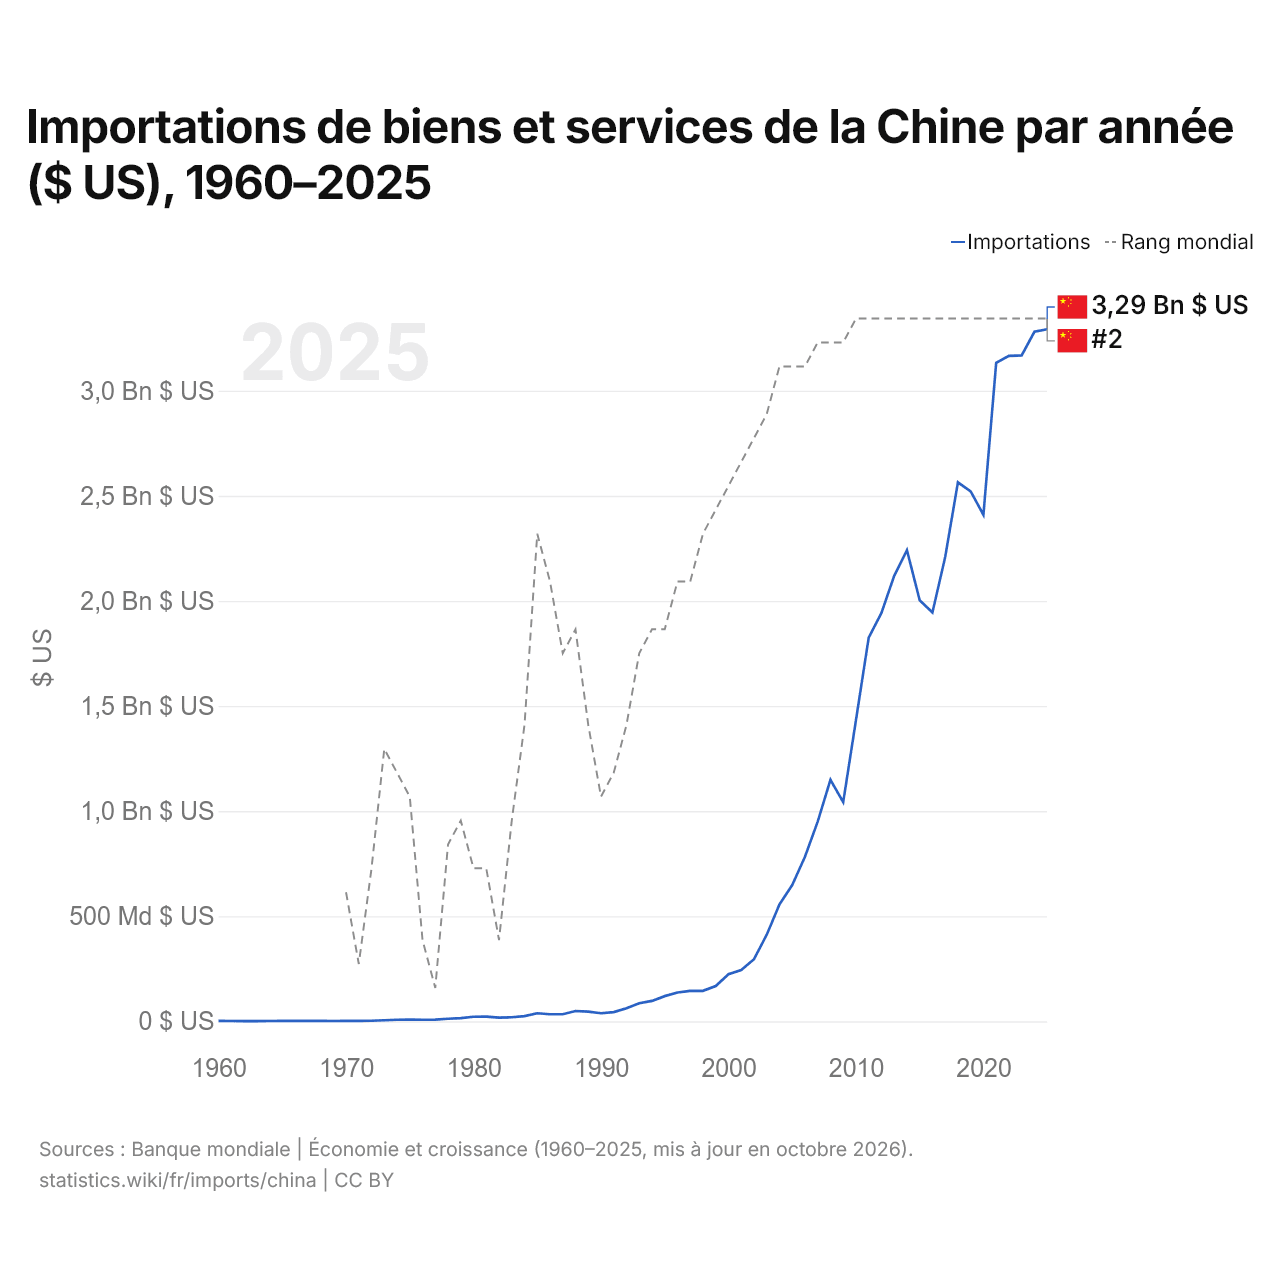
Importations de biens et services de la Chine par année ($ US), 1960–2025
| Année | $ US | Rang mondial |
|---|---|---|
| Importations | Rang mondial | |
| 2025 | 3 292 280 901 123 $ US | #2 |
| 2024 | 3 280 170 243 047 $ US | #2 |
| 2023 | 3 167 502 597 276 $ US | #2 |
| 2022 | 3 166 016 135 468 $ US | #2 |
| 2021 | 3 132 116 155 606 $ US | #2 |
| 2020 | 2 409 650 385 964 $ US | #2 |
| 2019 | 2 521 036 548 137 $ US | #2 |
| 2018 | 2 564 121 910 995 $ US | #2 |
| 2017 | 2 208 518 918 632 $ US | #2 |
| 2016 | 1 944 490 534 275 $ US | #2 |
| 2015 | 2 003 260 696 069 $ US | #2 |
| 2014 | 2 241 276 198 979 $ US | #2 |
| 2013 | 2 119 392 421 428 $ US | #2 |
| 2012 | 1 943 205 232 867 $ US | #2 |
| 2011 | 1 825 413 639 206 $ US | #2 |
| 2010 | 1 432 422 435 977 $ US | #2 |
| 2009 | 1 042 533 759 653 $ US | #3 |
| 2008 | 1 149 036 249 786 $ US | #3 |
| 2007 | 950 020 767 157 $ US | #3 |
| 2006 | 782 812 463 260 $ US | #4 |
| 2005 | 648 712 207 880 $ US | #4 |
| 2004 | 556 182 551 585 $ US | #4 |
| 2003 | 412 137 124 715 $ US | #6 |
| 2002 | 295 619 639 659 $ US | #7 |
| 2001 | 243 973 790 218 $ US | #8 |
| 2000 | 224 306 238 158 $ US | #9 |
| 1999 | 168 058 444 268 $ US | #10 |
| 1998 | 144 913 704 696 $ US | #11 |
| 1997 | 144 623 820 000 $ US | #13 |
| 1996 | 137 261 877 000 $ US | #13 |
| 1995 | 119 900 826 000 $ US | #15 |
| 1994 | 97 250 445 198 $ US | #15 |
| 1993 | 86 072 328 750 $ US | #16 |
| 1992 | 61 849 400 129 $ US | #19 |
| 1991 | 43 941 659 170 $ US | #21 |
| 1990 | 38 461 758 920 $ US | #22 |
| 1989 | 46 118 793 490 $ US | #19 |
| 1988 | 48 984 701 330 $ US | #15 |
| 1987 | 33 781 853 910 $ US | #16 |
| 1986 | 33 592 580 690 $ US | #13 |
| 1985 | 38 302 403 274 $ US | #11 |
| 1984 | 24 710 305 081 $ US | #19 |
| 1983 | 19 385 304 449 $ US | #23 |
| 1982 | 17 788 124 795 $ US | #28 |
| 1981 | 22 219 750 000 $ US | #25 |
| 1980 | 21 842 710 000 $ US | #25 |
| 1979 | 15 535 283 000 $ US | #23 |
| 1978 | 12 261 700 000 $ US | #24 |
| 1977 | 8 060 398 000 $ US | #30 |
| 1976 | 7 349 809 000 $ US | #28 |
| 1975 | 8 355 050 000 $ US | #22 |
| 1974 | 7 716 198 000 $ US | #21 |
| 1973 | 5 257 791 000 $ US | #20 |
| 1972 | 2 916 450 000 $ US | #25 |
| 1971 | 2 233 127 000 $ US | #29 |
| 1970 | 2 201 560 000 $ US | #26 |
| 1969 | 1 731 190 000 $ US | - |
| 1968 | 1 845 220 000 $ US | - |
| 1967 | 1 919 860 000 $ US | - |
| 1966 | 2 185 300 000 $ US | - |
| 1965 | 1 916 420 000 $ US | - |
| 1964 | 1 481 100 000 $ US | - |
| 1963 | 1 210 670 000 $ US | - |
| 1962 | 1 127 720 000 $ US | - |
| 1961 | 1 408 090 000 $ US | - |
| 1960 | 1 890 590 000 $ US | - |
En 2025, les importations de biens et services de la Chine s'élevaient à 3,29 billions de dollars, contre 1,89 milliard de dollars en 1960. Le minimum a été de 1,13 milliard de dollars, en 1962. Elles se classaient au 2e rang mondial, un rang qu'elles occupent depuis 2010.
En 2025, les importations de biens et services de la Chine étaient les plus élevées de 44 pays situés en Asie. En 2025, les exportations de la Chine dépassaient ses importations de 816 milliards de dollars, soit un excédent commercial. Le commerce de la Chine, exportations et importations réunies, équivalait à 38,0 % de son PIB en 2025, au 155e rang mondial.
Importations de biens de la Chine par catégorie, 2025
Importations de biens, 2025: 2,58 Bn $US
En 2025, la première catégorie des importations de biens de la Chine était « machines, électronique et véhicules », avec 39,4 %, suivie de « pétrole, gaz, minerais et autres matières premières », avec 29,8 %.
Origines des importations de biens de la Chine : les 10 premières, 2025
| Rang | Pays | Importations de biens | Part | |
|---|---|---|---|---|
| 1 |
 Corée du Sud |
187 Md $US | 7,26 % | vs Corée du Sud |
| 2 |
 Japon |
165 Md $US | 6,4 % | vs Japon |
| 3 |
 États-Unis |
141 Md $US | 5,48 % | vs USA |
| 4 |
 Australie |
128 Md $US | 4,97 % | vs Australie |
| 5 |
 Russie |
124 Md $US | 4,81 % | vs Russie |
| 6 |
 Brésil |
116 Md $US | 4,51 % | vs Brésil |
| 7 |
 Vietnam |
98,0 Md $US | 3,8 % | vs Vietnam |
| 8 |
 Allemagne |
92,9 Md $US | 3,6 % | vs Allemagne |
| 9 |
 Malaisie |
88,1 Md $US | 3,42 % | vs Malaisie |
| 10 |
 Indonésie |
82,3 Md $US | 3,19 % | vs Indonésie |
| Autres partenaires et non précisés | 1,36 Bn $US | 52,6 % |
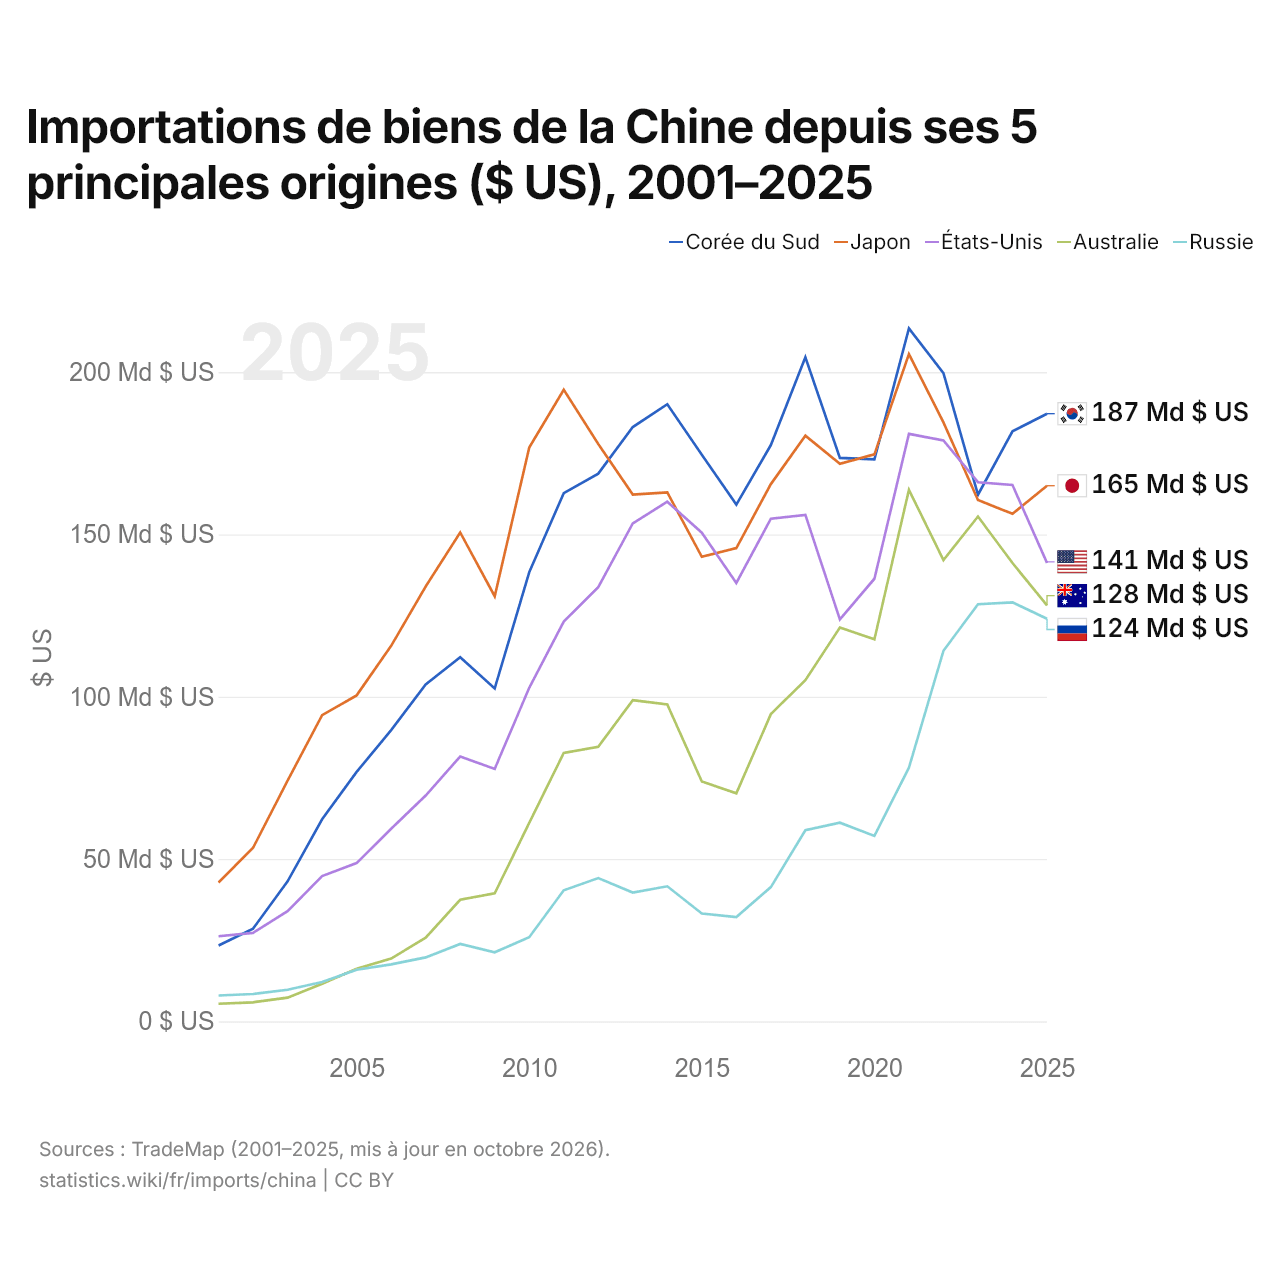
Importations de biens de la Chine depuis ses 5 principales origines ($ US), 2001–2025
| Année | $ US | ||||
|---|---|---|---|---|---|
| Corée du Sud | Japon | États-Unis | Australie | Russie | |
| 2025 | 187 182 282 000 $ US | 164 992 016 000 $ US | 141 224 094 000 $ US | 128 121 208 000 $ US | 124 005 929 000 $ US |
| 2024 | 181 772 497 000 $ US | 156 332 649 000 $ US | 165 204 208 000 $ US | 141 184 675 000 $ US | 129 070 643 000 $ US |
| 2023 | 162 212 043 000 $ US | 160 577 404 000 $ US | 166 071 580 000 $ US | 155 507 964 000 $ US | 128 484 735 000 $ US |
| 2022 | 199 667 118 000 $ US | 184 496 995 000 $ US | 178 956 846 000 $ US | 142 091 499 000 $ US | 114 148 971 000 $ US |
| 2021 | 213 445 080 000 $ US | 205 523 715 000 $ US | 180 971 848 000 $ US | 163 729 736 000 $ US | 78 142 344 000 $ US |
| 2020 | 173 100 171 000 $ US | 174 655 179 000 $ US | 136 339 521 000 $ US | 117 693 743 000 $ US | 57 114 667 000 $ US |
| 2019 | 173 559 029 000 $ US | 171 768 696 000 $ US | 123 792 117 000 $ US | 121 289 666 000 $ US | 61 190 632 000 $ US |
| 2018 | 204 566 451 000 $ US | 180 401 786 000 $ US | 156 004 357 000 $ US | 105 083 923 000 $ US | 58 887 066 000 $ US |
| 2017 | 177 523 904 000 $ US | 165 494 647 000 $ US | 154 839 684 000 $ US | 94 632 692 000 $ US | 41 351 921 000 $ US |
| 2016 | 159 168 781 000 $ US | 145 771 152 000 $ US | 135 047 253 000 $ US | 70 233 044 000 $ US | 32 131 140 000 $ US |
| 2015 | 174 563 830 000 $ US | 143 092 949 000 $ US | 150 543 984 000 $ US | 73 871 388 000 $ US | 33 216 612 000 $ US |
| 2014 | 190 108 773 000 $ US | 162 920 512 000 $ US | 160 064 514 000 $ US | 97 630 887 000 $ US | 41 593 505 000 $ US |
| 2013 | 183 072 918 000 $ US | 162 245 573 000 $ US | 153 394 862 000 $ US | 98 954 088 000 $ US | 39 667 828 000 $ US |
| 2012 | 168 728 402 000 $ US | 177 832 336 000 $ US | 133 765 823 000 $ US | 84 568 209 000 $ US | 44 138 279 000 $ US |
| 2011 | 162 716 843 000 $ US | 194 567 856 000 $ US | 123 124 010 000 $ US | 82 667 477 000 $ US | 40 362 600 000 $ US |
| 2010 | 138 339 223 000 $ US | 176 736 084 000 $ US | 102 734 185 000 $ US | 61 105 168 000 $ US | 25 913 994 000 $ US |
| 2009 | 102 551 712 000 $ US | 130 937 525 000 $ US | 77 755 101 000 $ US | 39 438 780 000 $ US | 21 282 952 000 $ US |
| 2008 | 112 137 921 000 $ US | 150 600 041 000 $ US | 81 585 556 000 $ US | 37 435 133 000 $ US | 23 832 762 000 $ US |
| 2007 | 103 751 686 000 $ US | 133 950 504 000 $ US | 69 547 964 000 $ US | 25 801 494 000 $ US | 19 688 579 000 $ US |
| 2006 | 89 724 142 000 $ US | 115 672 581 000 $ US | 59 314 270 000 $ US | 19 323 299 000 $ US | 17 554 327 000 $ US |
| 2005 | 76 820 404 000 $ US | 100 407 681 000 $ US | 48 741 359 000 $ US | 16 193 627 000 $ US | 15 889 943 000 $ US |
| 2004 | 62 234 102 000 $ US | 94 326 727 000 $ US | 44 747 869 000 $ US | 11 552 489 000 $ US | 12 127 411 000 $ US |
| 2003 | 43 128 054 000 $ US | 74 148 125 000 $ US | 33 944 166 000 $ US | 7 300 072 000 $ US | 9 728 068 000 $ US |
| 2002 | 28 568 008 000 $ US | 53 465 999 000 $ US | 27 261 097 000 $ US | 5 850 572 000 $ US | 8 406 690 000 $ US |
| 2001 | 23 376 945 000 $ US | 42 787 308 000 $ US | 26 217 375 000 $ US | 5 425 925 000 $ US | 7 958 795 000 $ US |
En 2025, les importations de biens s'élevaient à 187 milliards de dollars en provenance de la Corée du Sud, 165 milliards de dollars en provenance du Japon, 141 milliards de dollars en provenance des États-Unis, 128 milliards de dollars en provenance de l'Australie et 124 milliards de dollars en provenance de la Russie. Le premier rang des cinq fournisseurs de la Chine est occupé par la Corée du Sud depuis 2024. Le changement le plus récent dans leur ordre remonte à 2025, quand les importations de la Chine en provenance du Japon ont dépassé celles en provenance des États-Unis.
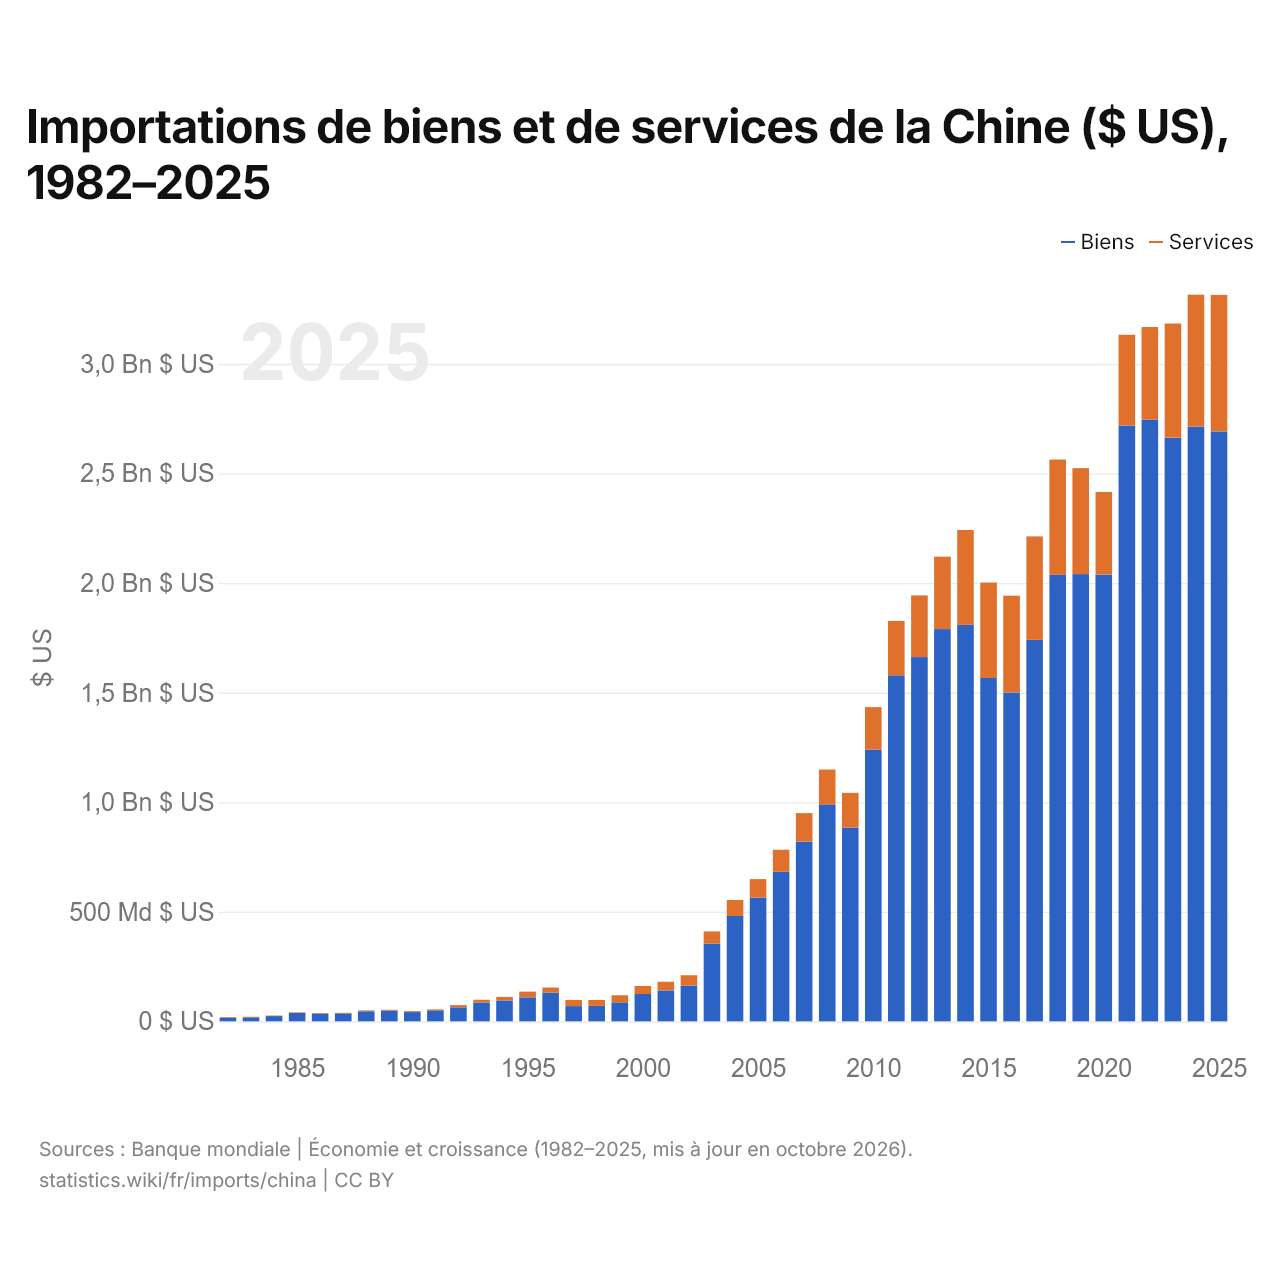
Importations de biens et de services de la Chine ($ US), 1982–2025
| Année | $ US | |
|---|---|---|
| Biens | Services | |
| 2025 | 2 691 602 720 990 $ US | 622 791 224 625 $ US |
| 2024 | 2 713 541 699 376 $ US | 601 934 439 616 $ US |
| 2023 | 2 662 973 882 422 $ US | 520 683 027 483 $ US |
| 2022 | 2 745 664 159 894 $ US | 422 091 638 071 $ US |
| 2021 | 2 718 067 837 279 $ US | 414 496 341 546 $ US |
| 2020 | 2 038 570 404 224 $ US | 376 709 437 446 $ US |
| 2019 | 2 040 468 115 771 $ US | 483 610 283 331 $ US |
| 2018 | 2 037 369 286 974 $ US | 525 735 166 743 $ US |
| 2017 | 1 740 272 384 901 $ US | 471 995 071 371 $ US |
| 2016 | 1 500 635 639 563 $ US | 441 549 741 325 $ US |
| 2015 | 1 566 562 344 087 $ US | 435 719 343 941 $ US |
| 2014 | 1 808 719 657 195 $ US | 432 883 126 519 $ US |
| 2013 | 1 789 607 637 370 $ US | 330 607 538 824 $ US |
| 2012 | 1 661 946 659 669 $ US | 281 300 475 959 $ US |
| 2011 | 1 579 104 690 855 $ US | 247 844 018 720 $ US |
| 2010 | 1 239 986 291 933 $ US | 193 401 495 136 $ US |
| 2009 | 883 613 955 794 $ US | 158 919 803 859 $ US |
| 2008 | 990 087 588 240 $ US | 158 948 661 546 $ US |
| 2007 | 819 890 833 109 $ US | 130 129 934 048 $ US |
| 2006 | 681 974 284 757 $ US | 100 838 178 503 $ US |
| 2005 | 564 741 526 454 $ US | 83 970 681 426 $ US |
| 2004 | 480 719 715 648 $ US | 72 880 614 892 $ US |
| 2003 | 354 608 469 127 $ US | 55 546 608 068 $ US |
| 2002 | 163 480 624 560 $ US | 46 762 744 321 $ US |
| 2001 | 141 031 000 000 $ US | 39 457 000 000 $ US |
| 2000 | 124 897 211 000 $ US | 36 268 639 000 $ US |
| 1999 | 87 136 000 000 $ US | 32 107 000 000 $ US |
| 1998 | 70 323 000 000 $ US | 27 204 000 000 $ US |
| 1997 | 69 431 000 000 $ US | 28 278 000 000 $ US |
| 1996 | 131 542 000 000 $ US | 22 585 000 000 $ US |
| 1995 | 110 059 580 000 $ US | 25 222 820 000 $ US |
| 1994 | 95 271 000 000 $ US | 16 299 000 000 $ US |
| 1993 | 86 313 000 000 $ US | 12 036 000 000 $ US |
| 1992 | 64 385 000 000 $ US | 9 434 000 000 $ US |
| 1991 | 50 176 000 000 $ US | 4 121 000 000 $ US |
| 1990 | 42 354 000 000 $ US | 4 352 000 000 $ US |
| 1989 | 48 840 000 000 $ US | 3 910 000 000 $ US |
| 1988 | 46 369 000 000 $ US | 3 603 000 000 $ US |
| 1987 | 36 395 000 000 $ US | 2 485 000 000 $ US |
| 1986 | 34 896 000 000 $ US | 2 276 000 000 $ US |
| 1985 | 38 231 000 000 $ US | 2 524 000 000 $ US |
| 1984 | 23 891 000 000 $ US | 2 857 000 000 $ US |
| 1983 | 18 717 000 000 $ US | 1 994 000 000 $ US |
| 1982 | 16 876 000 000 $ US | 2 024 000 000 $ US |
En 2025, les importations de biens de la Chine s'élevaient à 2,69 billions de dollars et celles de services à 623 milliards de dollars ; les services représentaient 18,8 % du total, contre 10,7 % en 1982.
La Chine dans le classement mondial des importations, 2025
| Rang | Pays | Importations | Part mondiale | |
|---|---|---|---|---|
| 1 |
États-Unis
|
4,36 Bn $US | 12,9 % | vs USA |
| 2 |
 Chine |
3,29 Bn $US | 9,76 % | |
| 3 |
Allemagne
|
1,92 Bn $US | 5,7 % | vs Allemagne |
| 4 |
 Royaume-Uni |
1,28 Bn $US | 3,78 % | vs R.-U. |
| 5 |
 France |
1,14 Bn $US | 3,37 % | vs France |
| 6 |
Japon
|
998 Md $US | 2,96 % | vs Japon |
| 7 |
 Inde |
950 Md $US | 2,82 % | vs Inde |
Importations de biens et services de la Chine, % du PIB, 1960–2025
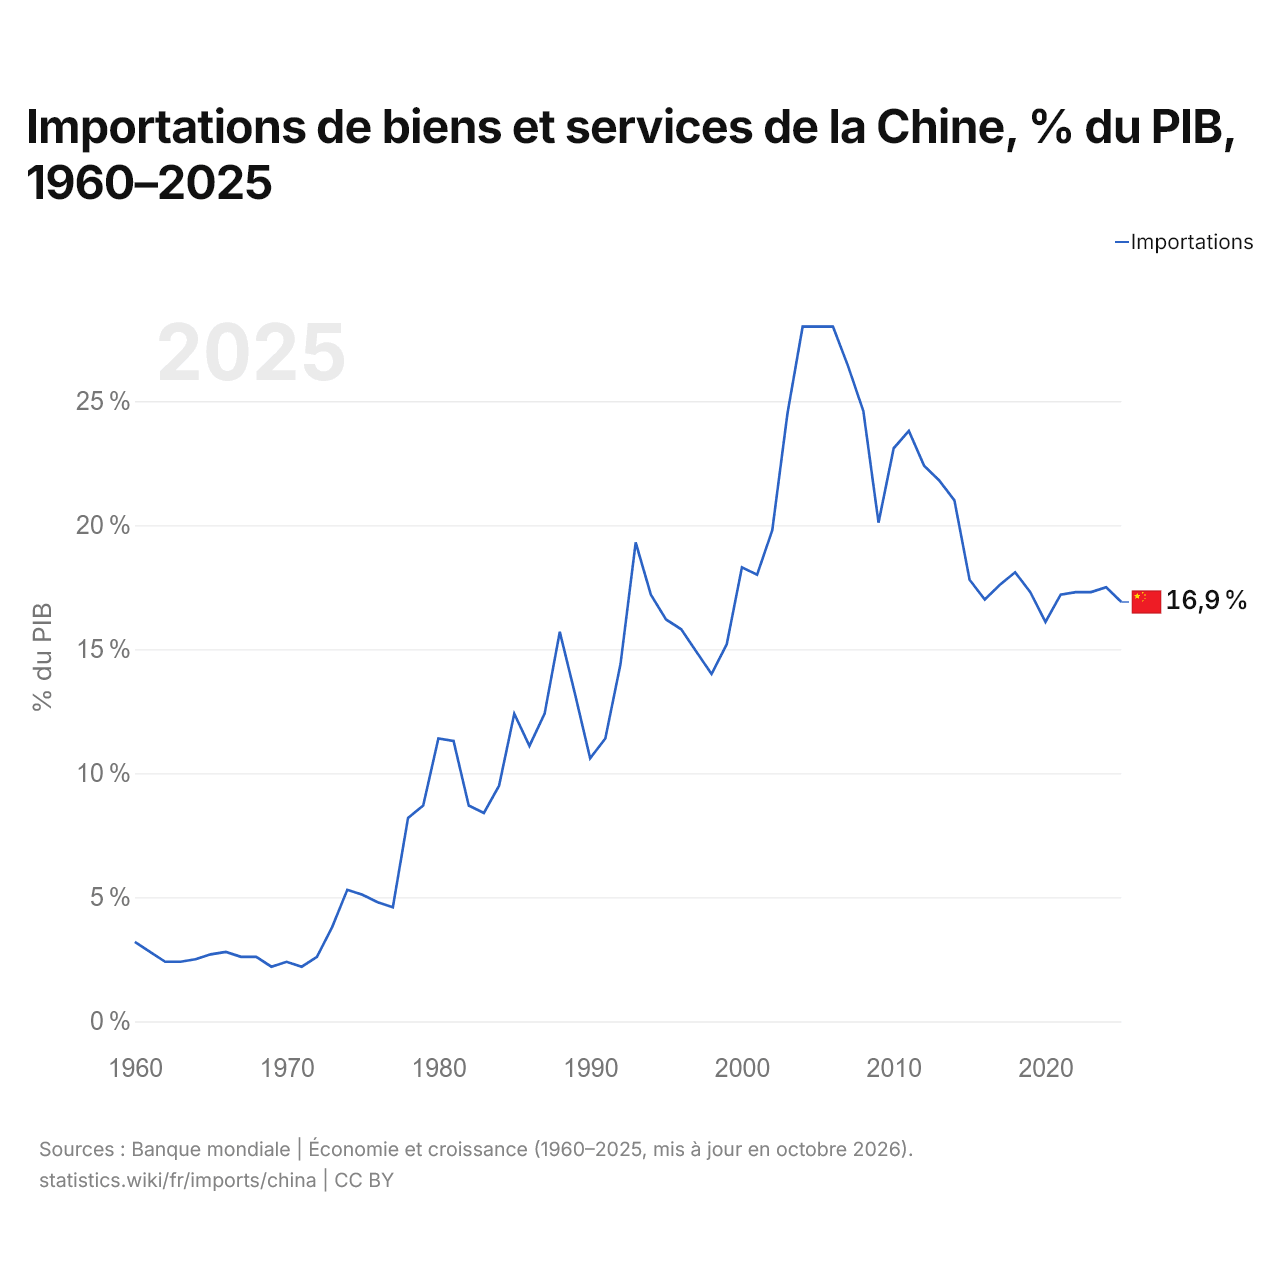
En 2025, les importations de biens et services de la Chine équivalaient à 16,9 % de son PIB, contre 3,2 % en 1960. La part la plus élevée a été de 28,0 %, en 2006.
Comparer les importations de la Chine avec celles d'autres pays
Sources :
- TradeMap (2001–2025, mis à jour en octobre 2026)
- Banque mondiale | Économie et croissance (1960–2025, mis à jour en octobre 2026)
Creative Commons Attribution (CC BY) : vous pouvez copier, partager, adapter et réutiliser ce contenu, y compris à des fins commerciales, à condition de citer statistics.wiki et d’indiquer les modifications apportées. Les sources citées ci-dessus peuvent avoir leurs propres conditions de licence.