
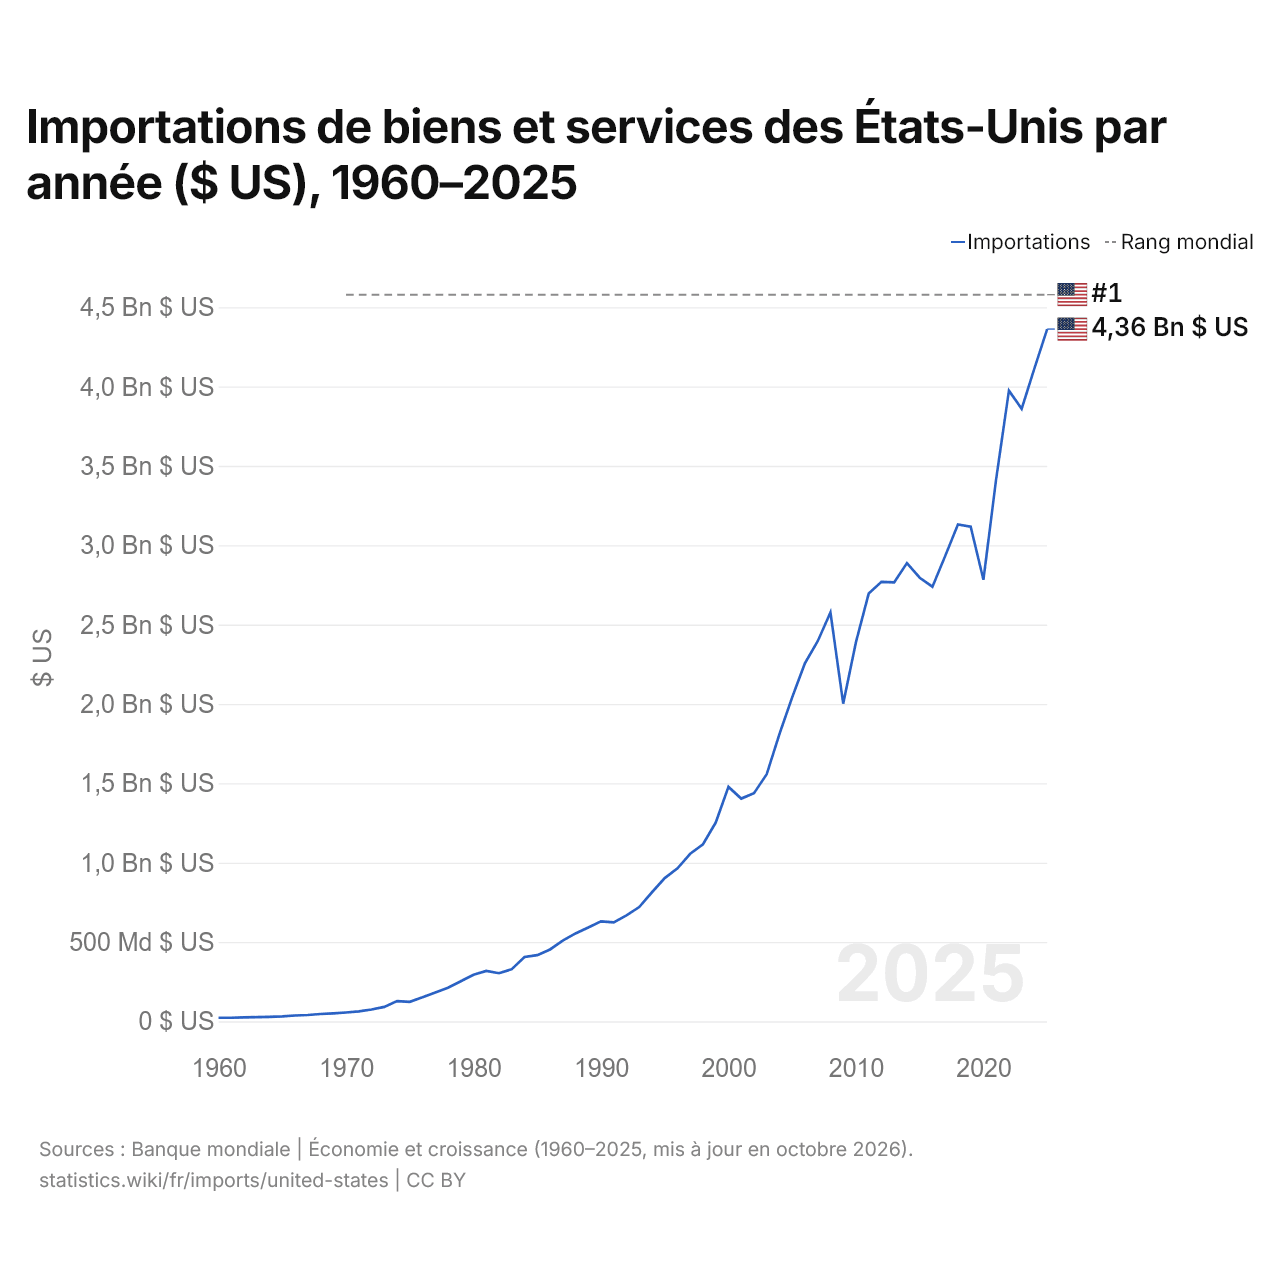
Importations de biens et services des États-Unis par année ($ US), 1960–2025
| Année | $ US | Rang mondial |
|---|---|---|
| Importations | Rang mondial | |
| 2025 | 4 361 777 000 000 $ US | #1 |
| 2024 | 4 113 828 000 000 $ US | #1 |
| 2023 | 3 859 856 000 000 $ US | #1 |
| 2022 | 3 974 319 000 000 $ US | #1 |
| 2021 | 3 417 930 000 000 $ US | #1 |
| 2020 | 2 782 391 000 000 $ US | #1 |
| 2019 | 3 116 681 000 000 $ US | #1 |
| 2018 | 3 131 166 000 000 $ US | #1 |
| 2017 | 2 931 589 000 000 $ US | #1 |
| 2016 | 2 738 830 000 000 $ US | #1 |
| 2015 | 2 794 942 000 000 $ US | #1 |
| 2014 | 2 887 445 000 000 $ US | #1 |
| 2013 | 2 766 375 000 000 $ US | #1 |
| 2012 | 2 769 317 000 000 $ US | #1 |
| 2011 | 2 695 480 000 000 $ US | #1 |
| 2010 | 2 389 555 000 000 $ US | #1 |
| 2009 | 2 001 927 000 000 $ US | #1 |
| 2008 | 2 576 151 000 000 $ US | #1 |
| 2007 | 2 395 228 000 000 $ US | #1 |
| 2006 | 2 256 623 000 000 $ US | #1 |
| 2005 | 2 041 482 000 000 $ US | #1 |
| 2004 | 1 810 504 000 000 $ US | #1 |
| 2003 | 1 557 120 000 000 $ US | #1 |
| 2002 | 1 437 724 000 000 $ US | #1 |
| 2001 | 1 403 559 000 000 $ US | #1 |
| 2000 | 1 477 184 000 000 $ US | #1 |
| 1999 | 1 252 460 000 000 $ US | #1 |
| 1998 | 1 115 690 000 000 $ US | #1 |
| 1997 | 1 055 774 000 000 $ US | #1 |
| 1996 | 963 966 000 000 $ US | #1 |
| 1995 | 902 572 000 000 $ US | #1 |
| 1994 | 813 424 000 000 $ US | #1 |
| 1993 | 719 973 000 000 $ US | #1 |
| 1992 | 667 791 000 000 $ US | #1 |
| 1991 | 623 544 000 000 $ US | #1 |
| 1990 | 629 728 000 000 $ US | #1 |
| 1989 | 591 030 000 000 $ US | #1 |
| 1988 | 553 993 000 000 $ US | #1 |
| 1987 | 508 713 000 000 $ US | #1 |
| 1986 | 452 867 000 000 $ US | #1 |
| 1985 | 417 229 000 000 $ US | #1 |
| 1984 | 405 107 000 000 $ US | #1 |
| 1983 | 328 638 000 000 $ US | #1 |
| 1982 | 303 184 000 000 $ US | #1 |
| 1981 | 317 758 000 000 $ US | #1 |
| 1980 | 293 828 000 000 $ US | #1 |
| 1979 | 252 674 000 000 $ US | #1 |
| 1978 | 212 250 000 000 $ US | #1 |
| 1977 | 182 443 000 000 $ US | #1 |
| 1976 | 151 146 000 000 $ US | #1 |
| 1975 | 122 730 000 000 $ US | #1 |
| 1974 | 127 465 000 000 $ US | #1 |
| 1973 | 91 159 000 000 $ US | #1 |
| 1972 | 74 216 000 000 $ US | #1 |
| 1971 | 62 342 000 000 $ US | #1 |
| 1970 | 55 760 000 000 $ US | #1 |
| 1969 | 50 439 790 647 $ US | - |
| 1968 | 46 486 084 810 $ US | - |
| 1967 | 39 860 199 662 $ US | - |
| 1966 | 37 009 236 566 $ US | - |
| 1965 | 31 461 196 297 $ US | - |
| 1964 | 28 043 049 184 $ US | - |
| 1963 | 26 080 864 402 $ US | - |
| 1962 | 24 919 992 127 $ US | - |
| 1961 | 22 659 754 237 $ US | - |
| 1960 | 22 824 075 764 $ US | - |
En 2025, les importations de biens et services des États-Unis s'élevaient à 4,36 billions de dollars, contre 22,8 milliards de dollars en 1960. Le minimum a été de 22,7 milliards de dollars, en 1961. Elles étaient les plus élevées du monde, un rang qu'elles occupent depuis 1970.
En 2025, les importations de biens et services des États-Unis étaient les plus élevées en Amérique du Nord. En 2025, les importations des États-Unis dépassaient leurs exportations de 932 milliards de dollars, soit un déficit commercial. Le commerce des États-Unis, exportations et importations réunies, équivalait à 25,3 % de leur PIB en 2025, au 171e rang mondial.
Importations de biens des États-Unis par catégorie, 2025
Importations de biens, 2025: 3,51 Bn $US
En 2025, la première catégorie des importations de biens des États-Unis était « machines, électronique et véhicules », avec 47,9 %, suivie de « produits chimiques, pharmaceutiques et plastiques », avec 12,8 %.
Origines des importations de biens des États-Unis : les 10 premières, 2025
| Rang | Pays | Importations de biens | Part | |
|---|---|---|---|---|
| 1 |
 Mexique |
539 Md $US | 15,4 % | vs Mexique |
| 2 |
 Canada |
393 Md $US | 11,2 % | vs Canada |
| 3 |
 Chine |
327 Md $US | 9,34 % | vs Chine |
| 4 |
 Vietnam |
201 Md $US | 5,74 % | |
| 5 |
 Allemagne |
159 Md $US | 4,54 % | vs Allemagne |
| 6 |
 Japon |
150 Md $US | 4,27 % | vs Japon |
| 7 |
 Irlande |
134 Md $US | 3,82 % | vs Irlande |
| 8 |
 Corée du Sud |
129 Md $US | 3,68 % | |
| 9 |
 Inde |
108 Md $US | 3,07 % | vs Inde |
| 10 |
 Suisse |
107 Md $US | 3,04 % | vs Suisse |
| Autres partenaires et non précisés | 1,26 Bn $US | 35,9 % |
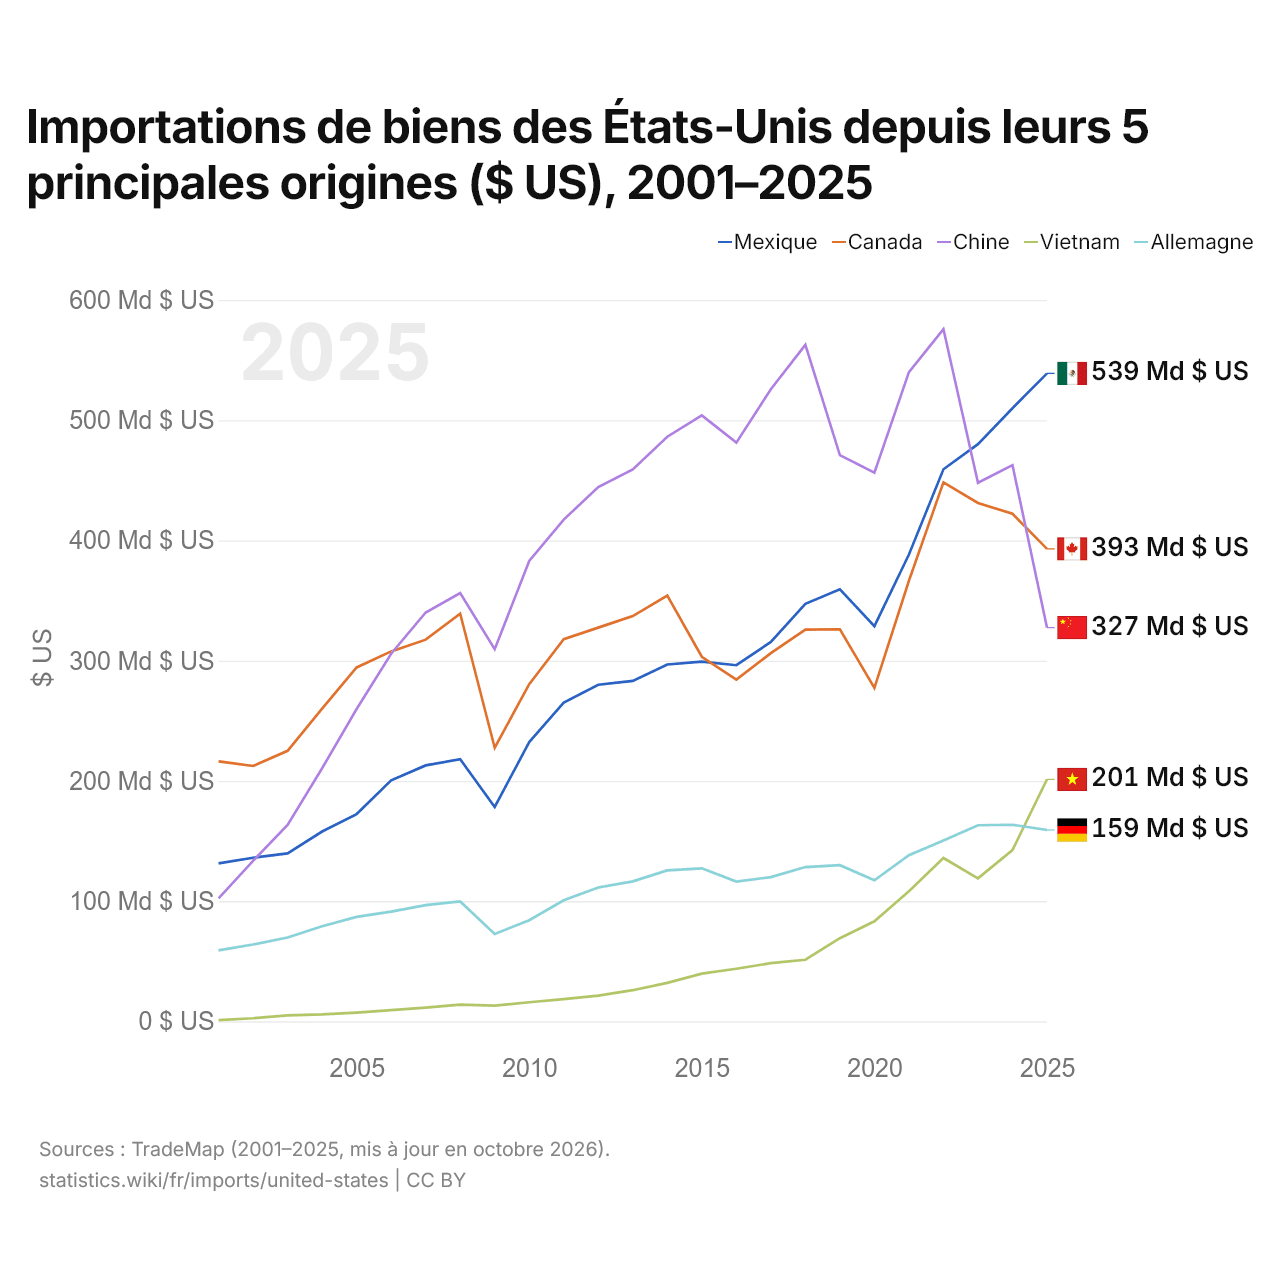
Importations de biens des États-Unis depuis leurs 5 principales origines ($ US), 2001–2025
| Année | $ US | ||||
|---|---|---|---|---|---|
| Mexique | Canada | Chine | Vietnam | Allemagne | |
| 2025 | 538 970 911 000 $ US | 392 991 488 000 $ US | 327 492 223 000 $ US | 201 257 306 000 $ US | 159 174 759 000 $ US |
| 2024 | 509 986 324 000 $ US | 422 170 029 000 $ US | 462 638 752 000 $ US | 142 475 987 000 $ US | 163 546 205 000 $ US |
| 2023 | 480 080 423 000 $ US | 431 195 849 000 $ US | 448 035 941 000 $ US | 118 940 929 000 $ US | 163 080 742 000 $ US |
| 2022 | 459 205 003 000 $ US | 448 335 040 000 $ US | 575 710 081 000 $ US | 135 876 564 000 $ US | 150 461 562 000 $ US |
| 2021 | 388 319 850 000 $ US | 366 473 071 000 $ US | 540 073 411 000 $ US | 108 179 712 000 $ US | 138 230 318 000 $ US |
| 2020 | 328 684 629 000 $ US | 277 301 761 000 $ US | 456 449 466 000 $ US | 83 184 456 000 $ US | 117 360 598 000 $ US |
| 2019 | 359 339 933 000 $ US | 326 157 091 000 $ US | 470 950 852 000 $ US | 69 159 005 000 $ US | 129 912 049 000 $ US |
| 2018 | 347 334 381 000 $ US | 325 886 992 000 $ US | 562 700 012 000 $ US | 51 261 469 000 $ US | 128 334 752 000 $ US |
| 2017 | 315 605 003 000 $ US | 306 209 371 000 $ US | 525 748 647 000 $ US | 48 421 844 000 $ US | 119 968 194 000 $ US |
| 2016 | 296 223 311 000 $ US | 284 181 632 000 $ US | 481 369 890 000 $ US | 43 747 879 000 $ US | 116 287 929 000 $ US |
| 2015 | 299 226 220 000 $ US | 303 241 052 000 $ US | 504 041 702 000 $ US | 39 687 860 000 $ US | 127 253 591 000 $ US |
| 2014 | 296 855 759 000 $ US | 354 171 825 000 $ US | 486 296 238 000 $ US | 32 011 178 000 $ US | 125 532 375 000 $ US |
| 2013 | 283 133 714 000 $ US | 337 126 102 000 $ US | 459 107 864 000 $ US | 25 904 256 000 $ US | 116 406 340 000 $ US |
| 2012 | 279 957 417 000 $ US | 327 502 570 000 $ US | 444 386 004 000 $ US | 21 371 334 000 $ US | 111 298 413 000 $ US |
| 2011 | 265 113 824 000 $ US | 317 921 220 000 $ US | 417 340 262 000 $ US | 18 456 988 000 $ US | 100 675 925 000 $ US |
| 2010 | 232 251 415 000 $ US | 280 426 518 000 $ US | 382 964 820 000 $ US | 15 888 134 000 $ US | 84 129 523 000 $ US |
| 2009 | 178 321 648 000 $ US | 227 577 354 000 $ US | 309 530 233 000 $ US | 13 038 309 000 $ US | 72 632 756 000 $ US |
| 2008 | 218 066 233 000 $ US | 339 074 076 000 $ US | 356 304 561 000 $ US | 13 853 633 000 $ US | 99 758 479 000 $ US |
| 2007 | 212 878 005 000 $ US | 317 481 897 000 $ US | 340 106 646 000 $ US | 11 425 323 000 $ US | 96 631 596 000 $ US |
| 2006 | 200 499 682 000 $ US | 307 723 064 000 $ US | 305 778 876 000 $ US | 9 265 020 000 $ US | 91 215 229 000 $ US |
| 2005 | 172 388 577 000 $ US | 294 382 272 000 $ US | 259 836 017 000 $ US | 7 207 121 000 $ US | 86 873 024 000 $ US |
| 2004 | 157 881 924 000 $ US | 260 161 286 000 $ US | 210 500 129 000 $ US | 5 726 299 000 $ US | 79 143 125 000 $ US |
| 2003 | 139 686 658 000 $ US | 225 035 349 000 $ US | 163 313 863 000 $ US | 4 909 552 000 $ US | 69 681 503 000 $ US |
| 2002 | 136 025 056 000 $ US | 212 398 395 000 $ US | 133 510 393 000 $ US | 2 584 730 000 $ US | 63 905 161 000 $ US |
| 2001 | 131 334 695 000 $ US | 216 234 127 000 $ US | 102 267 289 000 $ US | 1 052 859 000 $ US | 59 075 092 000 $ US |
En 2025, les importations de biens s'élevaient à 539 milliards de dollars en provenance du Mexique, 393 milliards de dollars en provenance du Canada, 327 milliards de dollars en provenance de la Chine, 201 milliards de dollars en provenance du Vietnam et 159 milliards de dollars en provenance de l'Allemagne. Le premier rang des cinq fournisseurs des États-Unis est occupé par le Mexique depuis 2023. Le changement le plus récent dans leur ordre remonte à 2025, quand les importations des États-Unis en provenance du Canada ont dépassé celles en provenance de la Chine.
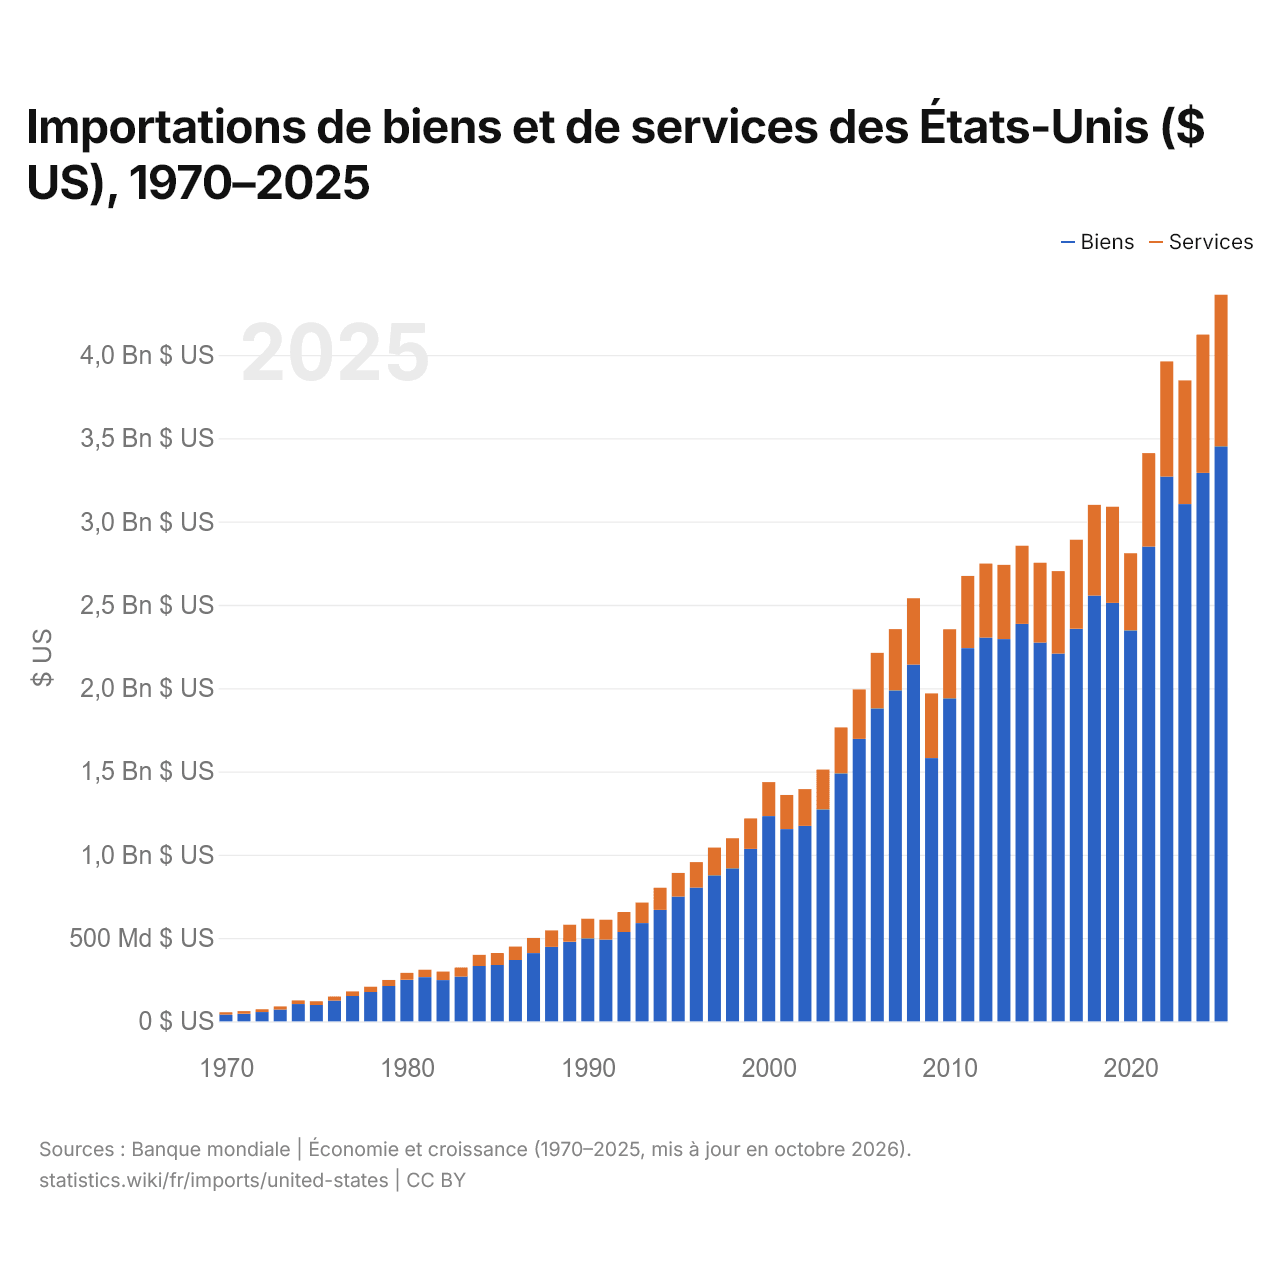
Importations de biens et de services des États-Unis ($ US), 1970–2025
| Année | $ US | |
|---|---|---|
| Biens | Services | |
| 2025 | 3 451 541 000 000 $ US | 910 236 000 000 $ US |
| 2024 | 3 292 517 000 000 $ US | 829 359 000 000 $ US |
| 2023 | 3 104 719 000 000 $ US | 742 490 000 000 $ US |
| 2022 | 3 270 141 000 000 $ US | 691 412 000 000 $ US |
| 2021 | 2 849 041 000 000 $ US | 561 946 000 000 $ US |
| 2020 | 2 346 728 000 000 $ US | 462 934 000 000 $ US |
| 2019 | 2 512 358 000 000 $ US | 576 509 000 000 $ US |
| 2018 | 2 555 662 000 000 $ US | 544 563 000 000 $ US |
| 2017 | 2 356 344 000 000 $ US | 534 852 000 000 $ US |
| 2016 | 2 207 195 000 000 $ US | 495 360 000 000 $ US |
| 2015 | 2 273 249 000 000 $ US | 479 206 000 000 $ US |
| 2014 | 2 385 480 000 000 $ US | 469 477 000 000 $ US |
| 2013 | 2 294 246 000 000 $ US | 445 772 000 000 $ US |
| 2012 | 2 303 749 000 000 $ US | 444 128 000 000 $ US |
| 2011 | 2 239 884 000 000 $ US | 433 614 000 000 $ US |
| 2010 | 1 938 952 000 000 $ US | 414 627 000 000 $ US |
| 2009 | 1 580 026 000 000 $ US | 388 752 000 000 $ US |
| 2008 | 2 141 286 000 000 $ US | 398 031 000 000 $ US |
| 2007 | 1 986 346 000 000 $ US | 367 806 000 000 $ US |
| 2006 | 1 878 193 000 000 $ US | 333 787 000 000 $ US |
| 2005 | 1 695 821 000 000 $ US | 296 526 000 000 $ US |
| 2004 | 1 488 349 000 000 $ US | 275 758 000 000 $ US |
| 2003 | 1 272 089 000 000 $ US | 238 942 000 000 $ US |
| 2002 | 1 173 282 000 000 $ US | 220 759 000 000 $ US |
| 2001 | 1 153 699 000 000 $ US | 204 984 000 000 $ US |
| 2000 | 1 231 722 000 000 $ US | 204 145 000 000 $ US |
| 1999 | 1 035 591 000 000 $ US | 182 441 000 000 $ US |
| 1998 | 918 637 000 000 $ US | 180 676 000 000 $ US |
| 1997 | 876 794 000 000 $ US | 165 953 000 000 $ US |
| 1996 | 803 113 000 000 $ US | 152 550 000 000 $ US |
| 1995 | 749 374 000 000 $ US | 141 410 000 000 $ US |
| 1994 | 668 690 000 000 $ US | 133 075 000 000 $ US |
| 1993 | 589 394 000 000 $ US | 123 771 000 000 $ US |
| 1992 | 536 528 000 000 $ US | 119 552 000 000 $ US |
| 1991 | 491 017 000 000 $ US | 118 500 000 000 $ US |
| 1990 | 498 440 000 000 $ US | 117 670 000 000 $ US |
| 1989 | 477 679 000 000 $ US | 102 510 000 000 $ US |
| 1988 | 447 188 000 000 $ US | 98 615 000 000 $ US |
| 1987 | 409 761 000 000 $ US | 90 786 000 000 $ US |
| 1986 | 368 410 000 000 $ US | 80 158 000 000 $ US |
| 1985 | 338 082 000 000 $ US | 72 030 000 000 $ US |
| 1984 | 332 414 000 000 $ US | 66 910 000 000 $ US |
| 1983 | 268 893 000 000 $ US | 54 260 000 000 $ US |
| 1982 | 247 664 000 000 $ US | 51 040 000 000 $ US |
| 1981 | 265 095 000 000 $ US | 44 880 000 000 $ US |
| 1980 | 249 771 000 000 $ US | 40 970 000 000 $ US |
| 1979 | 212 007 000 000 $ US | 36 230 000 000 $ US |
| 1978 | 176 002 000 000 $ US | 31 690 000 000 $ US |
| 1977 | 151 910 000 000 $ US | 27 630 000 000 $ US |
| 1976 | 124 230 000 000 $ US | 24 910 000 000 $ US |
| 1975 | 98 180 000 000 $ US | 22 270 000 000 $ US |
| 1974 | 103 820 000 000 $ US | 21 660 000 000 $ US |
| 1973 | 70 500 000 000 $ US | 19 090 000 000 $ US |
| 1972 | 55 800 000 000 $ US | 17 050 000 000 $ US |
| 1971 | 45 580 000 000 $ US | 15 570 000 000 $ US |
| 1970 | 39 860 000 000 $ US | 14 650 000 000 $ US |
En 2025, les importations de biens des États-Unis s'élevaient à 3,45 billions de dollars et celles de services à 910 milliards de dollars ; les services représentaient 20,9 % du total, contre 26,9 % en 1970.
Les États-Unis dans le classement mondial des importations, 2025



Importations de biens et services des États-Unis, % du PIB, 1960–2025
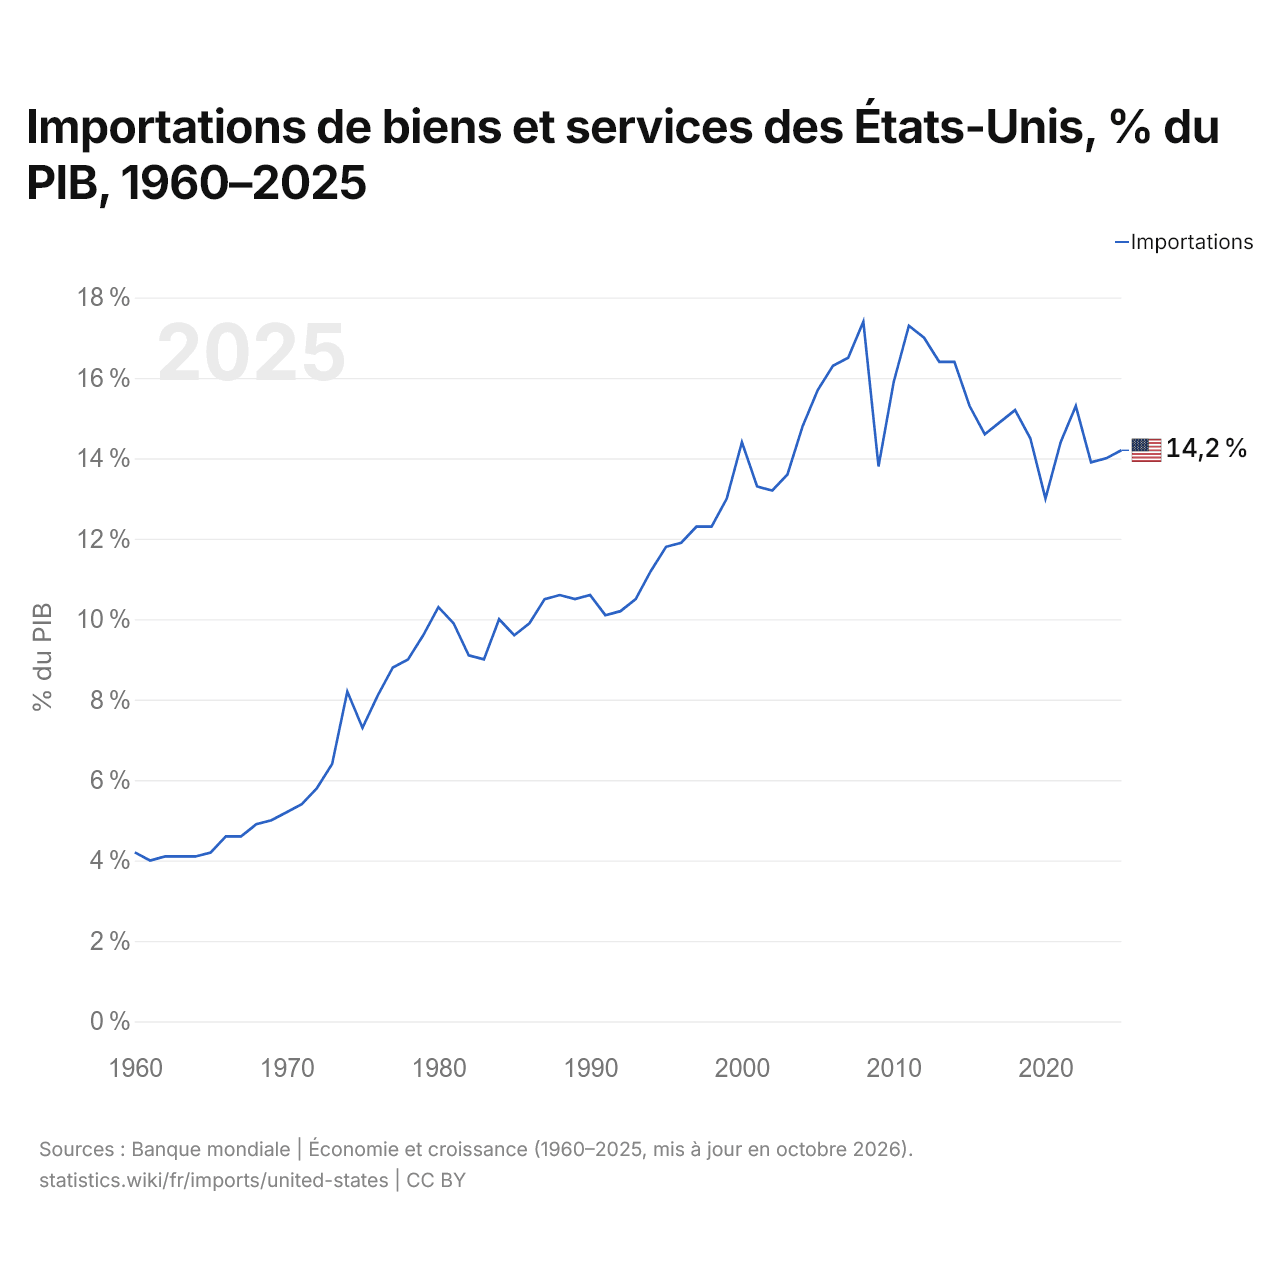
En 2025, les importations de biens et services des États-Unis équivalaient à 14,2 % de leur PIB, contre 4,2 % en 1960. La part la plus élevée a été de 17,4 %, en 2008.
Comparer les importations des États-Unis avec celles d'autres pays
Sources :
- TradeMap (2001–2025, mis à jour en octobre 2026)
- Banque mondiale | Économie et croissance (1960–2025, mis à jour en octobre 2026)
Creative Commons Attribution (CC BY) : vous pouvez copier, partager, adapter et réutiliser ce contenu, y compris à des fins commerciales, à condition de citer statistics.wiki et d’indiquer les modifications apportées. Les sources citées ci-dessus peuvent avoir leurs propres conditions de licence.