
Importations de biens et services de l'Australie par année ($ US), 1960–2025
| Année | $ US | Rang mondial |
|---|---|---|
| Importations | Rang mondial | |
| 2025 | 407 490 633 311 $ US | #22 |
| 2024 | 395 749 225 409 $ US | #22 |
| 2023 | 387 533 147 572 $ US | #20 |
| 2022 | 343 078 219 088 $ US | #25 |
| 2021 | 284 038 962 018 $ US | #26 |
| 2020 | 274 154 332 727 $ US | #22 |
| 2019 | 306 786 753 626 $ US | #20 |
| 2018 | 311 861 687 285 $ US | #20 |
| 2017 | 277 671 313 150 $ US | #21 |
| 2016 | 261 827 324 556 $ US | #21 |
| 2015 | 291 850 364 122 $ US | #19 |
| 2014 | 314 156 216 979 $ US | #20 |
| 2013 | 335 869 075 673 $ US | #20 |
| 2012 | 335 367 853 143 $ US | #19 |
| 2011 | 285 510 760 030 $ US | #20 |
| 2010 | 238 100 480 913 $ US | #20 |
| 2009 | 211 106 497 148 $ US | #19 |
| 2008 | 239 715 332 950 $ US | #19 |
| 2007 | 186 601 240 480 $ US | #22 |
| 2006 | 162 450 827 270 $ US | #21 |
| 2005 | 145 652 868 457 $ US | #20 |
| 2004 | 121 992 459 809 $ US | #22 |
| 2003 | 98 900 407 688 $ US | #21 |
| 2002 | 82 017 039 226 $ US | #22 |
| 2001 | 83 770 437 082 $ US | #21 |
| 2000 | 89 663 284 608 $ US | #19 |
| 1999 | 80 794 585 788 $ US | #19 |
| 1998 | 81 674 014 787 $ US | #19 |
| 1997 | 82 133 225 648 $ US | #21 |
| 1996 | 77 631 200 583 $ US | #22 |
| 1995 | 73 019 750 520 $ US | #22 |
| 1994 | 59 676 236 596 $ US | #22 |
| 1993 | 55 746 908 375 $ US | #20 |
| 1992 | 53 341 618 614 $ US | #20 |
| 1991 | 52 680 239 946 $ US | #19 |
| 1990 | 53 060 646 565 $ US | #18 |
| 1989 | 50 821 263 277 $ US | #17 |
| 1988 | 39 231 436 371 $ US | #18 |
| 1987 | 32 314 716 781 $ US | #19 |
| 1986 | 32 912 702 854 $ US | #15 |
| 1985 | 31 190 673 250 $ US | #15 |
| 1984 | 28 996 243 475 $ US | #15 |
| 1983 | 27 657 830 162 $ US | #16 |
| 1982 | 32 610 614 587 $ US | #14 |
| 1981 | 29 570 416 812 $ US | #15 |
| 1980 | 23 827 298 050 $ US | #20 |
| 1979 | 20 687 265 705 $ US | #17 |
| 1978 | 17 265 414 582 $ US | #17 |
| 1977 | 16 144 757 972 $ US | #17 |
| 1976 | 14 038 081 937 $ US | #18 |
| 1975 | 14 315 171 378 $ US | #14 |
| 1974 | 11 737 656 595 $ US | #14 |
| 1973 | 7 022 421 525 $ US | #17 |
| 1972 | 6 220 794 393 $ US | #14 |
| 1971 | 5 839 680 934 $ US | #13 |
| 1970 | 5 455 520 873 $ US | #13 |
| 1969 | 4 883 200 781 $ US | - |
| 1968 | 4 730 880 757 $ US | - |
| 1967 | 4 222 400 676 $ US | - |
| 1966 | 4 124 960 660 $ US | - |
| 1965 | 3 959 200 633 $ US | - |
| 1964 | 3 270 400 523 $ US | - |
| 1963 | 2 974 720 476 $ US | - |
| 1962 | 2 512 160 402 $ US | - |
| 1961 | 2 952 320 472 $ US | - |
| 1960 | 2 611 840 418 $ US | - |
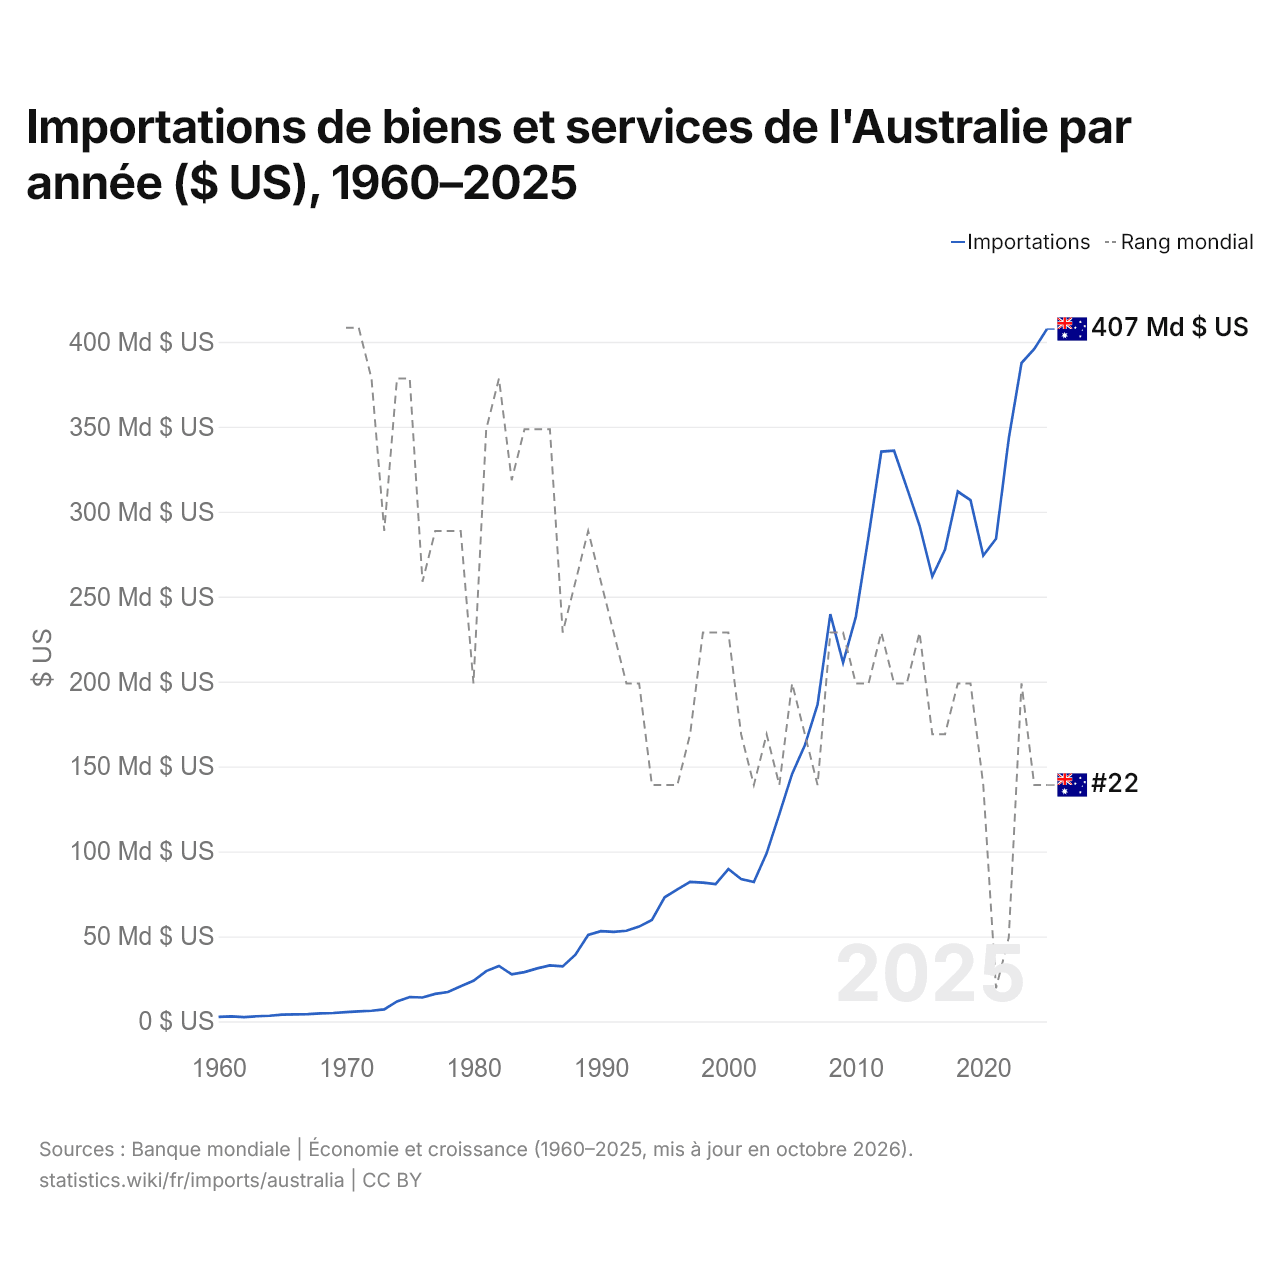
En 2025, les importations de biens et services de l'Australie s'élevaient à 407 milliards de dollars, contre 2,61 milliards de dollars en 1960. Le minimum a été de 2,51 milliards de dollars, en 1962. Elles se classaient au 22e rang mondial, un rang qu'elles occupent depuis 2024. Leur meilleur rang a été le 13e, occupé pour la dernière fois en 1971.
En 2025, les importations de biens et services de l'Australie étaient les plus élevées de 11 pays situés en Océanie. En 2025, les exportations de l'Australie dépassaient ses importations de 10,6 milliards de dollars, soit un excédent commercial. Le commerce de l'Australie, exportations et importations réunies, équivalait à 45,9 % de son PIB en 2025, au 144e rang mondial.
Importations de biens de l'Australie par catégorie, 2025
Importations de biens, 2025: 297 Md $US
En 2025, la première catégorie des importations de biens de l'Australie était « machines, électronique et véhicules », avec 45,0 %, suivie de « pétrole, gaz, minerais et autres matières premières », avec 15,5 %.
Origines des importations de biens de l'Australie : les 10 premières, 2025
| Rang | Pays | Importations de biens | Part | |
|---|---|---|---|---|
| 1 |
 Chine |
79,1 Md $US | 26,6 % | vs Chine |
| 2 |
 États-Unis |
32,8 Md $US | 11 % | vs USA |
| 3 |
 Japon |
15,8 Md $US | 5,32 % | vs Japon |
| 4 |
 Corée du Sud |
14,1 Md $US | 4,74 % | vs Corée du Sud |
| 5 |
 Singapour |
12,6 Md $US | 4,25 % | |
| 6 |
 Thaïlande |
12,1 Md $US | 4,07 % | |
| 7 |
 Malaisie |
12,0 Md $US | 4,02 % | |
| 8 |
 Allemagne |
11,3 Md $US | 3,8 % | vs Allemagne |
| 9 |
 Vietnam |
8,18 Md $US | 2,75 % | vs Vietnam |
| 10 |
 Inde |
7,45 Md $US | 2,51 % | vs Inde |
| Autres partenaires et non précisés | 91,8 Md $US | 30,9 % |
Importations de biens de l'Australie depuis ses 5 principales origines ($ US), 2001–2025
| Année | $ US | ||||
|---|---|---|---|---|---|
| Chine | États-Unis | Japon | Corée du Sud | Singapour | |
| 2025 | 79 078 689 000 $ US | 32 838 162 000 $ US | 15 807 033 000 $ US | 14 088 449 000 $ US | 12 638 747 000 $ US |
| 2024 | 72 091 821 000 $ US | 33 550 296 000 $ US | 16 678 967 000 $ US | 15 772 961 000 $ US | 9 888 905 000 $ US |
| 2023 | 69 099 087 000 $ US | 30 672 426 000 $ US | 17 346 338 000 $ US | 17 609 281 000 $ US | 10 673 269 000 $ US |
| 2022 | 77 273 584 000 $ US | 29 323 485 000 $ US | 16 993 783 000 $ US | 18 277 033 000 $ US | 13 532 646 000 $ US |
| 2021 | 67 914 125 000 $ US | 25 502 028 000 $ US | 15 176 361 000 $ US | 9 073 673 000 $ US | 9 366 033 000 $ US |
| 2020 | 57 621 451 000 $ US | 23 746 634 000 $ US | 12 086 838 000 $ US | 6 025 446 000 $ US | 5 248 180 000 $ US |
| 2019 | 54 664 941 000 $ US | 25 135 511 000 $ US | 14 901 414 000 $ US | 8 045 338 000 $ US | 7 070 901 000 $ US |
| 2018 | 55 166 019 000 $ US | 23 316 010 000 $ US | 16 778 374 000 $ US | 9 515 623 000 $ US | 8 597 190 000 $ US |
| 2017 | 48 364 029 000 $ US | 22 710 105 000 $ US | 15 990 826 000 $ US | 15 628 204 000 $ US | 6 174 137 000 $ US |
| 2016 | 44 159 288 000 $ US | 21 675 796 000 $ US | 14 565 833 000 $ US | 8 095 134 000 $ US | 5 244 129 000 $ US |
| 2015 | 45 946 735 000 $ US | 22 331 709 000 $ US | 14 661 163 000 $ US | 10 617 943 000 $ US | 6 964 746 000 $ US |
| 2014 | 46 332 813 000 $ US | 23 862 257 000 $ US | 15 120 324 000 $ US | 10 276 608 000 $ US | 11 506 710 000 $ US |
| 2013 | 45 079 908 000 $ US | 23 989 848 000 $ US | 18 057 040 000 $ US | 9 458 832 000 $ US | 12 509 440 000 $ US |
| 2012 | 45 143 988 000 $ US | 29 029 297 000 $ US | 19 408 977 000 $ US | 9 865 351 000 $ US | 14 834 957 000 $ US |
| 2011 | 43 447 910 000 $ US | 26 797 969 000 $ US | 18 577 829 000 $ US | 7 352 557 000 $ US | 14 596 109 000 $ US |
| 2010 | 38 004 358 000 $ US | 22 561 956 000 $ US | 17 526 279 000 $ US | 6 889 100 000 $ US | 10 079 073 000 $ US |
| 2009 | 29 211 722 000 $ US | 18 669 858 000 $ US | 13 476 040 000 $ US | 5 293 360 000 $ US | 8 792 367 000 $ US |
| 2008 | 31 588 261 000 $ US | 24 256 280 000 $ US | 18 049 343 000 $ US | 5 730 763 000 $ US | 14 230 994 000 $ US |
| 2007 | 25 898 023 000 $ US | 21 252 492 000 $ US | 15 907 701 000 $ US | 5 227 402 000 $ US | 9 182 734 000 $ US |
| 2006 | 20 327 744 000 $ US | 19 664 100 000 $ US | 13 711 754 000 $ US | 5 451 304 000 $ US | 8 433 882 000 $ US |
| 2005 | 17 341 183 000 $ US | 17 460 413 000 $ US | 13 765 147 000 $ US | 4 148 450 000 $ US | 6 902 213 000 $ US |
| 2004 | 14 073 256 000 $ US | 16 111 107 000 $ US | 12 881 768 000 $ US | 3 805 348 000 $ US | 4 796 864 000 $ US |
| 2003 | 9 832 373 000 $ US | 14 194 301 000 $ US | 11 131 503 000 $ US | 3 227 695 000 $ US | 3 031 478 000 $ US |
| 2002 | 7 332 896 000 $ US | 13 340 675 000 $ US | 9 062 529 000 $ US | 2 716 634 000 $ US | 2 425 589 000 $ US |
| 2001 | 5 625 308 000 $ US | 11 729 046 000 $ US | 8 344 980 000 $ US | 2 516 281 000 $ US | 2 138 127 000 $ US |
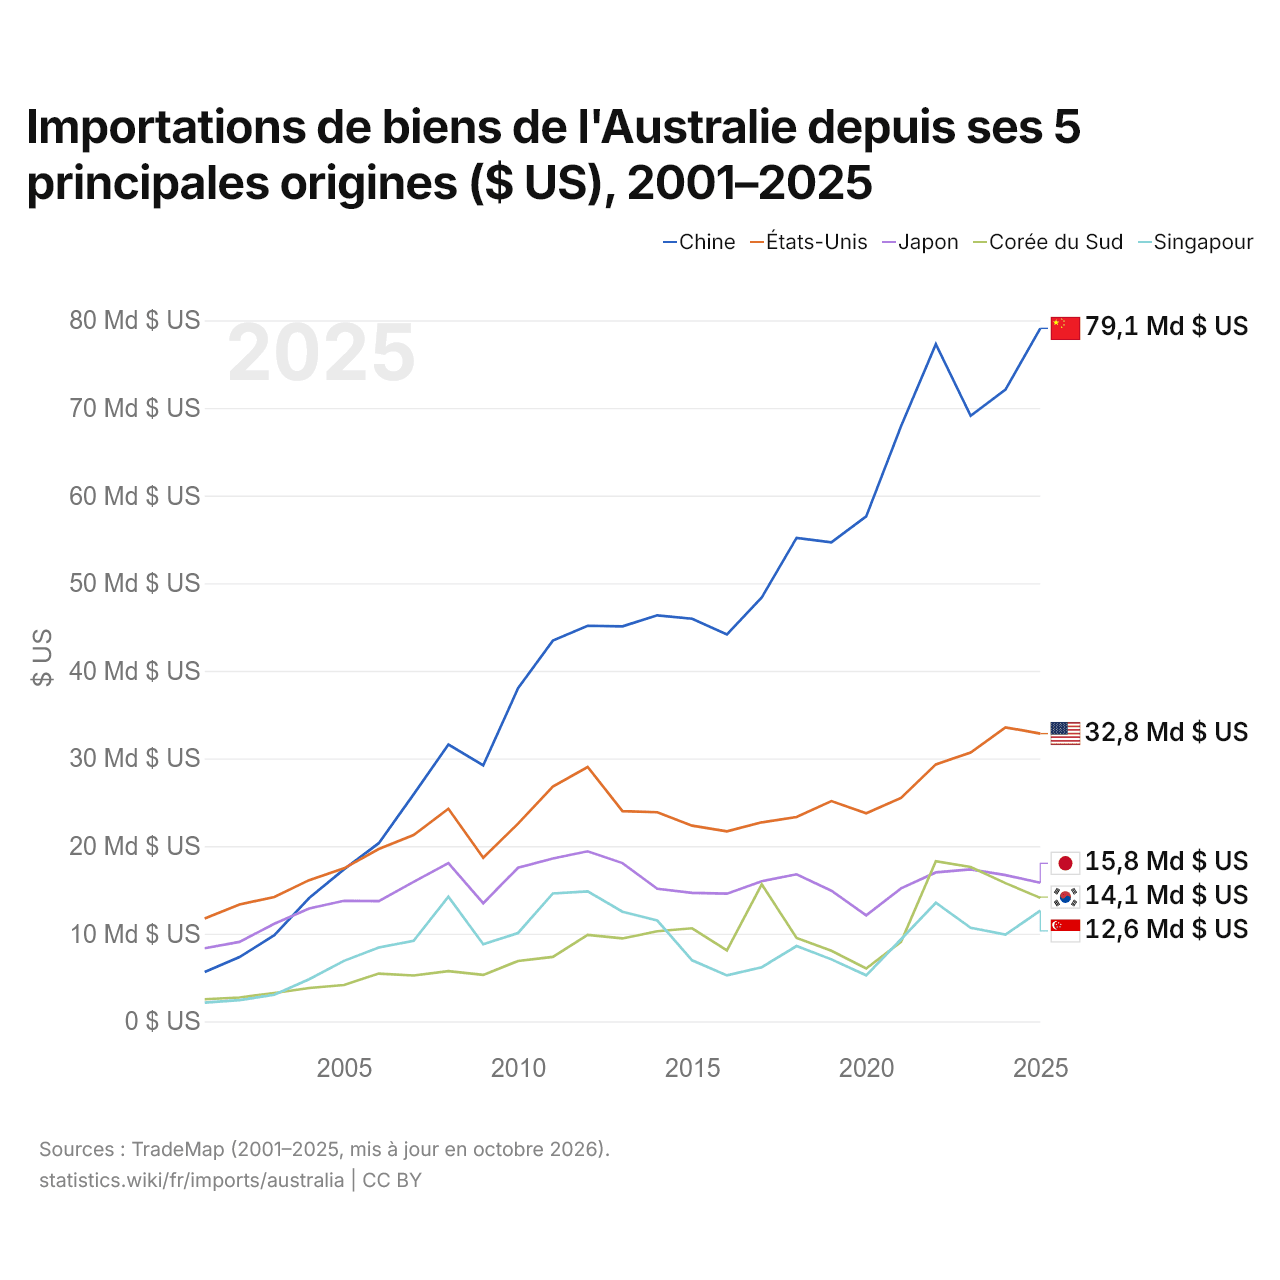
En 2025, les importations de biens s'élevaient à 79,1 milliards de dollars en provenance de la Chine, 32,8 milliards de dollars en provenance des États-Unis, 15,8 milliards de dollars en provenance du Japon, 14,1 milliards de dollars en provenance de la Corée du Sud et 12,6 milliards de dollars en provenance de Singapour. Le premier rang des cinq fournisseurs de l'Australie est occupé par la Chine depuis 2006. Le changement le plus récent dans leur ordre remonte à 2024, quand les importations de l'Australie en provenance du Japon ont dépassé celles en provenance de la Corée du Sud.
Importations de biens et de services de l'Australie ($ US), 1989–2025
| Année | $ US | |
|---|---|---|
| Biens | Services | |
| 2025 | 308 660 357 638 $ US | 116 082 018 835 $ US |
| 2024 | 296 878 422 813 $ US | 109 505 223 901 $ US |
| 2023 | 287 921 314 812 $ US | 101 268 882 066 $ US |
| 2022 | 300 429 567 790 $ US | 79 551 478 163 $ US |
| 2021 | 258 235 407 411 $ US | 50 032 935 788 $ US |
| 2020 | 211 738 991 039 $ US | 46 575 572 127 $ US |
| 2019 | 223 917 575 210 $ US | 77 214 696 629 $ US |
| 2018 | 237 122 119 992 $ US | 79 222 451 149 $ US |
| 2017 | 221 063 606 870 $ US | 72 416 202 097 $ US |
| 2016 | 198 702 570 114 $ US | 65 046 078 553 $ US |
| 2015 | 207 225 205 215 $ US | 65 118 548 962 $ US |
| 2014 | 238 695 501 155 $ US | 70 900 997 235 $ US |
| 2013 | 246 865 630 777 $ US | 75 524 492 779 $ US |
| 2012 | 266 665 469 822 $ US | 74 878 258 354 $ US |
| 2011 | 248 907 462 145 $ US | 68 407 252 171 $ US |
| 2010 | 202 384 819 754 $ US | 57 857 127 770 $ US |
| 2009 | 162 222 243 802 $ US | 46 315 363 574 $ US |
| 2008 | 196 732 943 587 $ US | 53 683 142 403 $ US |
| 2007 | 163 605 593 103 $ US | 45 771 952 707 $ US |
| 2006 | 136 711 892 849 $ US | 36 188 894 637 $ US |
| 2005 | 121 206 968 220 $ US | 31 054 904 800 $ US |
| 2004 | 105 747 013 710 $ US | 28 343 515 426 $ US |
| 2003 | 86 235 633 642 $ US | 22 269 637 926 $ US |
| 2002 | 70 731 725 170 $ US | 18 485 175 749 $ US |
| 2001 | 62 006 172 594 $ US | 17 471 509 324 $ US |
| 2000 | 68 928 612 291 $ US | 19 339 452 052 $ US |
| 1999 | 65 686 465 016 $ US | 19 216 118 693 $ US |
| 1998 | 61 075 069 811 $ US | 18 526 490 877 $ US |
| 1997 | 63 033 171 009 $ US | 19 714 054 898 $ US |
| 1996 | 61 005 952 689 $ US | 19 370 187 656 $ US |
| 1995 | 57 543 973 205 $ US | 17 879 039 533 $ US |
| 1994 | 50 624 768 683 $ US | 16 125 554 419 $ US |
| 1993 | 42 641 871 557 $ US | 13 961 197 852 $ US |
| 1992 | 41 100 809 474 $ US | 14 068 073 707 $ US |
| 1991 | 38 782 895 982 $ US | 13 896 989 829 $ US |
| 1990 | 39 236 085 998 $ US | 14 135 111 845 $ US |
| 1989 | 40 461 945 641 $ US | 13 530 709 784 $ US |
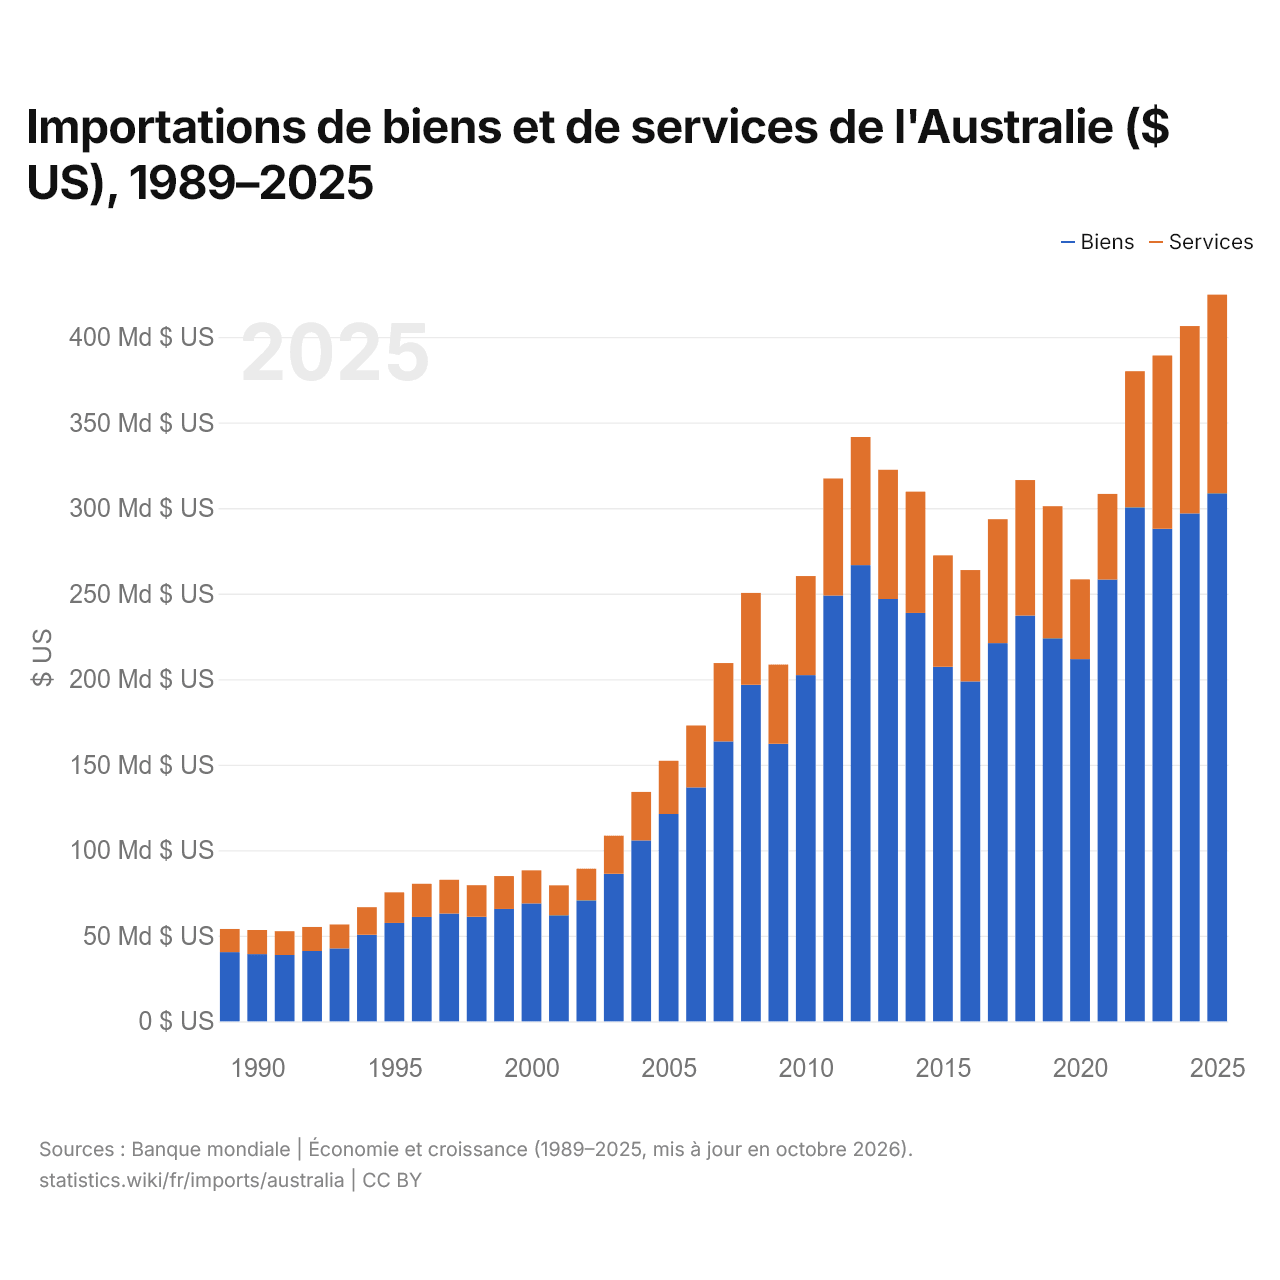
En 2025, les importations de biens de l'Australie s'élevaient à 309 milliards de dollars et celles de services à 116 milliards de dollars ; les services représentaient 27,3 % du total, contre 25,1 % en 1989.
L'Australie dans le classement mondial des importations, 2025
| Rang | Pays | Importations | Part mondiale | |
|---|---|---|---|---|
| 19 |
 Pologne |
488 Md $US | 1,45 % | |
| 20 |
 EAU |
482 Md $US (2023) | 1,59 % | |
| 21 |
Vietnam
|
474 Md $US | 1,41 % | vs Vietnam |
| 22 |
 Australie |
407 Md $US | 1,21 % | |
| 23 |
 Turquie |
401 Md $US | 1,19 % | vs Turquie |
| 24 |
 Brésil |
398 Md $US | 1,18 % | vs Brésil |
| 25 |
 Russie |
397 Md $US | 1,18 % | vs Russie |
Importations de biens et services de l'Australie, % du PIB, 1960–2025
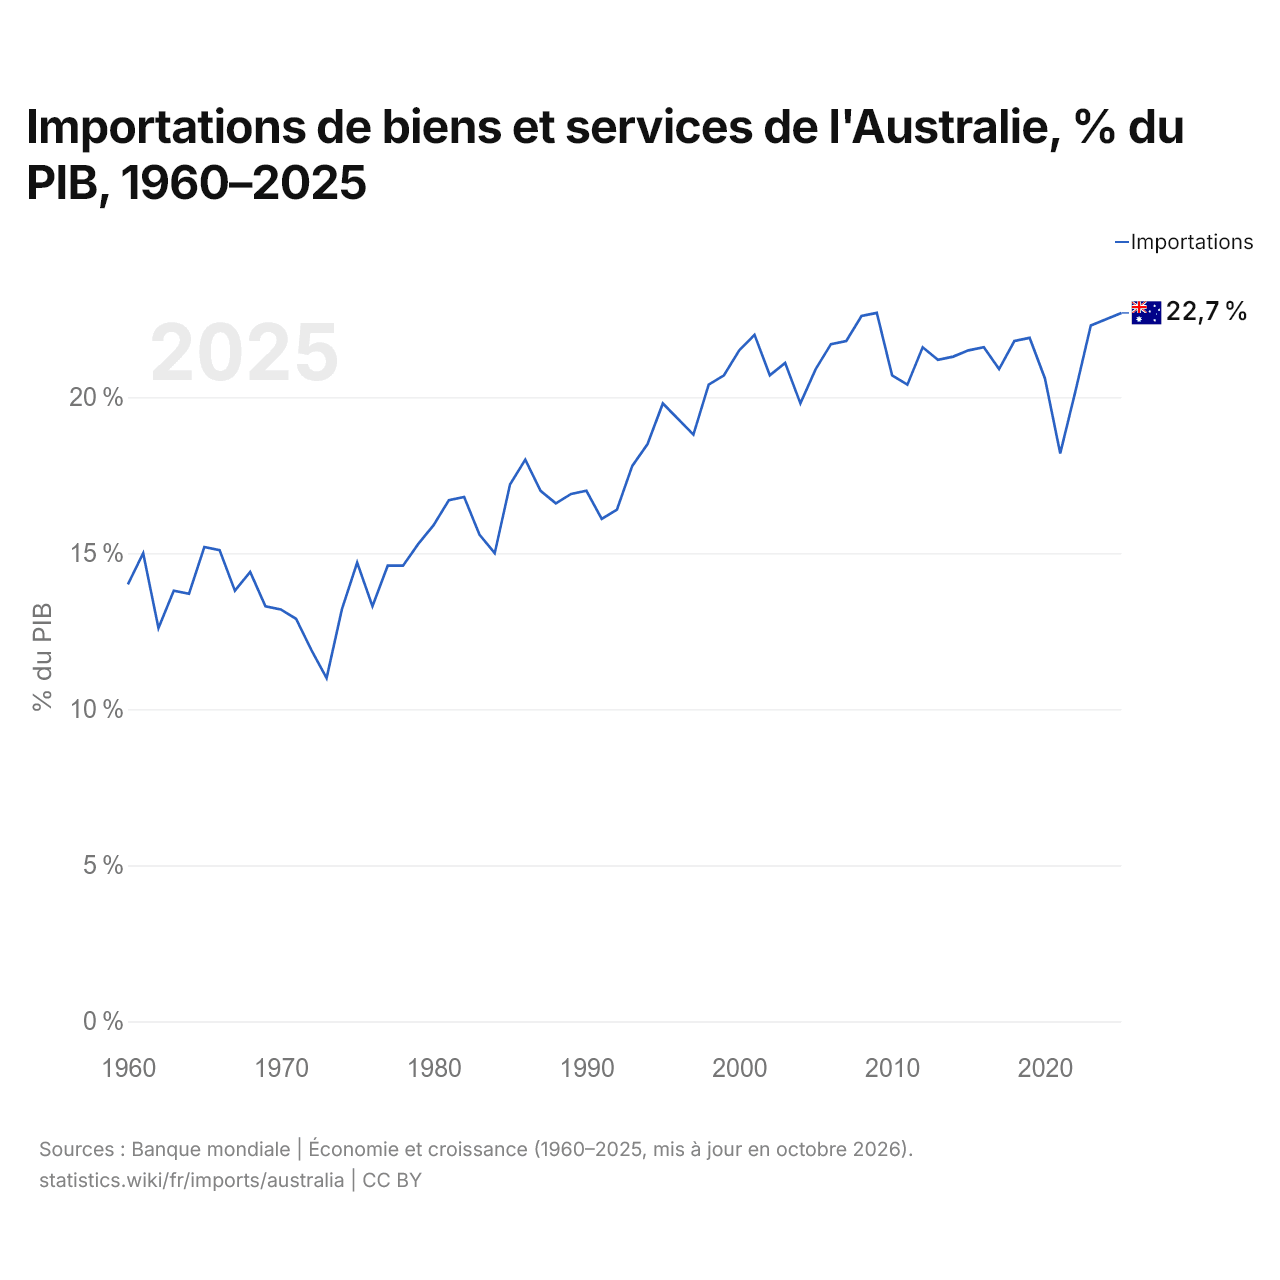
En 2025, les importations de biens et services de l'Australie équivalaient à 22,7 % de son PIB, contre 14,0 % en 1960. La part la plus faible a été de 11,0 %, en 1973.
Comparer les importations de l'Australie avec celles d'autres pays
Sources :
- TradeMap (2001–2025, mis à jour en octobre 2026)
- Banque mondiale | Économie et croissance (1960–2025, mis à jour en octobre 2026)
Creative Commons Attribution (CC BY) : vous pouvez copier, partager, adapter et réutiliser ce contenu, y compris à des fins commerciales, à condition de citer statistics.wiki et d’indiquer les modifications apportées. Les sources citées ci-dessus peuvent avoir leurs propres conditions de licence.