
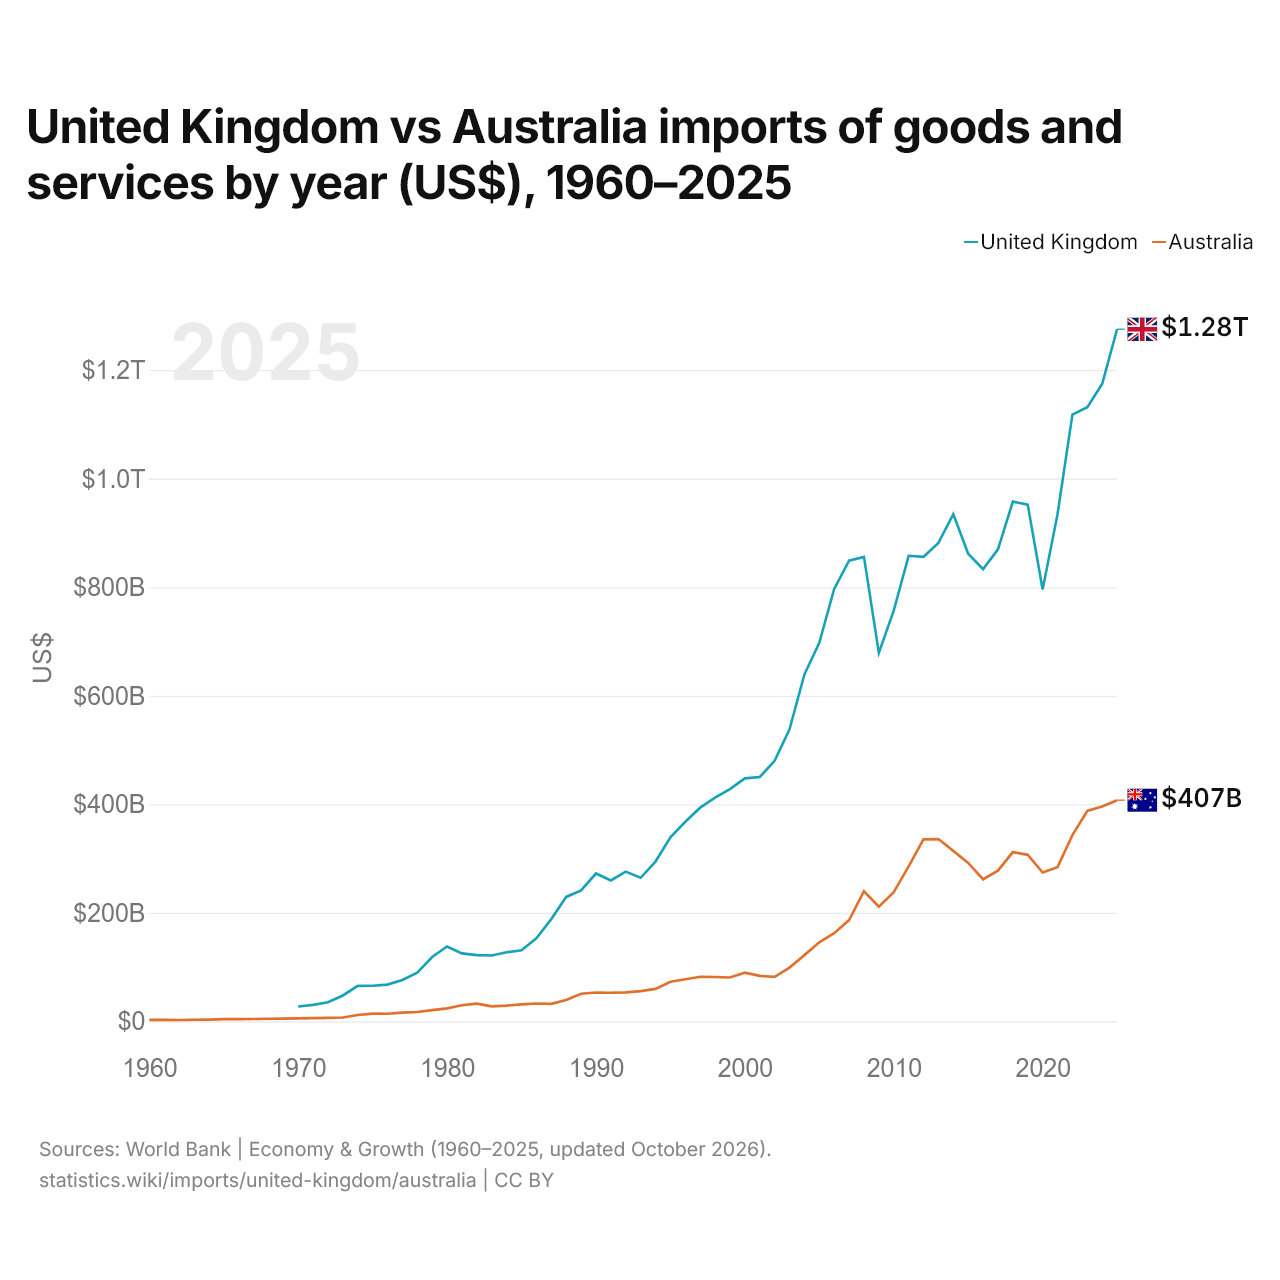
Royaume-Uni vs Australie : importations de biens et services par année ($ US), 1960–2025
| Année | $ US | |
|---|---|---|
 Royaume-Uni |
 Australie |
|
| 2025 | 1 275 239 250 328 $ US | 407 490 633 311 $ US |
| 2024 | 1 174 549 941 083 $ US | 395 749 225 409 $ US |
| 2023 | 1 131 603 446 868 $ US | 387 533 147 572 $ US |
| 2022 | 1 117 793 765 633 $ US | 343 078 219 088 $ US |
| 2021 | 934 375 952 194 $ US | 284 038 962 018 $ US |
| 2020 | 795 714 534 395 $ US | 274 154 332 727 $ US |
| 2019 | 951 880 342 949 $ US | 306 786 753 626 $ US |
| 2018 | 957 619 509 260 $ US | 311 861 687 285 $ US |
| 2017 | 869 550 502 969 $ US | 277 671 313 150 $ US |
| 2016 | 833 100 578 280 $ US | 261 827 324 556 $ US |
| 2015 | 861 463 440 127 $ US | 291 850 364 122 $ US |
| 2014 | 934 525 774 097 $ US | 314 156 216 979 $ US |
| 2013 | 881 359 614 350 $ US | 335 869 075 673 $ US |
| 2012 | 855 876 434 983 $ US | 335 367 853 143 $ US |
| 2011 | 857 771 146 098 $ US | 285 510 760 030 $ US |
| 2010 | 756 632 614 065 $ US | 238 100 480 913 $ US |
| 2009 | 678 917 276 834 $ US | 211 106 497 148 $ US |
| 2008 | 855 805 147 059 $ US | 239 715 332 950 $ US |
| 2007 | 848 867 547 019 $ US | 186 601 240 480 $ US |
| 2006 | 796 610 855 566 $ US | 162 450 827 270 $ US |
| 2005 | 697 472 727 273 $ US | 145 652 868 457 $ US |
| 2004 | 639 128 524 350 $ US | 121 992 459 809 $ US |
| 2003 | 537 968 979 592 $ US | 98 900 407 688 $ US |
| 2002 | 479 947 541 966 $ US | 82 017 039 226 $ US |
| 2001 | 450 228 875 774 $ US | 83 770 437 082 $ US |
| 2000 | 447 681 948 858 $ US | 89 663 284 608 $ US |
| 1999 | 427 731 758 615 $ US | 80 794 585 788 $ US |
| 1998 | 412 207 684 664 $ US | 81 674 014 787 $ US |
| 1997 | 393 672 233 137 $ US | 82 133 225 648 $ US |
| 1996 | 367 588 143 526 $ US | 77 631 200 583 $ US |
| 1995 | 339 072 116 143 $ US | 73 019 750 520 $ US |
| 1994 | 294 340 260 178 $ US | 59 676 236 596 $ US |
| 1993 | 264 458 431 314 $ US | 55 746 908 375 $ US |
| 1992 | 275 832 937 873 $ US | 53 341 618 614 $ US |
| 1991 | 259 644 733 686 $ US | 52 680 239 946 $ US |
| 1990 | 272 419 897 017 $ US | 53 060 646 565 $ US |
| 1989 | 241 323 782 723 $ US | 50 821 263 277 $ US |
| 1988 | 229 258 518 321 $ US | 39 231 436 371 $ US |
| 1987 | 188 351 657 134 $ US | 32 314 716 781 $ US |
| 1986 | 152 907 770 449 $ US | 32 912 702 854 $ US |
| 1985 | 130 952 876 027 $ US | 31 190 673 250 $ US |
| 1984 | 127 268 012 769 $ US | 28 996 243 475 $ US |
| 1983 | 121 326 941 034 $ US | 27 657 830 162 $ US |
| 1982 | 122 122 796 995 $ US | 32 610 614 587 $ US |
| 1981 | 125 119 803 055 $ US | 29 570 416 812 $ US |
| 1980 | 137 927 313 502 $ US | 23 827 298 050 $ US |
| 1979 | 118 503 699 704 $ US | 20 687 265 705 $ US |
| 1978 | 89 608 628 955 $ US | 17 265 414 582 $ US |
| 1977 | 76 156 548 055 $ US | 16 144 757 972 $ US |
| 1976 | 67 727 417 790 $ US | 14 038 081 937 $ US |
| 1975 | 65 493 940 265 $ US | 14 315 171 378 $ US |
| 1974 | 65 219 086 022 $ US | 11 737 656 595 $ US |
| 1973 | 47 681 185 693 $ US | 7 022 421 525 $ US |
| 1972 | 35 239 697 802 $ US | 6 220 794 393 $ US |
| 1971 | 30 409 471 891 $ US | 5 839 680 934 $ US |
| 1970 | 27 400 376 770 $ US | 5 455 520 873 $ US |
| 1969 | - | 4 883 200 781 $ US |
| 1968 | - | 4 730 880 757 $ US |
| 1967 | - | 4 222 400 676 $ US |
| 1966 | - | 4 124 960 660 $ US |
| 1965 | - | 3 959 200 633 $ US |
| 1964 | - | 3 270 400 523 $ US |
| 1963 | - | 2 974 720 476 $ US |
| 1962 | - | 2 512 160 402 $ US |
| 1961 | - | 2 952 320 472 $ US |
| 1960 | - | 2 611 840 418 $ US |
En 2025, les importations de biens et services du Royaume-Uni s'élevaient à 1,28 billion de dollars et celles de l'Australie à 407 milliards de dollars : celles du Royaume-Uni étaient 3,1 fois plus élevées. En 1970, les importations du Royaume-Uni étaient 5,0 fois plus élevées : 27,4 milliards de dollars pour le Royaume-Uni et 5,46 milliards de dollars pour l'Australie.
Les importations de biens et services du Royaume-Uni sont supérieures à celles de l'Australie chaque année depuis 1970.
Royaume-Uni vs Australie : chiffres des importations
|
Royaume-Uni
|
Australie
|
|
|---|---|---|
| Importations | 1,28 Bn $US (2025) | 407 Md $US (2025) |
| Rang mondial | 4/174 | 22/174 |
| Part mondiale | 3,78 % | 1,21 % |
| % du PIB | 31,9 % | 22,7 % |
| Première catégorie de biens | Machines, électronique et véhicules (34,4 %, 2025) | Machines, électronique et véhicules (45 %, 2025) |
| Première origine des biens | États-Unis (11,8 %, 2025) | Chine (26,6 %, 2025) |
Comparer les importations de 2 pays au choix
Sources :
- Banque mondiale | Économie et croissance (1960–2025, mis à jour en octobre 2026)
- TradeMap (2001–2025, mis à jour en octobre 2026)
Creative Commons Attribution (CC BY) : vous pouvez copier, partager, adapter et réutiliser ce contenu, y compris à des fins commerciales, à condition de citer statistics.wiki et d’indiquer les modifications apportées. Les sources citées ci-dessus peuvent avoir leurs propres conditions de licence.