
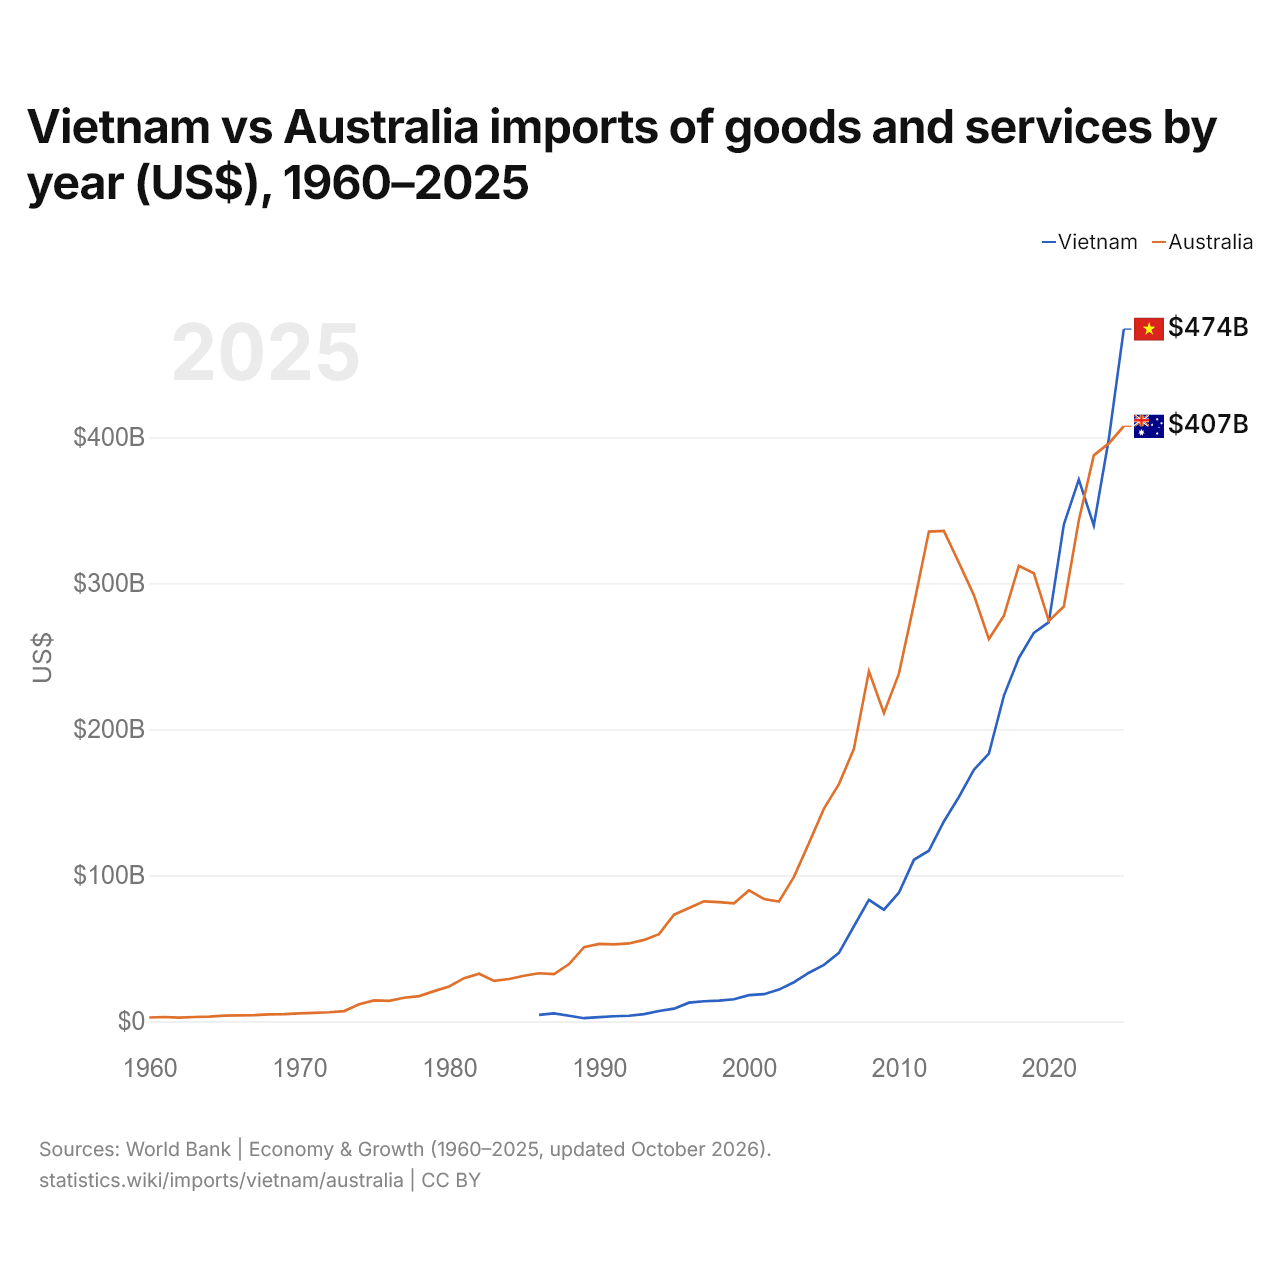
Vietnam vs Australie : importations de biens et services par année ($ US), 1960–2025
1x
| Année | $ US | |
|---|---|---|
 Vietnam |
 Australie |
|
| 2025 | 473 997 023 086 $ US | 407 490 633 311 $ US |
| 2024 | 398 774 125 641 $ US | 395 749 225 409 $ US |
| 2023 | 339 491 142 718 $ US | 387 533 147 572 $ US |
| 2022 | 370 998 835 149 $ US | 343 078 219 088 $ US |
| 2021 | 340 182 482 326 $ US | 284 038 962 018 $ US |
| 2020 | 273 355 953 900 $ US | 274 154 332 727 $ US |
| 2019 | 265 976 296 626 $ US | 306 786 753 626 $ US |
| 2018 | 248 830 928 923 $ US | 311 861 687 285 $ US |
| 2017 | 222 881 466 765 $ US | 277 671 313 150 $ US |
| 2016 | 183 315 160 787 $ US | 261 827 324 556 $ US |
| 2015 | 172 245 363 654 $ US | 291 850 364 122 $ US |
| 2014 | 153 638 953 980 $ US | 314 156 216 979 $ US |
| 2013 | 136 871 750 777 $ US | 335 869 075 673 $ US |
| 2012 | 116 865 795 250 $ US | 335 367 853 143 $ US |
| 2011 | 110 599 636 247 $ US | 285 510 760 030 $ US |
| 2010 | 88 029 012 389 $ US | 238 100 480 913 $ US |
| 2009 | 76 433 848 845 $ US | 211 106 497 148 $ US |
| 2008 | 83 250 410 219 $ US | 239 715 332 950 $ US |
| 2007 | 65 095 862 342 $ US | 186 601 240 480 $ US |
| 2006 | 46 856 276 474 $ US | 162 450 827 270 $ US |
| 2005 | 38 623 129 994 $ US | 145 652 868 457 $ US |
| 2004 | 33 292 010 669 $ US | 121 992 459 809 $ US |
| 2003 | 26 759 132 795 $ US | 98 900 407 688 $ US |
| 2002 | 21 724 925 554 $ US | 82 017 039 226 $ US |
| 2001 | 18 595 918 552 $ US | 83 770 437 082 $ US |
| 2000 | 17 922 825 684 $ US | 89 663 284 608 $ US |
| 1999 | 15 151 041 599 $ US | 80 794 585 788 $ US |
| 1998 | 14 190 608 829 $ US | 81 674 014 787 $ US |
| 1997 | 13 755 189 203 $ US | 82 133 225 648 $ US |
| 1996 | 12 781 756 978 $ US | 77 631 200 583 $ US |
| 1995 | 8 690 196 941 $ US | 73 019 750 520 $ US |
| 1994 | 7 078 095 300 $ US | 59 676 236 596 $ US |
| 1993 | 4 941 471 554 $ US | 55 746 908 375 $ US |
| 1992 | 3 831 479 525 $ US | 53 341 618 614 $ US |
| 1991 | 3 463 880 947 $ US | 52 680 239 946 $ US |
| 1990 | 2 930 215 540 $ US | 53 060 646 565 $ US |
| 1989 | 2 143 191 577 $ US | 50 821 263 277 $ US |
| 1988 | 3 814 891 104 $ US | 39 231 436 371 $ US |
| 1987 | 5 424 365 692 $ US | 32 314 716 781 $ US |
| 1986 | 4 370 865 661 $ US | 32 912 702 854 $ US |
| 1985 | - | 31 190 673 250 $ US |
| 1984 | - | 28 996 243 475 $ US |
| 1983 | - | 27 657 830 162 $ US |
| 1982 | - | 32 610 614 587 $ US |
| 1981 | - | 29 570 416 812 $ US |
| 1980 | - | 23 827 298 050 $ US |
| 1979 | - | 20 687 265 705 $ US |
| 1978 | - | 17 265 414 582 $ US |
| 1977 | - | 16 144 757 972 $ US |
| 1976 | - | 14 038 081 937 $ US |
| 1975 | - | 14 315 171 378 $ US |
| 1974 | - | 11 737 656 595 $ US |
| 1973 | - | 7 022 421 525 $ US |
| 1972 | - | 6 220 794 393 $ US |
| 1971 | - | 5 839 680 934 $ US |
| 1970 | - | 5 455 520 873 $ US |
| 1969 | - | 4 883 200 781 $ US |
| 1968 | - | 4 730 880 757 $ US |
| 1967 | - | 4 222 400 676 $ US |
| 1966 | - | 4 124 960 660 $ US |
| 1965 | - | 3 959 200 633 $ US |
| 1964 | - | 3 270 400 523 $ US |
| 1963 | - | 2 974 720 476 $ US |
| 1962 | - | 2 512 160 402 $ US |
| 1961 | - | 2 952 320 472 $ US |
| 1960 | - | 2 611 840 418 $ US |
En 2025, les importations de biens et services du Vietnam s'élevaient à 474 milliards de dollars et celles de l'Australie à 407 milliards de dollars : celles du Vietnam étaient supérieures de 16 %. En 1986, les importations de l'Australie étaient 7,5 fois plus élevées : 4,37 milliards de dollars pour le Vietnam et 32,9 milliards de dollars pour l'Australie.
Vietnam vs Australie : chiffres des importations
|
Vietnam
|
Australie
|
|
|---|---|---|
| Importations | 474 Md $US (2025) | 407 Md $US (2025) |
| Rang mondial | 21/174 | 22/174 |
| Part mondiale | 1,41 % | 1,21 % |
| % du PIB | 92,1 % | 22,7 % |
| Première catégorie de biens | Machines, électronique et véhicules (52,4 %, 2025) | Machines, électronique et véhicules (45 %, 2025) |
| Première origine des biens | Chine (41 %, 2025) | Chine (26,6 %, 2025) |
Comparer les importations de 2 pays au choix
Sources :
- Banque mondiale | Économie et croissance (1960–2025, mis à jour en octobre 2026)
- TradeMap (2001–2025, mis à jour en octobre 2026)
Creative Commons Attribution (CC BY) : vous pouvez copier, partager, adapter et réutiliser ce contenu, y compris à des fins commerciales, à condition de citer statistics.wiki et d’indiquer les modifications apportées. Les sources citées ci-dessus peuvent avoir leurs propres conditions de licence.