
Importations de biens et services des Philippines par année ($ US), 1981–2025
| Année | $ US | Rang mondial |
|---|---|---|
| Importations | Rang mondial | |
| 2025 | 196 019 381 536 $ US | #34 |
| 2024 | 185 253 897 877 $ US | #34 |
| 2023 | 178 244 920 795 $ US | #34 |
| 2022 | 178 086 451 580 $ US | #34 |
| 2021 | 148 699 308 217 $ US | #35 |
| 2020 | 119 257 490 806 $ US | #37 |
| 2019 | 152 458 687 320 $ US | #34 |
| 2018 | 145 499 457 398 $ US | #34 |
| 2017 | 126 846 380 456 $ US | #35 |
| 2016 | 111 847 835 762 $ US | #35 |
| 2015 | 97 858 999 139 $ US | #37 |
| 2014 | 89 583 209 902 $ US | #42 |
| 2013 | 84 169 697 682 $ US | #45 |
| 2012 | 79 558 185 309 $ US | #46 |
| 2011 | 74 224 237 016 $ US | #48 |
| 2010 | 69 239 834 653 $ US | #45 |
| 2009 | 53 966 293 099 $ US | #47 |
| 2008 | 62 341 268 152 $ US | #49 |
| 2007 | 55 577 057 555 $ US | #46 |
| 2006 | 50 557 042 720 $ US | #43 |
| 2005 | 45 777 705 832 $ US | #42 |
| 2004 | 43 034 427 467 $ US | #41 |
| 2003 | 39 402 271 857 $ US | #41 |
| 2002 | 36 959 602 031 $ US | #39 |
| 2001 | 34 524 004 924 $ US | #38 |
| 2000 | 34 981 626 688 $ US | #36 |
| 1999 | 33 185 853 155 $ US | #36 |
| 1998 | 31 488 192 531 $ US | #38 |
| 1997 | 39 658 755 051 $ US | #33 |
| 1996 | 33 097 093 183 $ US | #36 |
| 1995 | 26 565 213 158 $ US | #37 |
| 1994 | 20 814 444 388 $ US | #37 |
| 1993 | 17 470 673 089 $ US | #37 |
| 1992 | 14 629 138 823 $ US | #40 |
| 1991 | 12 042 290 328 $ US | #41 |
| 1990 | 11 884 167 064 $ US | #43 |
| 1989 | 10 451 339 114 $ US | #44 |
| 1988 | 8 338 839 042 $ US | #45 |
| 1987 | 7 110 796 810 $ US | #46 |
| 1986 | 5 497 051 340 $ US | #48 |
| 1985 | 5 530 347 257 $ US | #45 |
| 1984 | 6 389 098 503 $ US | #45 |
| 1983 | 7 401 720 302 $ US | #42 |
| 1982 | 7 727 510 026 $ US | #42 |
| 1981 | 7 741 092 150 $ US | #43 |
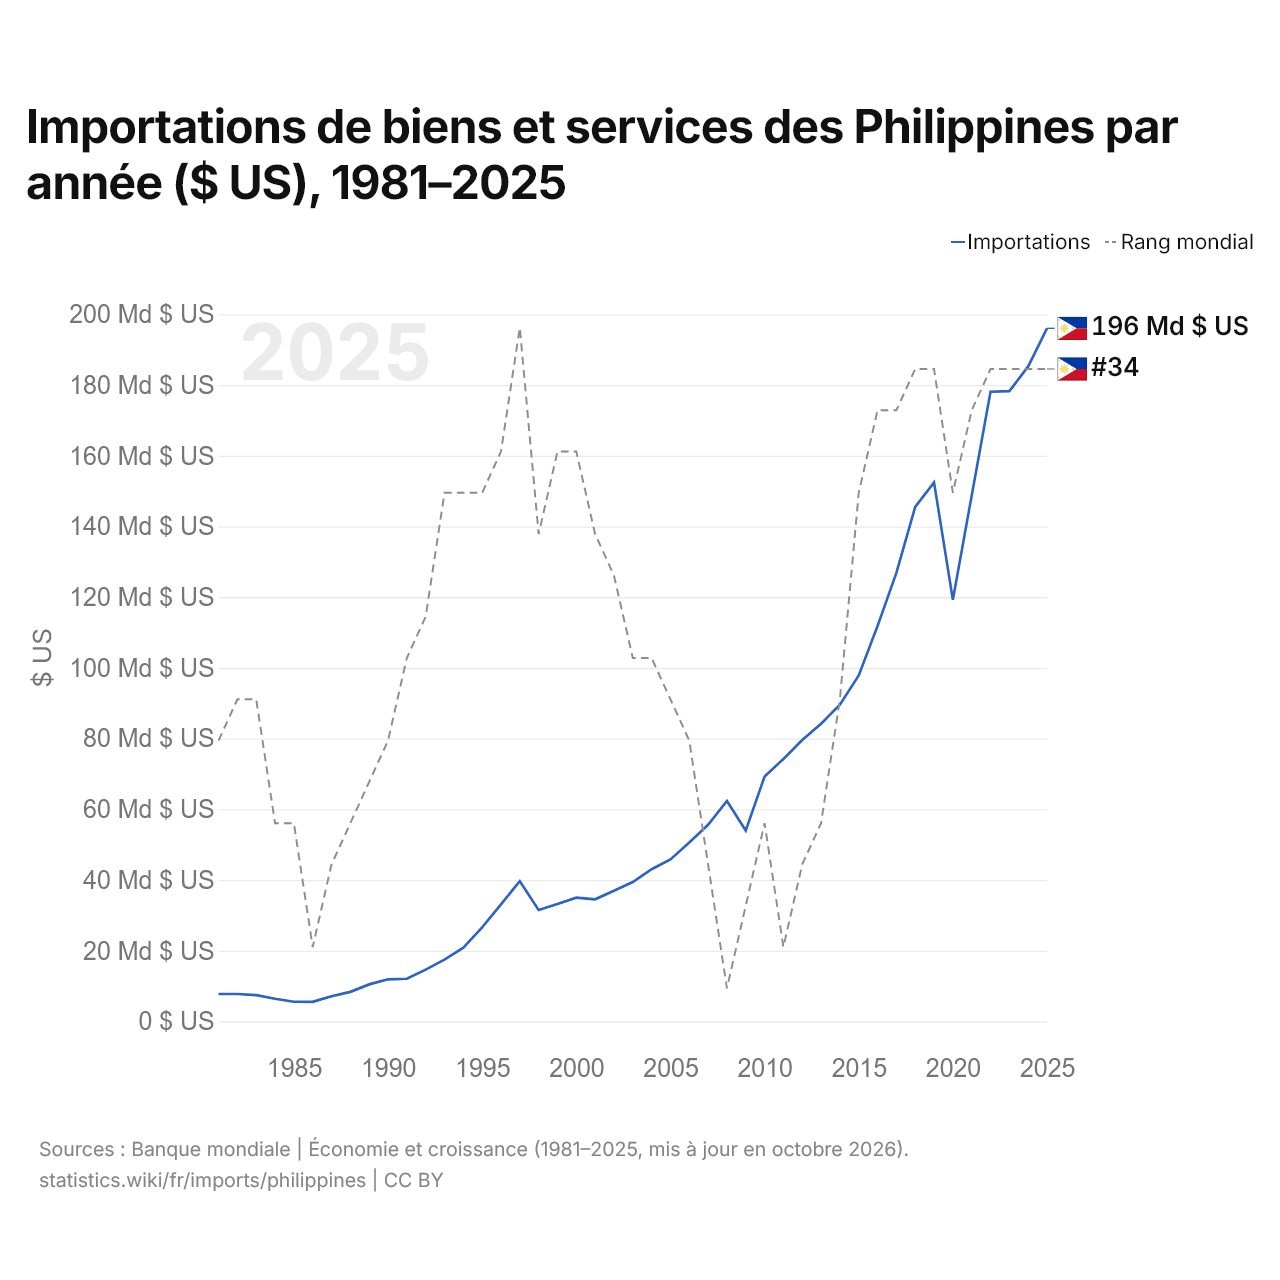
En 2025, les importations de biens et services des Philippines s'élevaient à 196 milliards de dollars, contre 7,74 milliards de dollars en 1981. Le minimum a été de 5,5 milliards de dollars, en 1986. Elles se classaient au 34e rang mondial, un rang qu'elles occupent depuis 2022. Leur meilleur rang a été le 33e, occupé pour la dernière fois en 1997.
En 2025, les importations de biens et services des Philippines étaient les 14es plus élevées de 44 pays situés en Asie. En 2025, les importations des Philippines dépassaient leurs exportations de 66,7 milliards de dollars, soit un déficit commercial. Le commerce des Philippines, exportations et importations réunies, équivalait à 66,8 % de leur PIB en 2025, au 109e rang mondial.
Importations de biens des Philippines par catégorie, 2025
Importations de biens, 2025: 142 Md $US
En 2025, la première catégorie des importations de biens des Philippines était « machines, électronique et véhicules », avec 43,5 %, suivie de « pétrole, gaz, minerais et autres matières premières », avec 16,2 %.
Origines des importations de biens des Philippines : les 10 premières, 2025
| Rang | Pays | Importations de biens | Part | |
|---|---|---|---|---|
| 1 |
 Chine |
40,3 Md $US | 28,4 % | vs Chine |
| 2 |
 Corée du Sud |
11,2 Md $US | 7,9 % | vs Corée du Sud |
| 3 |
 Japon |
11,2 Md $US | 7,88 % | vs Japon |
| 4 |
 Indonésie |
10,9 Md $US | 7,67 % | vs Indonésie |
| 5 |
 États-Unis |
8,86 Md $US | 6,25 % | |
| 6 |
 Thaïlande |
7,85 Md $US | 5,54 % | vs Thaïlande |
| 7 |
 Singapour |
5,97 Md $US | 4,21 % | vs Singapour |
| 8 |
 Malaisie |
5,93 Md $US | 4,19 % | vs Malaisie |
| 9 |
 Vietnam |
5,86 Md $US | 4,14 % | vs Vietnam |
| 10 |
 Australie |
2,67 Md $US | 1,88 % | vs Australie |
| Autres partenaires et non précisés | 31,1 Md $US | 21,9 % |
Importations de biens des Philippines depuis leurs 5 principales origines ($ US), 2001–2025
| Année | $ US | ||||
|---|---|---|---|---|---|
| Chine | Corée du Sud | Japon | Indonésie | États-Unis | |
| 2025 | 40 259 066 000 $ US | 11 193 900 000 $ US | 11 169 339 000 $ US | 10 870 636 000 $ US | 8 857 491 000 $ US |
| 2024 | 34 497 939 000 $ US | 10 020 451 000 $ US | 10 673 010 000 $ US | 11 290 704 000 $ US | 8 847 145 000 $ US |
| 2023 | 30 934 029 000 $ US | 8 879 728 000 $ US | 10 920 814 000 $ US | 12 283 886 000 $ US | 9 113 246 000 $ US |
| 2022 | 29 796 358 000 $ US | 12 730 035 000 $ US | 13 086 142 000 $ US | 13 935 822 000 $ US | 9 690 544 000 $ US |
| 2021 | 28 209 949 000 $ US | 9 628 490 000 $ US | 11 831 921 000 $ US | 9 027 969 000 $ US | 8 282 184 000 $ US |
| 2020 | 20 958 563 000 $ US | 7 018 492 000 $ US | 8 716 882 000 $ US | 5 863 570 000 $ US | 7 136 033 000 $ US |
| 2019 | 25 749 016 000 $ US | 8 502 307 000 $ US | 10 748 257 000 $ US | 6 978 545 000 $ US | 8 225 453 000 $ US |
| 2018 | 22 579 343 000 $ US | 11 503 052 000 $ US | 11 396 632 000 $ US | 6 789 011 000 $ US | 8 322 048 000 $ US |
| 2017 | 17 818 610 000 $ US | 8 420 299 000 $ US | 11 410 502 000 $ US | 6 711 426 000 $ US | 7 916 009 000 $ US |
| 2016 | 15 916 115 000 $ US | 5 625 038 000 $ US | 10 196 483 000 $ US | 4 707 532 000 $ US | 7 694 955 000 $ US |
| 2015 | 11 477 931 000 $ US | 4 550 222 000 $ US | 6 760 904 000 $ US | 3 108 900 000 $ US | 7 639 150 000 $ US |
| 2014 | 10 283 721 000 $ US | 5 234 082 000 $ US | 5 538 671 000 $ US | 3 184 995 000 $ US | 5 996 959 000 $ US |
| 2013 | 8 596 858 000 $ US | 5 050 471 000 $ US | 5 594 520 000 $ US | 2 983 436 000 $ US | 7 418 335 000 $ US |
| 2012 | 7 136 410 000 $ US | 4 730 848 000 $ US | 6 960 940 000 $ US | 2 924 616 000 $ US | 7 590 063 000 $ US |
| 2011 | 6 504 583 000 $ US | 4 640 494 000 $ US | 7 016 762 000 $ US | 2 543 807 000 $ US | 6 949 948 000 $ US |
| 2010 | 4 954 295 000 $ US | 4 040 349 000 $ US | 7 301 840 000 $ US | 2 469 353 000 $ US | 6 323 530 000 $ US |
| 2009 | 4 060 394 000 $ US | 3 160 860 000 $ US | 5 764 923 000 $ US | 1 915 055 000 $ US | 5 488 211 000 $ US |
| 2008 | 4 561 087 000 $ US | 3 128 522 000 $ US | 7 121 851 000 $ US | 1 602 258 000 $ US | 7 738 121 000 $ US |
| 2007 | 4 232 895 000 $ US | 3 403 906 000 $ US | 7 219 107 000 $ US | 1 357 154 000 $ US | 8 115 338 000 $ US |
| 2006 | 3 869 393 000 $ US | 3 332 345 000 $ US | 7 676 911 000 $ US | 1 068 980 000 $ US | 8 698 681 000 $ US |
| 2005 | 3 134 145 000 $ US | 2 386 083 000 $ US | 8 464 166 000 $ US | 1 092 889 000 $ US | 9 340 404 000 $ US |
| 2004 | 2 816 822 000 $ US | 2 852 761 000 $ US | 8 050 849 000 $ US | 998 370 000 $ US | 8 547 212 000 $ US |
| 2003 | 1 950 663 000 $ US | 2 695 091 000 $ US | 8 295 476 000 $ US | 891 199 000 $ US | 9 293 231 000 $ US |
| 2002 | 1 351 979 000 $ US | 3 114 426 000 $ US | 7 926 492 000 $ US | 815 958 000 $ US | 9 630 544 000 $ US |
| 2001 | 1 074 345 000 $ US | 2 199 086 000 $ US | 6 995 947 000 $ US | 821 846 000 $ US | 6 642 875 000 $ US |
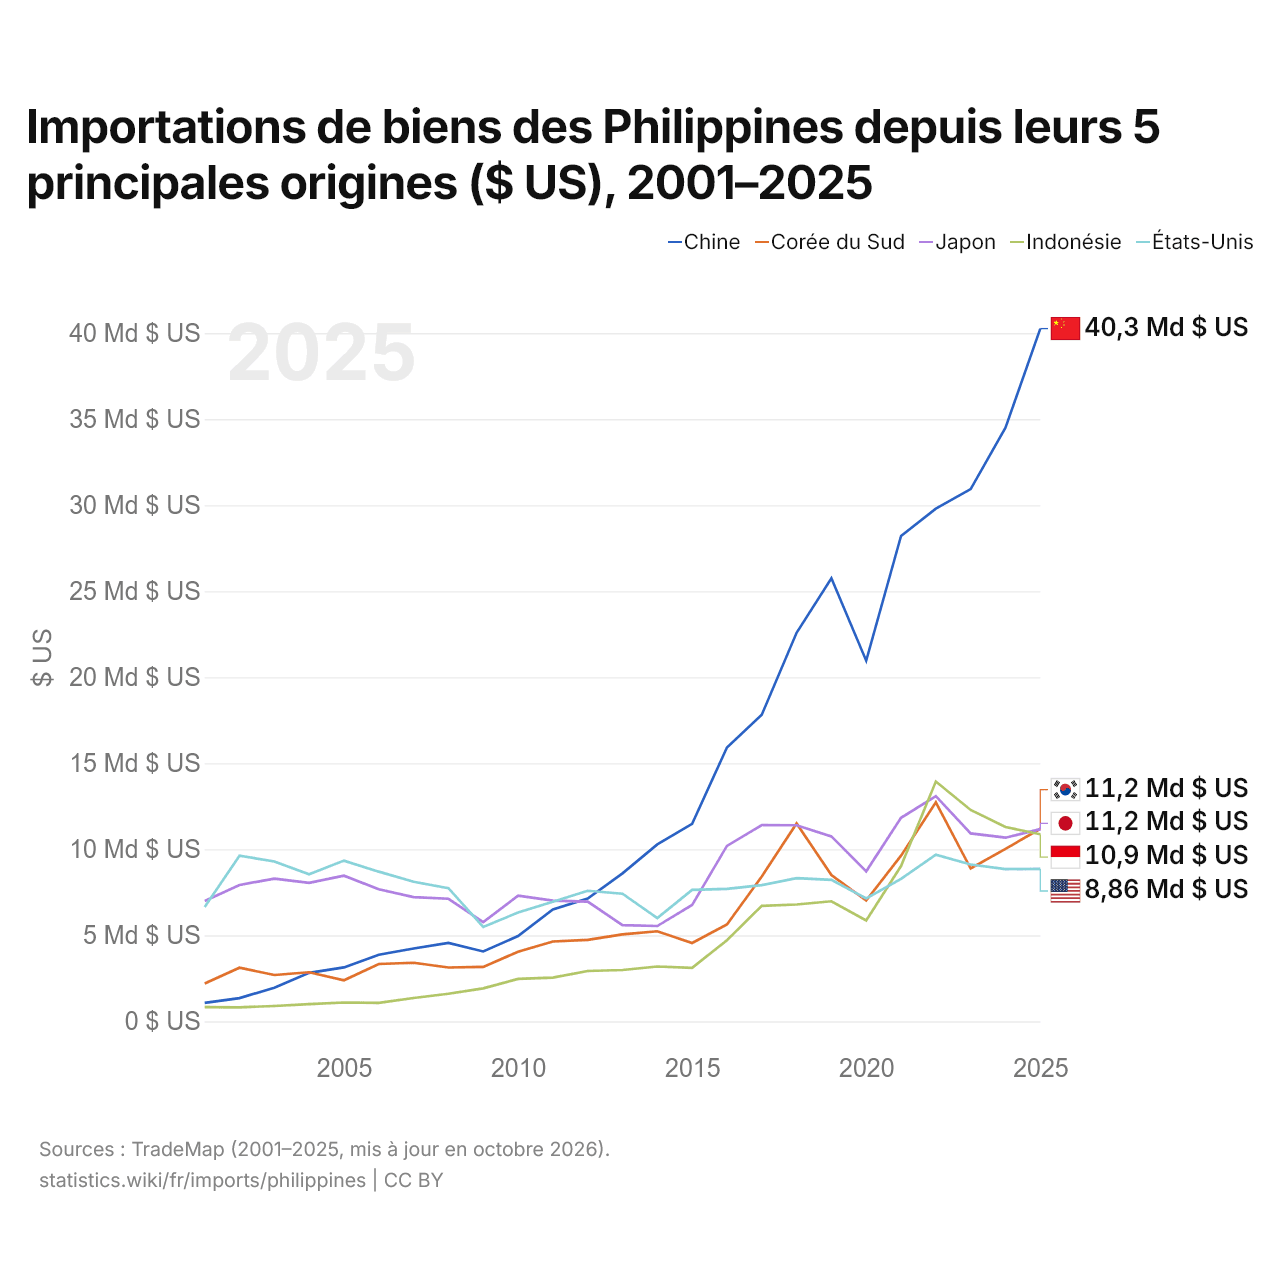
En 2025, les importations de biens s'élevaient à 40,3 milliards de dollars en provenance de la Chine, 11,2 milliards de dollars en provenance de la Corée du Sud, 11,2 milliards de dollars en provenance du Japon, 10,9 milliards de dollars en provenance de l'Indonésie et 8,86 milliards de dollars en provenance des États-Unis. Le premier rang des cinq fournisseurs des Philippines est occupé par la Chine depuis 2013.
Importations de biens et de services des Philippines ($ US), 1977–2025
| Année | $ US | |
|---|---|---|
| Biens | Services | |
| 2025 | 130 594 198 625 $ US | 38 094 831 162 $ US |
| 2024 | 123 919 858 028 $ US | 36 799 266 189 $ US |
| 2023 | 121 292 450 789 $ US | 30 148 890 490 $ US |
| 2022 | 127 411 577 440 $ US | 25 226 475 128 $ US |
| 2021 | 107 033 747 895 $ US | 19 531 184 173 $ US |
| 2020 | 81 986 787 676 $ US | 17 955 831 486 $ US |
| 2019 | 102 788 477 625 $ US | 28 224 651 934 $ US |
| 2018 | 102 949 246 903 $ US | 26 788 965 530 $ US |
| 2017 | 92 029 051 174 $ US | 26 138 511 091 $ US |
| 2016 | 78 283 237 169 $ US | 24 160 460 096 $ US |
| 2015 | 66 506 329 326 $ US | 23 610 210 252 $ US |
| 2014 | 67 154 110 408 $ US | 20 921 610 612 $ US |
| 2013 | 62 174 376 901 $ US | 16 320 385 334 $ US |
| 2012 | 65 310 365 444 $ US | 14 260 545 036 $ US |
| 2011 | 58 704 507 744 $ US | 12 316 215 274 $ US |
| 2010 | 53 630 915 708 $ US | 12 017 152 840 $ US |
| 2009 | 43 003 010 236 $ US | 9 186 206 945 $ US |
| 2008 | 53 324 367 114 $ US | 11 084 251 514 $ US |
| 2007 | 46 768 758 845 $ US | 7 543 665 308 $ US |
| 2006 | 42 193 601 225 $ US | 6 587 470 863 $ US |
| 2005 | 37 307 405 807 $ US | 6 463 320 577 $ US |
| 2004 | 34 158 000 000 $ US | 5 865 000 000 $ US |
| 2003 | 31 615 000 000 $ US | 5 407 000 000 $ US |
| 2002 | 29 093 000 000 $ US | 5 483 000 000 $ US |
| 2001 | 27 564 000 000 $ US | 5 410 000 000 $ US |
| 2000 | 30 055 000 000 $ US | 5 247 000 000 $ US |
| 1999 | 26 029 000 000 $ US | 5 147 000 000 $ US |
| 1998 | 29 524 000 000 $ US | 10 107 000 000 $ US |
| 1997 | 36 355 000 000 $ US | 14 122 000 000 $ US |
| 1996 | 31 885 000 000 $ US | 9 429 000 000 $ US |
| 1995 | 26 391 000 000 $ US | 6 926 000 000 $ US |
| 1994 | 21 333 000 000 $ US | 4 654 000 000 $ US |
| 1993 | 17 597 000 000 $ US | 3 090 000 000 $ US |
| 1992 | 14 519 000 000 $ US | 2 308 000 000 $ US |
| 1991 | 12 051 000 000 $ US | 1 804 000 000 $ US |
| 1990 | 12 206 000 000 $ US | 1 761 000 000 $ US |
| 1989 | 10 419 000 000 $ US | 1 564 000 000 $ US |
| 1988 | 8 159 000 000 $ US | 1 308 000 000 $ US |
| 1987 | 6 737 000 000 $ US | 1 155 000 000 $ US |
| 1986 | 5 044 000 000 $ US | 844 000 000 $ US |
| 1985 | 5 111 000 000 $ US | 867 000 000 $ US |
| 1984 | 6 070 000 000 $ US | 1 194 000 000 $ US |
| 1983 | 7 487 000 000 $ US | 1 733 000 000 $ US |
| 1982 | 7 667 000 000 $ US | 1 823 000 000 $ US |
| 1981 | 7 946 000 000 $ US | 1 632 000 000 $ US |
| 1980 | 7 727 000 000 $ US | 1 439 000 000 $ US |
| 1979 | 6 142 000 000 $ US | 1 180 000 000 $ US |
| 1978 | 4 732 000 000 $ US | 1 000 000 000 $ US |
| 1977 | 3 915 000 000 $ US | 856 000 000 $ US |
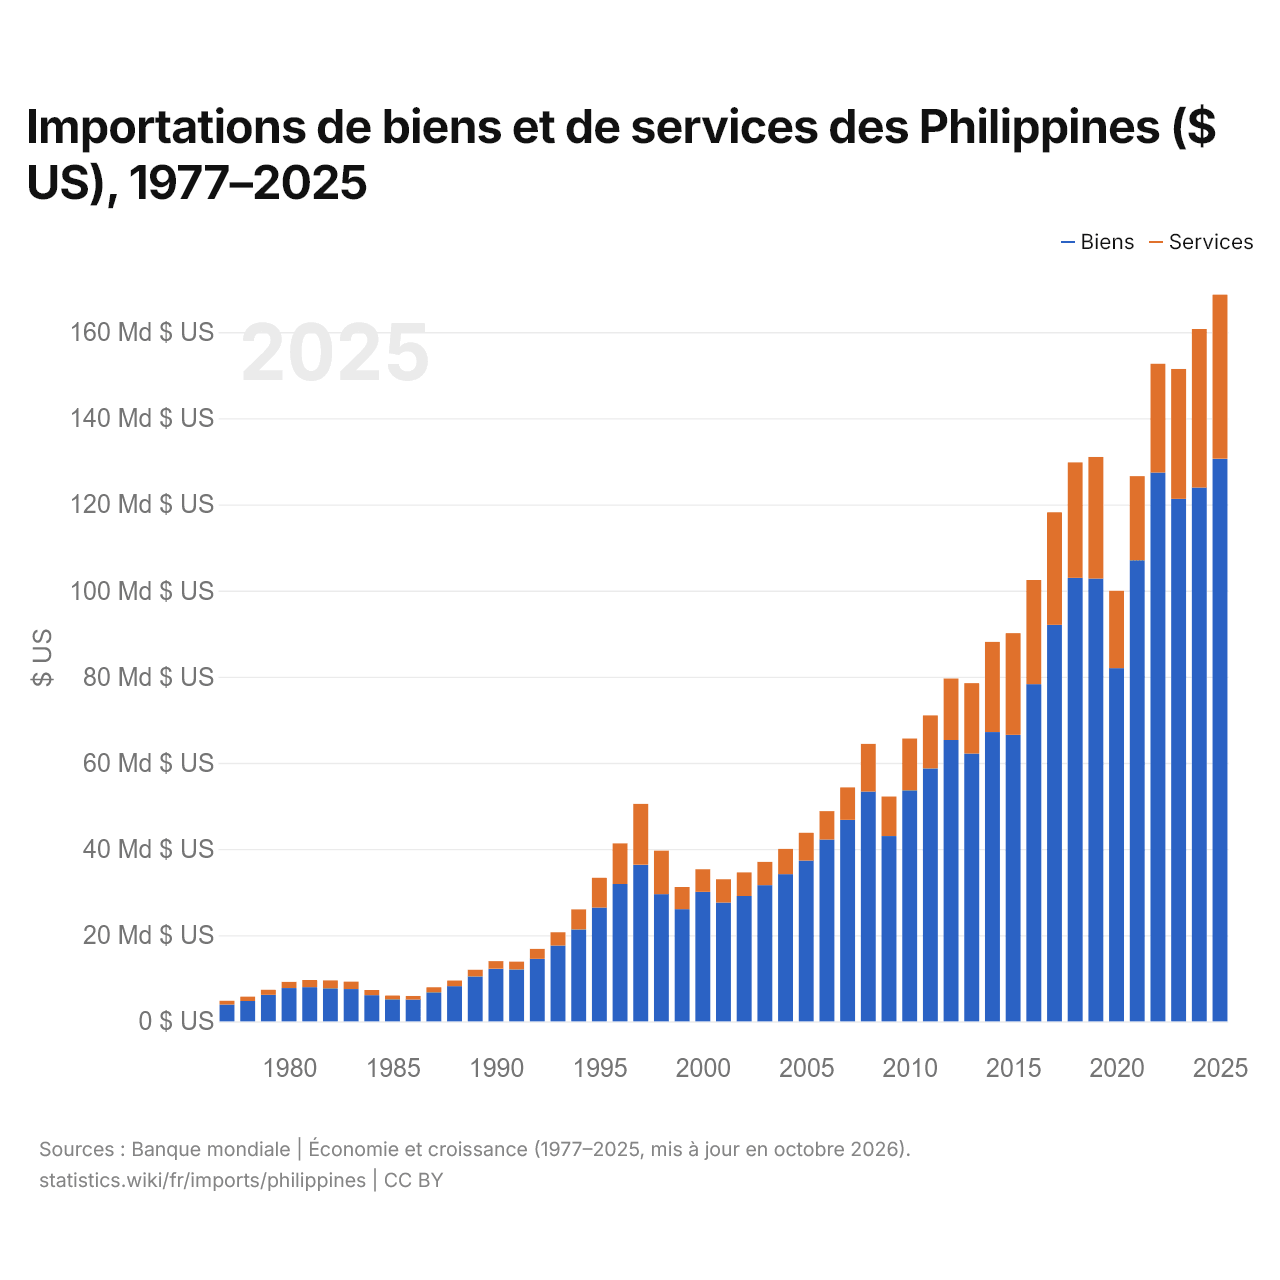
En 2025, les importations de biens des Philippines s'élevaient à 131 milliards de dollars et celles de services à 38,1 milliards de dollars ; les services représentaient 22,6 % du total, contre 17,9 % en 1977.
Les Philippines dans le classement mondial des importations, 2025






Importations de biens et services des Philippines, % du PIB, 1981–2025
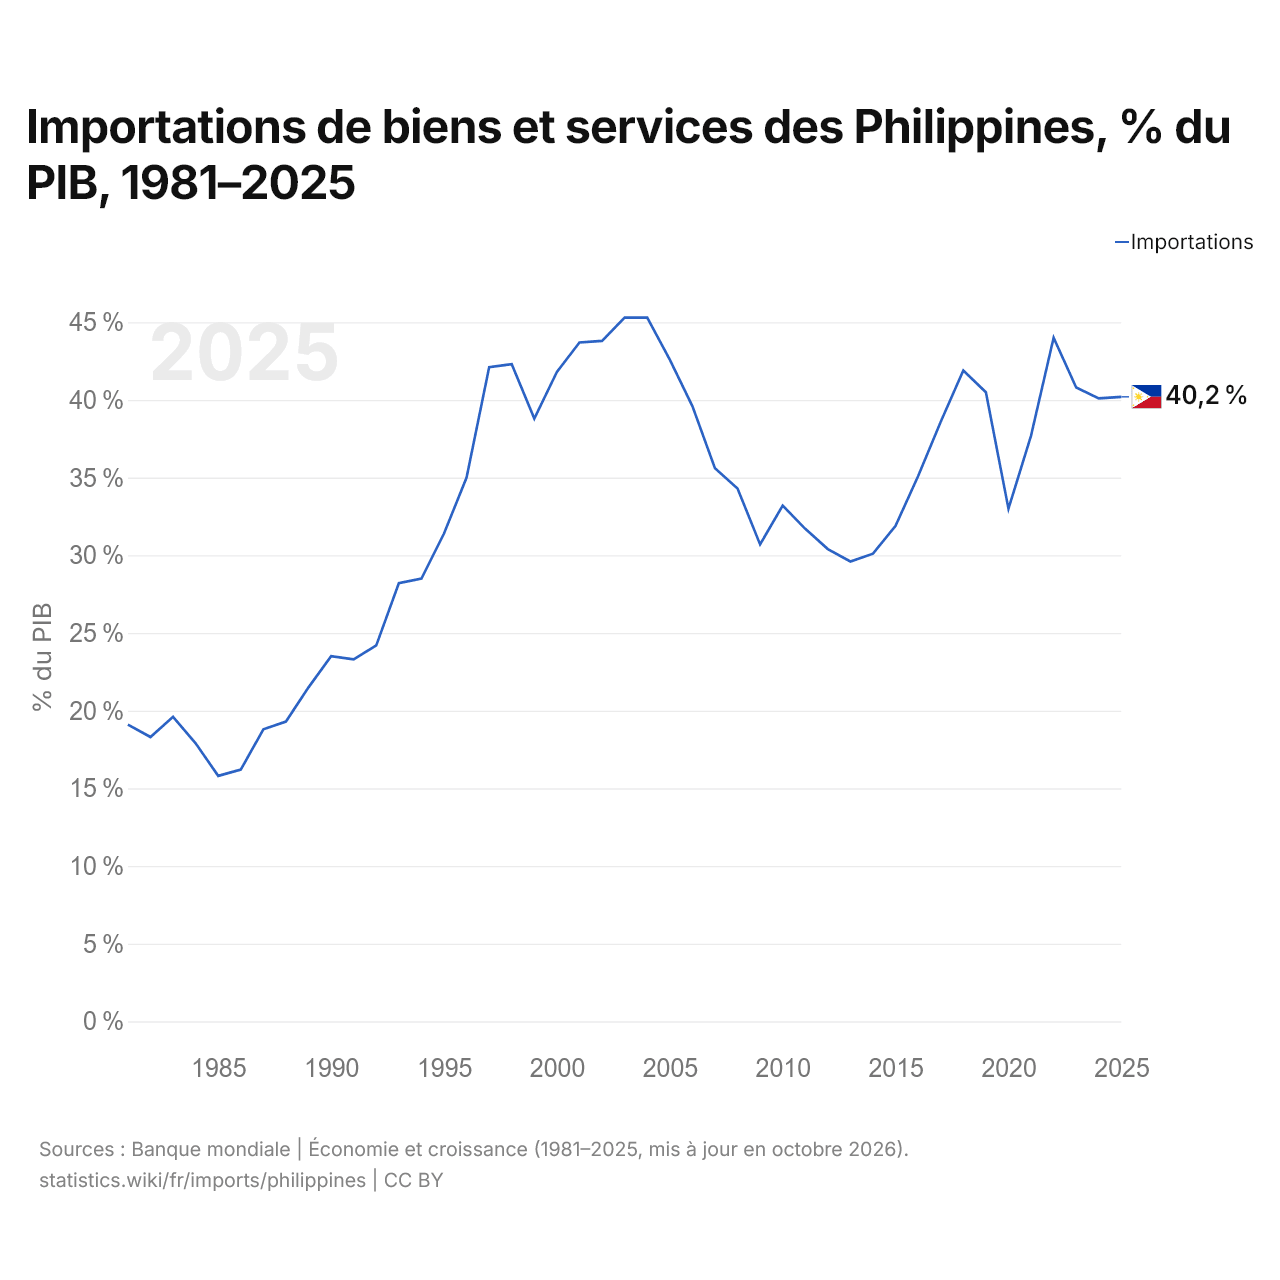
En 2025, les importations de biens et services des Philippines équivalaient à 40,2 % de leur PIB, contre 19,1 % en 1981. La part la plus élevée a été de 45,3 %, en 2004.
Comparer les importations des Philippines avec celles d'autres pays
Sources :
- TradeMap (2001–2025, mis à jour en octobre 2026)
- Banque mondiale | Économie et croissance (1977–2025, mis à jour en octobre 2026)
Creative Commons Attribution (CC BY) : vous pouvez copier, partager, adapter et réutiliser ce contenu, y compris à des fins commerciales, à condition de citer statistics.wiki et d’indiquer les modifications apportées. Les sources citées ci-dessus peuvent avoir leurs propres conditions de licence.