
Exportations de biens et services des Philippines par année ($ US), 1981–2025
| Année | $ US | Rang mondial |
|---|---|---|
| Exportations | Rang mondial | |
| 2025 | 129 323 001 566 $ US | #43 |
| 2024 | 118 820 216 615 $ US | #44 |
| 2023 | 116 417 848 992 $ US | #44 |
| 2022 | 114 785 414 694 $ US | #44 |
| 2021 | 101 485 514 508 $ US | #44 |
| 2020 | 91 171 559 891 $ US | #41 |
| 2019 | 106 953 484 846 $ US | #39 |
| 2018 | 104 793 441 904 $ US | #42 |
| 2017 | 97 073 582 742 $ US | #40 |
| 2016 | 84 987 391 168 $ US | #40 |
| 2015 | 83 377 968 054 $ US | #41 |
| 2014 | 81 375 151 612 $ US | #50 |
| 2013 | 74 318 435 289 $ US | #52 |
| 2012 | 71 941 908 435 $ US | #52 |
| 2011 | 68 169 783 856 $ US | #52 |
| 2010 | 68 500 918 812 $ US | #47 |
| 2009 | 53 178 736 402 $ US | #47 |
| 2008 | 60 584 223 734 $ US | #54 |
| 2007 | 59 294 683 204 $ US | #48 |
| 2006 | 52 651 035 880 $ US | #46 |
| 2005 | 44 289 298 774 $ US | #46 |
| 2004 | 39 736 335 346 $ US | #42 |
| 2003 | 36 821 904 273 $ US | #42 |
| 2002 | 33 727 726 965 $ US | #39 |
| 2001 | 32 480 429 837 $ US | #39 |
| 2000 | 36 266 016 498 $ US | #36 |
| 1999 | 32 895 382 042 $ US | #36 |
| 1998 | 28 163 249 809 $ US | #37 |
| 1997 | 33 018 279 728 $ US | #34 |
| 1996 | 27 340 728 434 $ US | #37 |
| 1995 | 21 961 852 797 $ US | #39 |
| 1994 | 17 613 597 499 $ US | #40 |
| 1993 | 13 836 087 972 $ US | #42 |
| 1992 | 12 555 557 117 $ US | #44 |
| 1991 | 10 856 619 094 $ US | #44 |
| 1990 | 9 795 179 684 $ US | #48 |
| 1989 | 9 576 565 365 $ US | #47 |
| 1988 | 8 630 151 223 $ US | #45 |
| 1987 | 7 007 121 197 $ US | #45 |
| 1986 | 6 310 106 782 $ US | #46 |
| 1985 | 5 951 187 302 $ US | #45 |
| 1984 | 6 053 575 751 $ US | #45 |
| 1983 | 5 554 591 565 $ US | #45 |
| 1982 | 5 854 443 596 $ US | #45 |
| 1981 | 6 543 358 555 $ US | #42 |
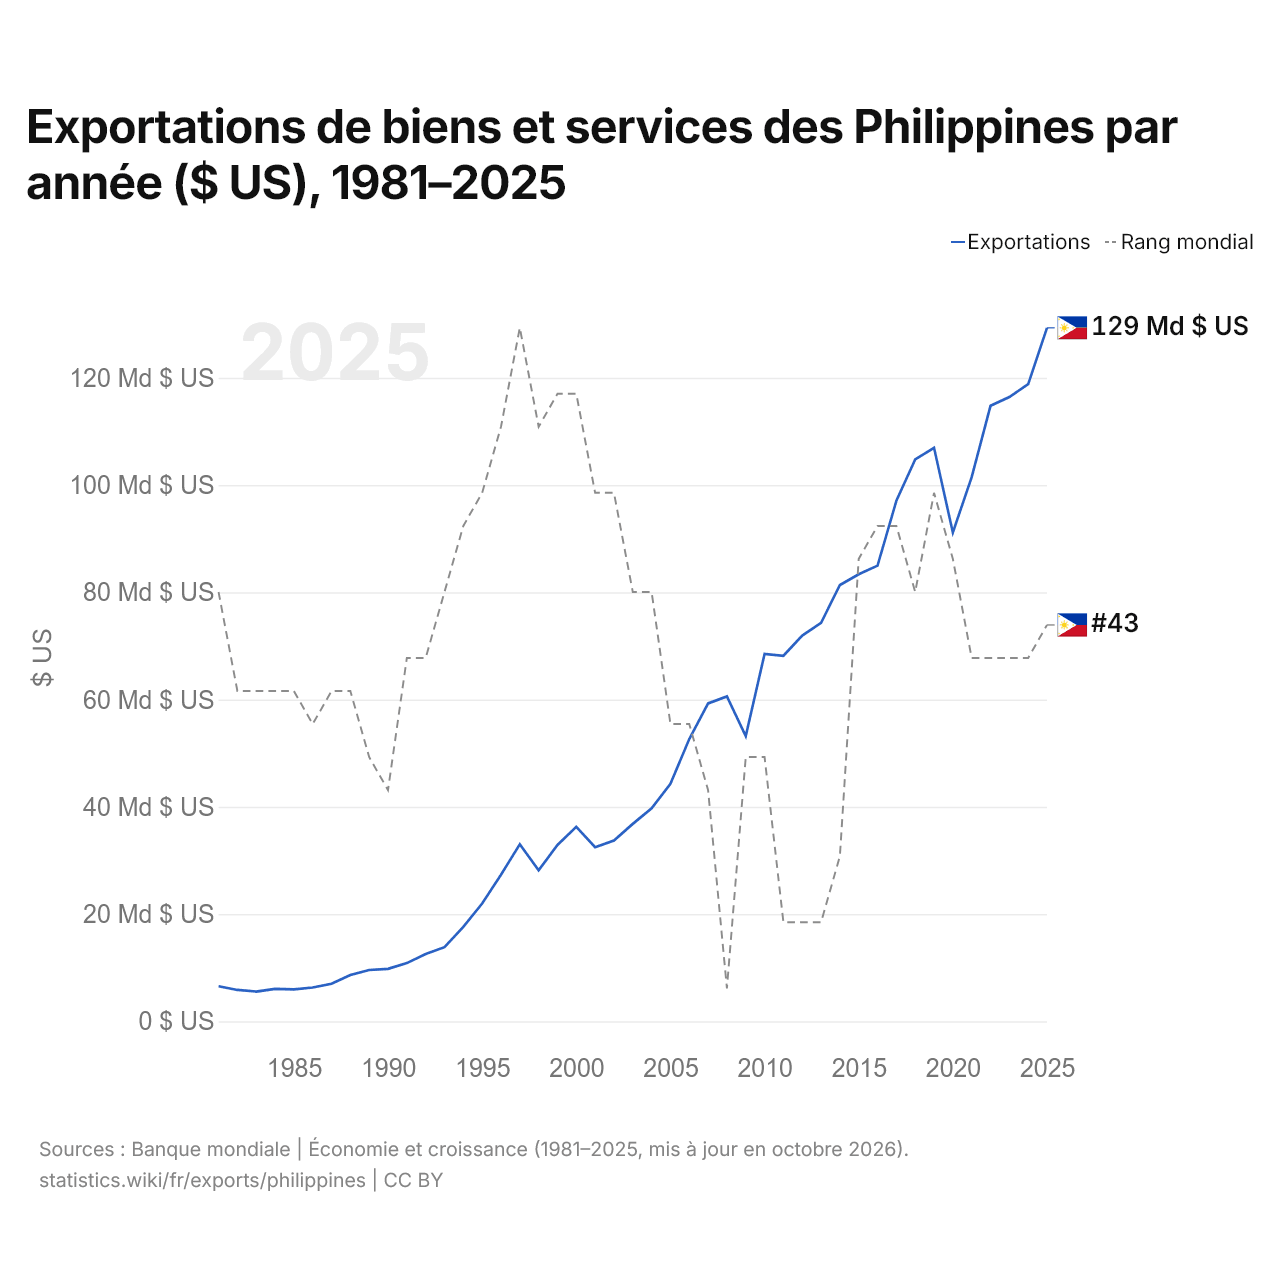
En 2025, les exportations de biens et services des Philippines s'élevaient à 129 milliards de dollars, contre 6,54 milliards de dollars en 1981. Le minimum a été de 5,55 milliards de dollars, en 1983. Elles se classaient au 43e rang mondial, en hausse par rapport au 44e rang en 2024. Leur meilleur rang a été le 34e, occupé pour la dernière fois en 1997.
En 2025, les exportations de biens et services des Philippines étaient les 15es plus élevées de 44 pays situés en Asie. Les importations de biens et services des Philippines s'élevaient à 196 milliards de dollars en 2025, au 34e rang mondial. En 2025, les importations des Philippines dépassaient leurs exportations de 66,7 milliards de dollars, soit un déficit commercial.
Exportations de biens des Philippines par catégorie, 2025
Exportations de biens, 2025: 83,8 Md $US
En 2025, la première catégorie des exportations de biens des Philippines était « machines, électronique et véhicules », avec 68,3 %, suivie de « aliments transformés, huiles, aliments pour animaux, boissons et tabac », avec 7,0 %.
Destinations des exportations de biens des Philippines : les 10 premières, 2025
| Rang | Pays | Exportations de biens | Part | |
|---|---|---|---|---|
| 1 |
 États-Unis |
13,5 Md $US | 16,1 % | |
| 2 |
 Japon |
11,6 Md $US | 13,8 % | vs Japon |
| 3 |
 Chine |
9,30 Md $US | 11,1 % | vs Chine |
| 4 |
 Pays-Bas |
3,60 Md $US | 4,29 % | |
| 5 |
 Singapour |
3,53 Md $US | 4,21 % | vs Singapour |
| 6 |
 Allemagne |
3,35 Md $US | 4,01 % | |
| 7 |
 Corée du Sud |
3,29 Md $US | 3,93 % | vs Corée du Sud |
| 8 |
 Thaïlande |
2,90 Md $US | 3,46 % | vs Thaïlande |
| 9 |
 Malaisie |
2,69 Md $US | 3,21 % | vs Malaisie |
| 10 |
 Vietnam |
1,53 Md $US | 1,82 % | vs Vietnam |
| Autres partenaires et non précisés | 28,5 Md $US | 34 % |
Exportations de biens des Philippines vers leurs 5 principales destinations ($ US), 2001–2025
| Année | $ US | ||||
|---|---|---|---|---|---|
| États-Unis | Japon | Chine | Pays-Bas | Singapour | |
| 2025 | 13 522 307 000 $ US | 11 569 237 000 $ US | 9 300 673 000 $ US | 3 596 269 000 $ US | 3 528 168 000 $ US |
| 2024 | 12 121 482 000 $ US | 10 254 403 000 $ US | 9 422 725 000 $ US | 2 866 804 000 $ US | 2 935 069 000 $ US |
| 2023 | 11 427 220 000 $ US | 10 425 160 000 $ US | 10 647 896 000 $ US | 3 085 164 000 $ US | 3 521 225 000 $ US |
| 2022 | 12 470 350 000 $ US | 11 094 094 000 $ US | 10 965 840 000 $ US | 2 941 095 000 $ US | 4 908 819 000 $ US |
| 2021 | 11 856 667 000 $ US | 10 722 304 000 $ US | 11 530 853 000 $ US | 2 253 693 000 $ US | 4 194 783 000 $ US |
| 2020 | 9 723 852 000 $ US | 9 924 293 000 $ US | 9 621 918 000 $ US | 1 900 066 000 $ US | 3 758 277 000 $ US |
| 2019 | 11 465 402 000 $ US | 10 632 444 000 $ US | 9 628 984 000 $ US | 2 257 284 000 $ US | 3 825 146 000 $ US |
| 2018 | 10 550 142 000 $ US | 9 473 708 000 $ US | 8 698 668 000 $ US | 2 480 700 000 $ US | 4 234 412 000 $ US |
| 2017 | 9 209 532 000 $ US | 10 229 733 000 $ US | 6 992 771 000 $ US | 2 467 039 000 $ US | 3 868 399 000 $ US |
| 2016 | 8 669 889 000 $ US | 11 674 108 000 $ US | 6 192 433 000 $ US | 1 715 640 000 $ US | 3 700 591 000 $ US |
| 2015 | 8 811 310 000 $ US | 12 381 197 000 $ US | 6 393 073 000 $ US | 1 771 991 000 $ US | 3 649 515 000 $ US |
| 2014 | 8 732 694 000 $ US | 13 918 860 000 $ US | 8 033 653 000 $ US | 1 892 315 000 $ US | 4 453 918 000 $ US |
| 2013 | 8 337 397 000 $ US | 12 048 496 000 $ US | 7 025 215 000 $ US | 1 748 521 000 $ US | 4 142 004 000 $ US |
| 2012 | 7 406 423 000 $ US | 9 881 269 000 $ US | 6 159 106 000 $ US | 1 550 982 000 $ US | 4 863 929 000 $ US |
| 2011 | 7 106 743 000 $ US | 8 866 494 000 $ US | 6 102 252 000 $ US | 1 744 779 000 $ US | 4 277 729 000 $ US |
| 2010 | 7 569 999 000 $ US | 7 841 291 000 $ US | 5 724 467 000 $ US | 2 429 527 000 $ US | 7 318 943 000 $ US |
| 2009 | 6 797 107 000 $ US | 6 208 401 000 $ US | 2 933 923 000 $ US | 3 743 524 000 $ US | 2 477 272 000 $ US |
| 2008 | 8 216 440 000 $ US | 7 707 063 000 $ US | 5 469 186 000 $ US | 3 708 374 000 $ US | 2 606 660 000 $ US |
| 2007 | 8 601 400 000 $ US | 7 304 148 000 $ US | 5 749 864 000 $ US | 4 149 522 000 $ US | 3 138 694 000 $ US |
| 2006 | 8 697 644 000 $ US | 7 918 337 000 $ US | 4 627 660 000 $ US | 4 769 195 000 $ US | 3 505 006 000 $ US |
| 2005 | 7 444 127 000 $ US | 7 206 100 000 $ US | 4 076 996 000 $ US | 4 032 644 000 $ US | 2 706 923 000 $ US |
| 2004 | 7 207 493 000 $ US | 7 983 390 000 $ US | 2 653 036 000 $ US | 3 582 950 000 $ US | 2 630 506 000 $ US |
| 2003 | 7 273 425 000 $ US | 5 768 938 000 $ US | 2 144 647 000 $ US | 2 921 714 000 $ US | 2 431 068 000 $ US |
| 2002 | 8 690 473 000 $ US | 5 295 454 000 $ US | 1 355 825 000 $ US | 3 054 905 000 $ US | 2 471 745 000 $ US |
| 2001 | 8 993 191 000 $ US | 5 057 443 000 $ US | 792 756 000 $ US | 2 976 352 000 $ US | 2 307 655 000 $ US |
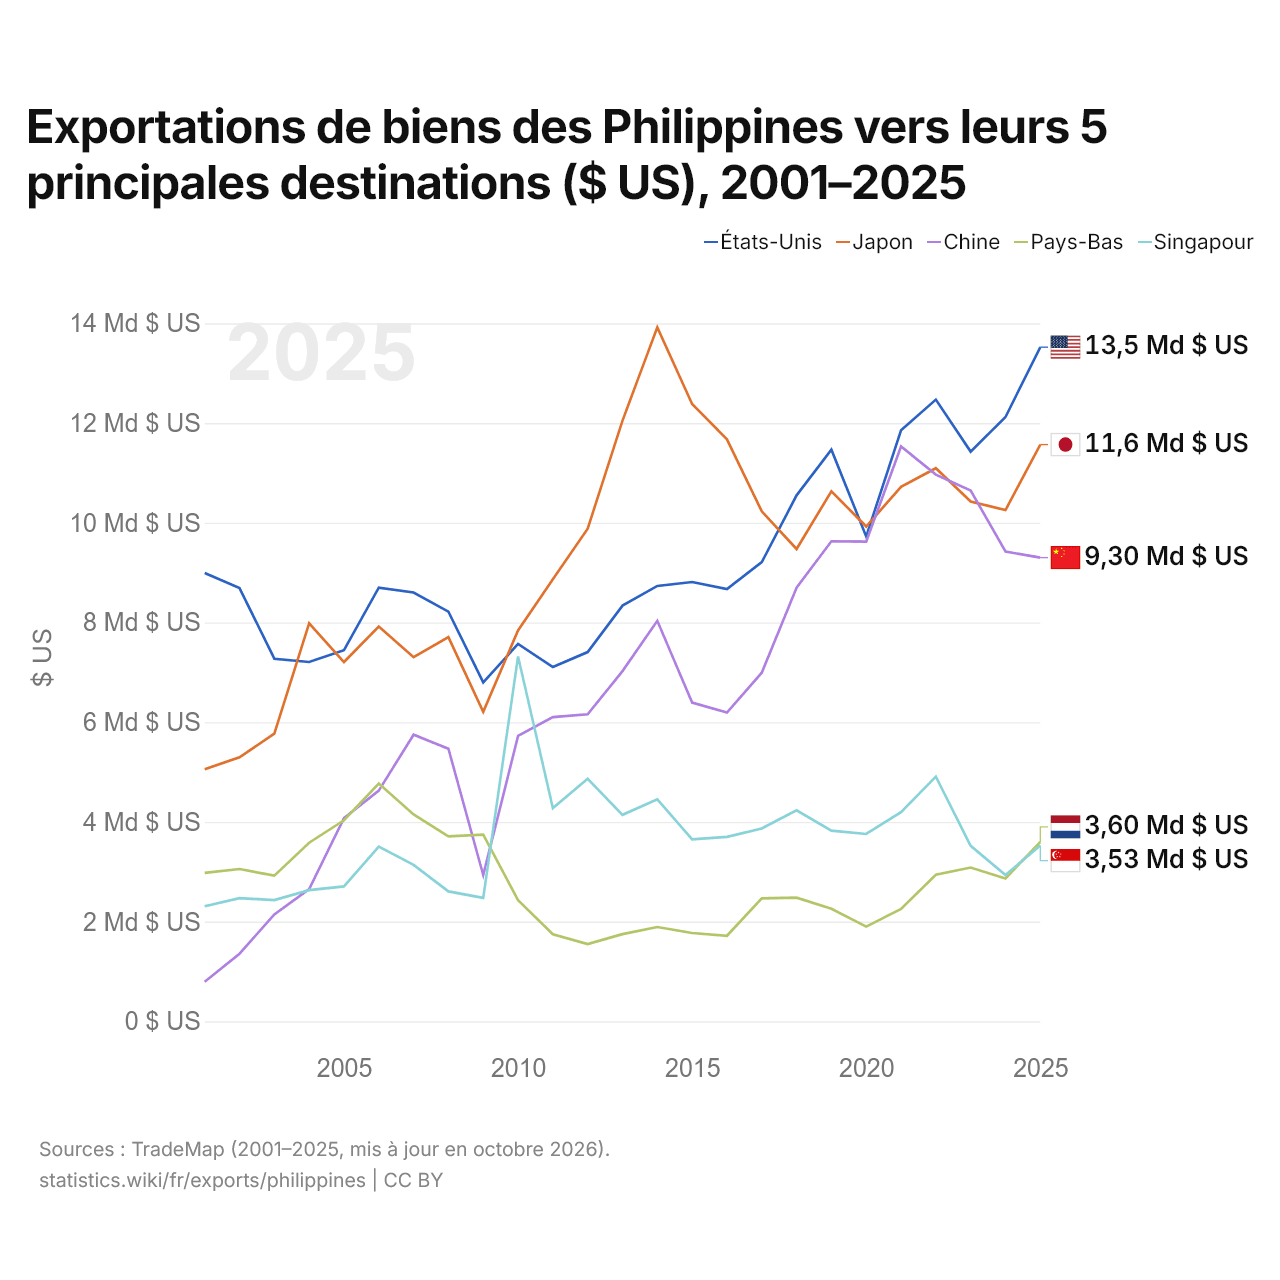
En 2025, les exportations de biens s'élevaient à 13,5 milliards de dollars vers les États-Unis, 11,6 milliards de dollars vers le Japon, 9,3 milliards de dollars vers la Chine, 3,6 milliards de dollars vers les Pays-Bas et 3,53 milliards de dollars vers Singapour. Le premier rang des cinq destinations des Philippines est occupé par les États-Unis depuis 2021. Le changement le plus récent dans leur ordre remonte à 2025, quand les exportations des Philippines vers les Pays-Bas ont dépassé celles vers Singapour.
Exportations de biens et de services des Philippines ($ US), 1977–2025
| Année | $ US | |
|---|---|---|
| Biens | Services | |
| 2025 | 63 434 569 798 $ US | 51 499 108 078 $ US |
| 2024 | 55 056 451 606 $ US | 50 671 354 162 $ US |
| 2023 | 55 256 611 694 $ US | 48 331 841 174 $ US |
| 2022 | 57 710 230 304 $ US | 41 121 888 276 $ US |
| 2021 | 54 227 920 605 $ US | 33 570 007 667 $ US |
| 2020 | 48 211 513 849 $ US | 31 822 200 320 $ US |
| 2019 | 53 476 930 081 $ US | 41 264 018 636 $ US |
| 2018 | 51 976 749 434 $ US | 38 397 082 673 $ US |
| 2017 | 51 814 261 869 $ US | 34 831 647 257 $ US |
| 2016 | 42 734 423 311 $ US | 31 203 605 094 $ US |
| 2015 | 43 197 106 829 $ US | 29 065 047 720 $ US |
| 2014 | 49 823 702 338 $ US | 25 498 091 521 $ US |
| 2013 | 44 512 401 095 $ US | 23 335 156 028 $ US |
| 2012 | 46 384 288 291 $ US | 20 439 202 041 $ US |
| 2011 | 38 276 471 890 $ US | 18 878 201 247 $ US |
| 2010 | 36 771 714 506 $ US | 17 782 239 991 $ US |
| 2009 | 29 142 866 160 $ US | 14 084 130 106 $ US |
| 2008 | 34 678 750 643 $ US | 13 054 789 171 $ US |
| 2007 | 32 802 573 146 $ US | 13 501 714 680 $ US |
| 2006 | 30 734 443 122 $ US | 11 064 226 222 $ US |
| 2005 | 25 161 775 241 $ US | 8 610 874 062 $ US |
| 2004 | 25 819 000 000 $ US | 6 743 000 000 $ US |
| 2003 | 23 542 000 000 $ US | 5 666 000 000 $ US |
| 2002 | 21 469 000 000 $ US | 5 575 000 000 $ US |
| 2001 | 19 498 000 000 $ US | 4 923 000 000 $ US |
| 2000 | 21 842 000 000 $ US | 5 619 000 000 $ US |
| 1999 | 18 403 000 000 $ US | 5 176 000 000 $ US |
| 1998 | 29 496 000 000 $ US | 7 477 000 000 $ US |
| 1997 | 25 228 000 000 $ US | 15 137 000 000 $ US |
| 1996 | 20 543 000 000 $ US | 12 947 000 000 $ US |
| 1995 | 17 447 000 000 $ US | 9 348 000 000 $ US |
| 1994 | 13 483 000 000 $ US | 6 768 000 000 $ US |
| 1993 | 11 375 000 000 $ US | 4 673 000 000 $ US |
| 1992 | 9 824 000 000 $ US | 4 742 000 000 $ US |
| 1991 | 8 840 000 000 $ US | 3 654 000 000 $ US |
| 1990 | 8 186 000 000 $ US | 3 244 000 000 $ US |
| 1989 | 7 821 000 000 $ US | 3 225 000 000 $ US |
| 1988 | 7 074 000 000 $ US | 2 413 000 000 $ US |
| 1987 | 5 720 000 000 $ US | 2 345 000 000 $ US |
| 1986 | 4 842 000 000 $ US | 2 860 000 000 $ US |
| 1985 | 4 629 000 000 $ US | 2 235 000 000 $ US |
| 1984 | 5 391 000 000 $ US | 1 642 000 000 $ US |
| 1983 | 5 005 000 000 $ US | 1 808 000 000 $ US |
| 1982 | 5 021 000 000 $ US | 1 804 000 000 $ US |
| 1981 | 5 722 000 000 $ US | 1 791 000 000 $ US |
| 1980 | 5 788 000 000 $ US | 1 447 000 000 $ US |
| 1979 | 4 601 000 000 $ US | 1 076 000 000 $ US |
| 1978 | 3 425 000 000 $ US | 1 013 000 000 $ US |
| 1977 | 3 151 000 000 $ US | 733 000 000 $ US |
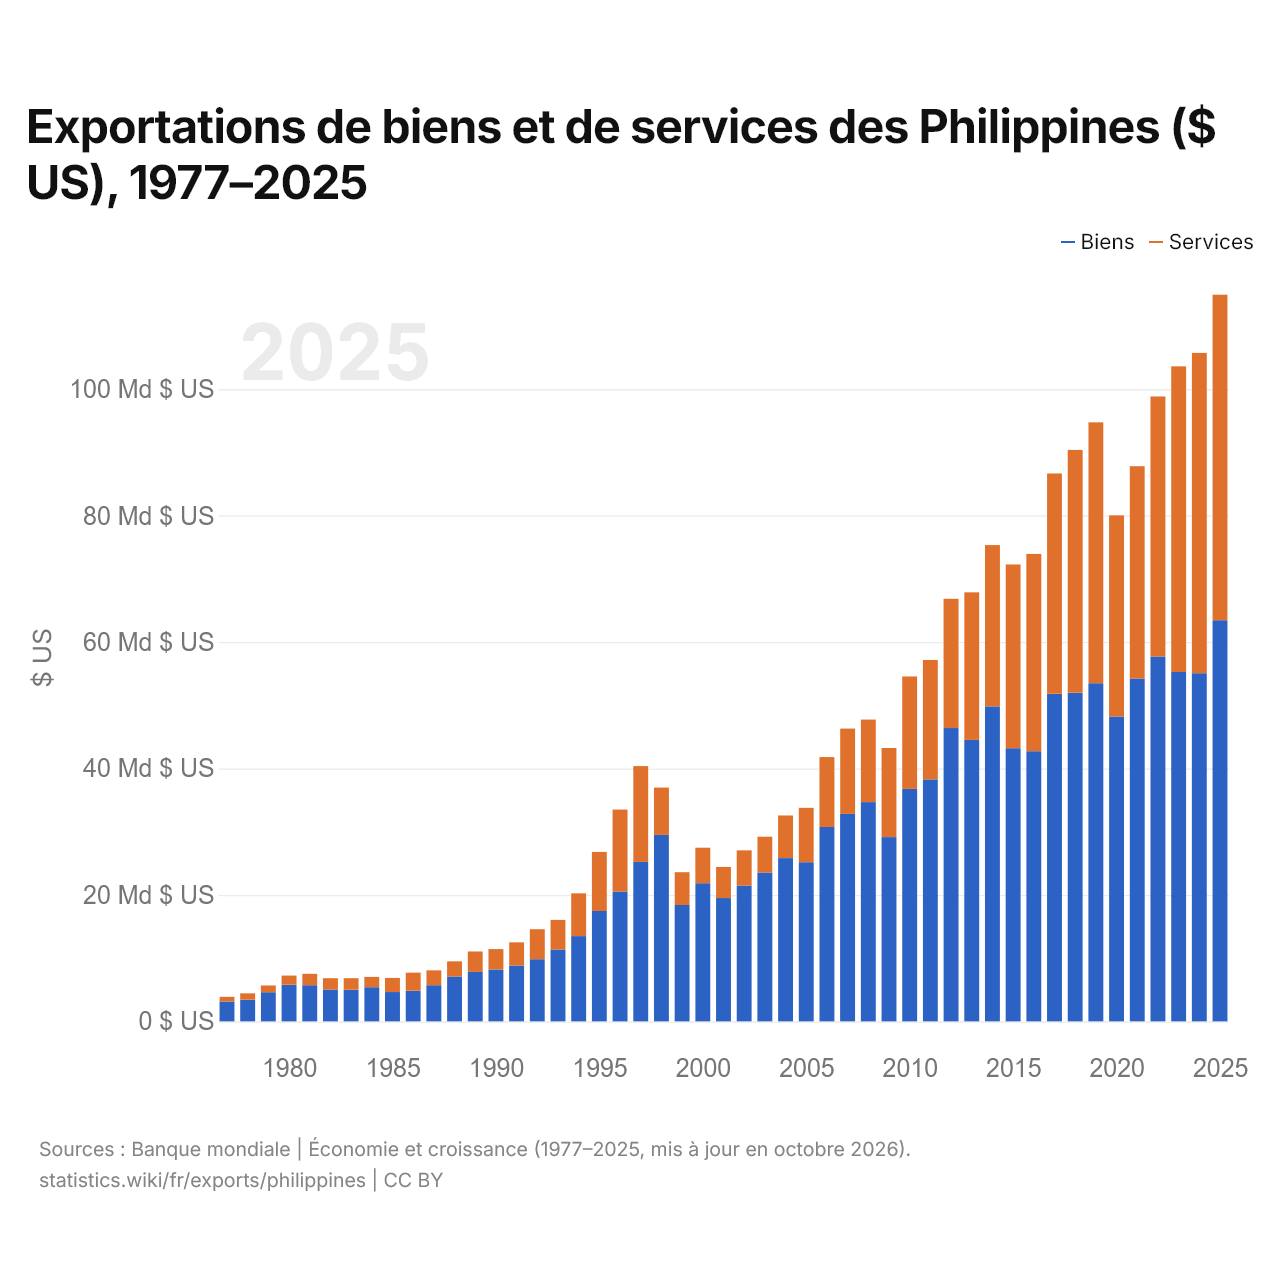
En 2025, les exportations de biens des Philippines s'élevaient à 63,4 milliards de dollars et celles de services à 51,5 milliards de dollars ; les services représentaient 44,8 % du total, contre 18,9 % en 1977.
Les Philippines dans le classement mondial des exportations, 2025







Exportations de biens et services des Philippines, % du PIB, 1981–2025
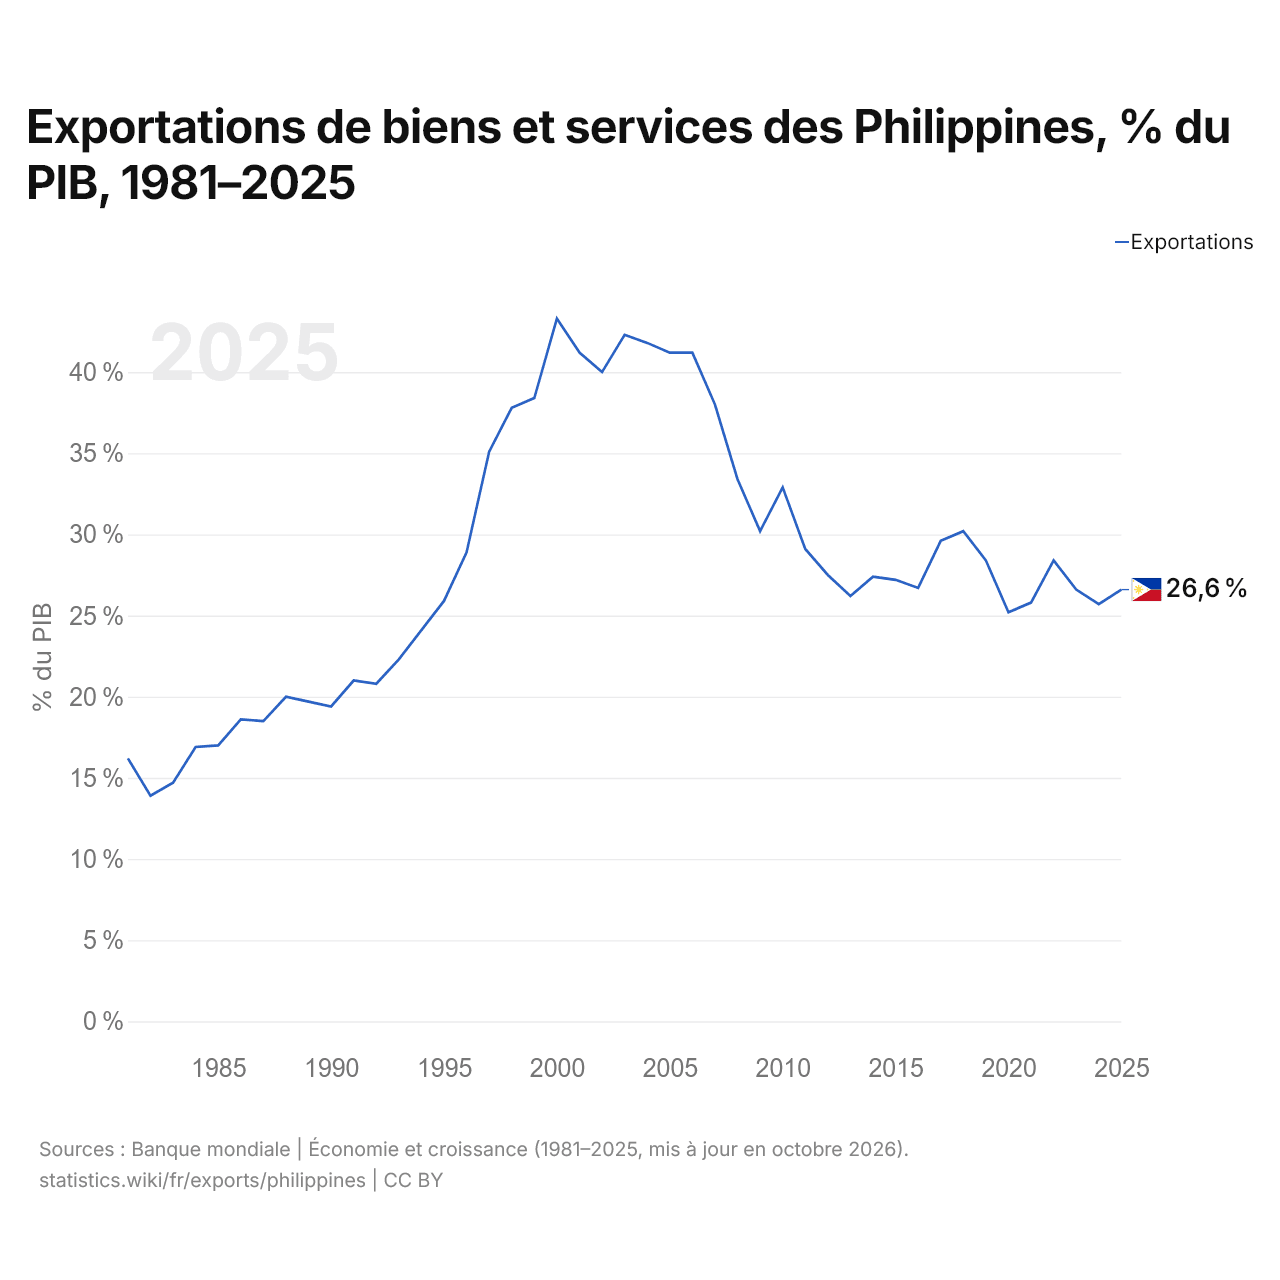
En 2025, les exportations de biens et services des Philippines équivalaient à 26,6 % de leur PIB, contre 16,2 % en 1981. La part la plus élevée a été de 43,3 %, en 2000.
Comparer les exportations des Philippines avec celles d'autres pays
Sources :
- TradeMap (2001–2025, mis à jour en octobre 2026)
- Banque mondiale | Économie et croissance (1977–2025, mis à jour en octobre 2026)
Creative Commons Attribution (CC BY) : vous pouvez copier, partager, adapter et réutiliser ce contenu, y compris à des fins commerciales, à condition de citer statistics.wiki et d’indiquer les modifications apportées. Les sources citées ci-dessus peuvent avoir leurs propres conditions de licence.