
Exportations de biens et services de la Suisse par année ($ US), 1970–2025
| Année | $ US | Rang mondial |
|---|---|---|
| Exportations | Rang mondial | |
| 2025 | 814 503 715 316 $ US | #13 |
| 2024 | 690 605 094 607 $ US | #14 |
| 2023 | 652 863 970 662 $ US | #14 |
| 2022 | 643 557 905 706 $ US | #14 |
| 2021 | 588 010 521 468 $ US | #14 |
| 2020 | 480 636 933 810 $ US | #14 |
| 2019 | 487 107 111 771 $ US | #15 |
| 2018 | 494 420 271 334 $ US | #16 |
| 2017 | 463 868 583 905 $ US | #13 |
| 2016 | 462 738 867 466 $ US | #12 |
| 2015 | 446 703 273 942 $ US | #12 |
| 2014 | 479 770 769 573 $ US | #13 |
| 2013 | 514 183 960 297 $ US | #13 |
| 2012 | 470 575 706 517 $ US | #13 |
| 2011 | 481 440 666 559 $ US | #13 |
| 2010 | 392 634 157 918 $ US | #13 |
| 2009 | 324 724 149 435 $ US | #15 |
| 2008 | 360 773 405 041 $ US | #15 |
| 2007 | 304 808 429 690 $ US | #16 |
| 2006 | 251 898 409 635 $ US | #17 |
| 2005 | 226 565 868 937 $ US | #17 |
| 2004 | 207 969 226 377 $ US | #15 |
| 2003 | 172 886 129 056 $ US | #16 |
| 2002 | 150 061 817 015 $ US | #16 |
| 2001 | 143 436 436 952 $ US | #16 |
| 2000 | 143 573 715 656 $ US | #16 |
| 1999 | 139 387 859 806 $ US | #16 |
| 1998 | 139 258 235 619 $ US | #14 |
| 1997 | 137 066 002 205 $ US | #15 |
| 1996 | 139 233 532 362 $ US | #14 |
| 1995 | 140 392 942 918 $ US | #12 |
| 1994 | 120 051 280 983 $ US | #11 |
| 1993 | 110 473 243 774 $ US | #11 |
| 1992 | 113 363 416 299 $ US | #11 |
| 1991 | 106 452 728 731 $ US | #10 |
| 1990 | 109 283 796 430 $ US | #10 |
| 1989 | 92 726 782 199 $ US | #11 |
| 1988 | 90 816 316 545 $ US | #10 |
| 1987 | 81 618 607 162 $ US | #10 |
| 1986 | 69 522 234 699 $ US | #9 |
| 1985 | 52 709 137 194 $ US | #10 |
| 1984 | 51 471 115 036 $ US | #10 |
| 1983 | 49 124 446 668 $ US | #11 |
| 1982 | 50 767 115 697 $ US | #11 |
| 1981 | 53 841 540 576 $ US | #11 |
| 1980 | 56 444 626 126 $ US | #11 |
| 1979 | 50 918 283 515 $ US | #11 |
| 1978 | 44 991 603 468 $ US | #10 |
| 1977 | 33 608 278 760 $ US | #11 |
| 1976 | 28 842 385 582 $ US | #11 |
| 1975 | 25 780 629 528 $ US | #11 |
| 1974 | 23 287 832 377 $ US | #11 |
| 1973 | 19 210 253 413 $ US | #10 |
| 1972 | 14 155 280 549 $ US | #10 |
| 1971 | 11 721 599 216 $ US | #10 |
| 1970 | 10 268 487 766 $ US | #10 |
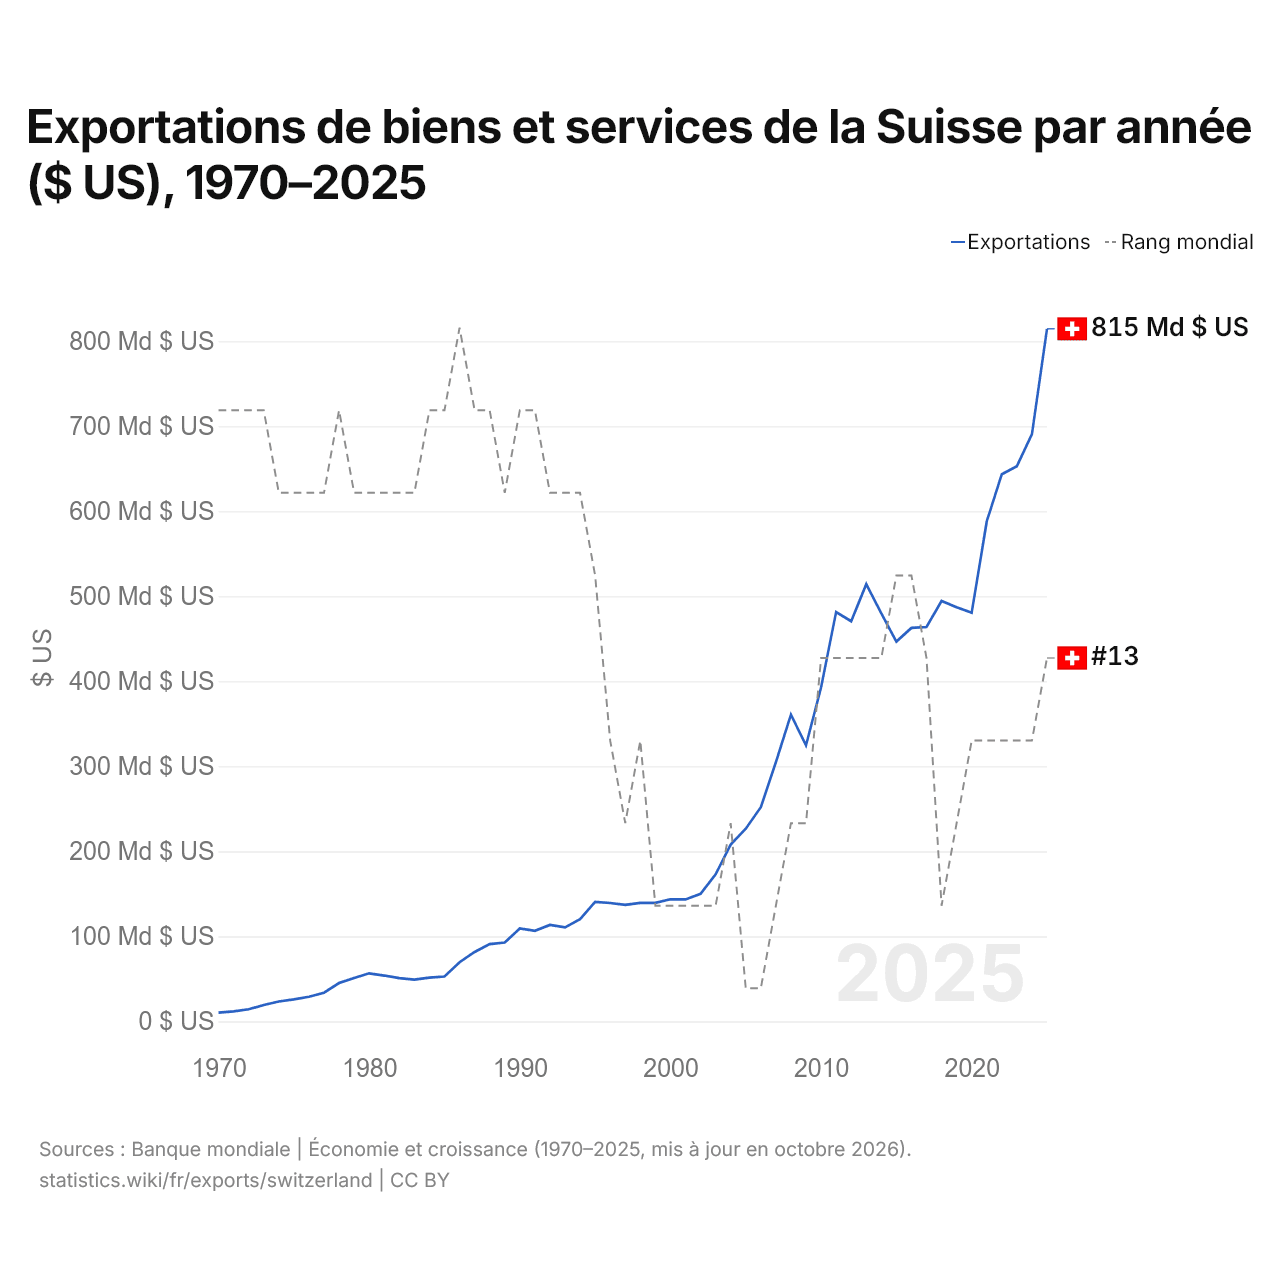
En 2025, les exportations de biens et services de la Suisse s'élevaient à 815 milliards de dollars, contre 10,3 milliards de dollars en 1970. Elles se classaient au 13e rang mondial, en hausse par rapport au 14e rang en 2024. Leur meilleur rang a été le 9e, occupé pour la dernière fois en 1986.
En 2025, les exportations de biens et services de la Suisse étaient les 7es plus élevées de 41 pays situés en Europe. Les importations de biens et services de la Suisse s'élevaient à 721 milliards de dollars en 2025, au 14e rang mondial. En 2025, les exportations de la Suisse dépassaient ses importations de 93,3 milliards de dollars, soit un excédent commercial.
Exportations de biens de la Suisse par catégorie, 2025
Exportations de biens, 2025: 556 Md $US
En 2025, la première catégorie des exportations de biens de la Suisse était « métaux précieux, pierres précieuses, bijoux, montres, instruments de musique et art », avec 46,1 %, suivie de « produits chimiques, pharmaceutiques et plastiques », avec 33,6 %.
Destinations des exportations de biens de la Suisse : les 10 premières, 2025
| Rang | Pays | Exportations de biens | Part | |
|---|---|---|---|---|
| 1 |
 États-Unis |
125 Md $US | 22,5 % | vs USA |
| 2 |
 Allemagne |
60,8 Md $US | 10,9 % | vs Allemagne |
| 3 |
 Royaume-Uni |
57,5 Md $US | 10,3 % | vs R.-U. |
| 4 |
 Chine |
35,7 Md $US | 6,42 % | vs Chine |
| 5 |
 France |
32,1 Md $US | 5,77 % | vs France |
| 6 |
 Slovénie |
31,8 Md $US | 5,73 % | vs Slovénie |
| 7 |
 Italie |
29,4 Md $US | 5,29 % | vs Italie |
| 8 |
 Inde |
15,9 Md $US | 2,86 % | vs Inde |
| 9 |
 Turquie |
13,1 Md $US | 2,35 % | vs Turquie |
| 10 |
 Autriche |
11,6 Md $US | 2,1 % | vs Autriche |
| Autres partenaires et non précisés | 143 Md $US | 25,7 % |
Exportations de biens de la Suisse vers ses 5 principales destinations ($ US), 2001–2025
| Année | $ US | ||||
|---|---|---|---|---|---|
| États-Unis | Allemagne | Royaume-Uni | Chine | France | |
| 2025 | 125 280 539 000 $ US | 60 817 940 000 $ US | 57 484 464 000 $ US | 35 662 695 000 $ US | 32 066 259 000 $ US |
| 2024 | 73 689 193 000 $ US | 51 387 673 000 $ US | 22 497 811 000 $ US | 42 400 965 000 $ US | 21 131 558 000 $ US |
| 2023 | 63 095 615 000 $ US | 51 263 940 000 $ US | 14 735 766 000 $ US | 45 199 962 000 $ US | 20 147 865 000 $ US |
| 2022 | 65 426 610 000 $ US | 53 686 579 000 $ US | 13 319 897 000 $ US | 44 135 322 000 $ US | 21 283 454 000 $ US |
| 2021 | 63 113 986 000 $ US | 55 391 444 000 $ US | 14 046 987 000 $ US | 33 074 468 000 $ US | 19 292 949 000 $ US |
| 2020 | 73 330 907 000 $ US | 49 104 518 000 $ US | 16 814 188 000 $ US | 17 435 985 000 $ US | 16 490 605 000 $ US |
| 2019 | 43 932 802 000 $ US | 48 035 751 000 $ US | 28 340 579 000 $ US | 21 559 003 000 $ US | 19 424 770 000 $ US |
| 2018 | 40 992 996 000 $ US | 47 506 078 000 $ US | 10 649 165 000 $ US | 30 264 276 000 $ US | 19 767 738 000 $ US |
| 2017 | 36 856 429 000 $ US | 45 872 345 000 $ US | 16 996 024 000 $ US | 24 338 992 000 $ US | 17 572 802 000 $ US |
| 2016 | 36 933 139 000 $ US | 43 376 179 000 $ US | 32 456 694 000 $ US | 27 171 635 000 $ US | 17 630 690 000 $ US |
| 2015 | 30 723 779 000 $ US | 41 276 797 000 $ US | 13 609 238 000 $ US | 20 167 170 000 $ US | 17 542 523 000 $ US |
| 2014 | 31 498 715 000 $ US | 47 356 476 000 $ US | 13 800 719 000 $ US | 18 415 817 000 $ US | 19 048 518 000 $ US |
| 2013 | 27 262 094 000 $ US | 45 187 863 000 $ US | 13 270 047 000 $ US | 20 986 940 000 $ US | 20 793 973 000 $ US |
| 2012 | 25 493 124 000 $ US | 46 777 567 000 $ US | 30 157 450 000 $ US | 9 927 322 000 $ US | 23 400 087 000 $ US |
| 2011 | 24 091 992 000 $ US | 47 320 037 000 $ US | 11 225 868 000 $ US | 9 971 193 000 $ US | 16 823 255 000 $ US |
| 2010 | 19 798 455 000 $ US | 37 757 588 000 $ US | 11 567 681 000 $ US | 7 178 058 000 $ US | 15 040 329 000 $ US |
| 2009 | 17 704 099 000 $ US | 35 048 333 000 $ US | 17 571 702 000 $ US | 5 135 187 000 $ US | 15 220 162 000 $ US |
| 2008 | 19 656 006 000 $ US | 40 853 879 000 $ US | 15 140 717 000 $ US | 5 815 215 000 $ US | 17 568 147 000 $ US |
| 2007 | 16 885 788 000 $ US | 35 353 277 000 $ US | 10 234 787 000 $ US | 4 579 191 000 $ US | 15 514 269 000 $ US |
| 2006 | 16 428 002 000 $ US | 29 287 166 000 $ US | 7 988 680 000 $ US | 3 284 225 000 $ US | 13 535 913 000 $ US |
| 2005 | 14 296 361 000 $ US | 25 667 354 000 $ US | 8 246 321 000 $ US | 2 808 222 000 $ US | 11 847 087 000 $ US |
| 2004 | 12 956 698 000 $ US | 25 030 306 000 $ US | 6 476 160 000 $ US | 2 557 884 000 $ US | 11 126 530 000 $ US |
| 2003 | 11 797 869 000 $ US | 21 834 884 000 $ US | 5 108 813 000 $ US | 1 847 321 000 $ US | 9 492 782 000 $ US |
| 2002 | 11 068 710 000 $ US | 18 802 418 000 $ US | 4 748 155 000 $ US | 1 333 042 000 $ US | 8 566 003 000 $ US |
| 2001 | 9 593 067 000 $ US | 17 959 243 000 $ US | 4 581 161 000 $ US | 1 006 785 000 $ US | 7 552 725 000 $ US |
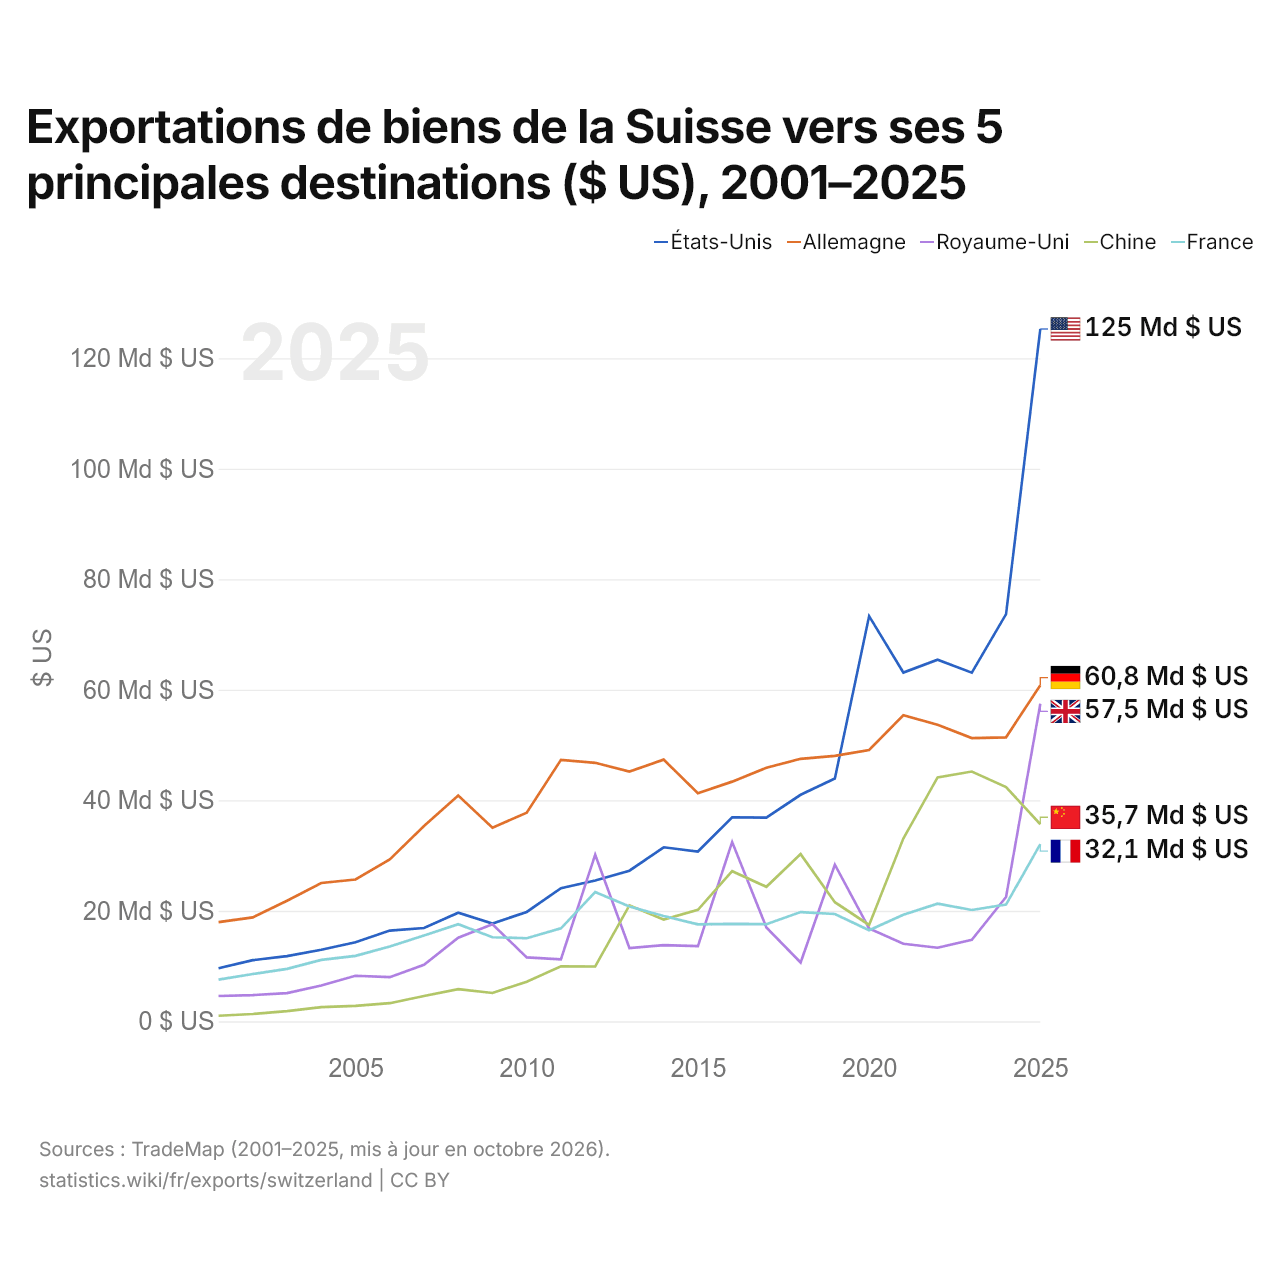
En 2025, les exportations de biens s'élevaient à 125 milliards de dollars vers les États-Unis, 60,8 milliards de dollars vers l'Allemagne, 57,5 milliards de dollars vers le Royaume-Uni, 35,7 milliards de dollars vers la Chine et 32,1 milliards de dollars vers la France. Le premier rang des cinq destinations de la Suisse est occupé par les États-Unis depuis 2020. Le changement le plus récent dans leur ordre remonte à 2025, quand les exportations de la Suisse vers le Royaume-Uni ont dépassé celles vers la Chine.
Exportations de biens et de services de la Suisse ($ US), 1977–2025
| Année | $ US | |
|---|---|---|
| Biens | Services | |
| 2025 | 621 106 126 482 $ US | 196 308 856 153 $ US |
| 2024 | 502 057 880 942 $ US | 186 135 173 570 $ US |
| 2023 | 481 386 302 755 $ US | 170 409 186 646 $ US |
| 2022 | 488 018 936 246 $ US | 154 596 901 087 $ US |
| 2021 | 448 584 387 352 $ US | 138 632 999 367 $ US |
| 2020 | 361 970 407 191 $ US | 118 455 334 847 $ US |
| 2019 | 351 614 767 517 $ US | 134 731 280 864 $ US |
| 2018 | 355 087 057 505 $ US | 138 838 812 741 $ US |
| 2017 | 336 451 415 492 $ US | 126 423 536 536 $ US |
| 2016 | 333 993 565 435 $ US | 126 907 306 126 $ US |
| 2015 | 318 703 775 376 $ US | 125 927 306 449 $ US |
| 2014 | 345 201 062 358 $ US | 133 180 015 242 $ US |
| 2013 | 386 067 023 886 $ US | 125 494 965 204 $ US |
| 2012 | 345 546 204 335 $ US | 122 720 929 815 $ US |
| 2011 | 362 031 169 778 $ US | 115 339 563 180 $ US |
| 2010 | 291 306 844 044 $ US | 101 238 253 369 $ US |
| 2009 | 226 691 853 462 $ US | 97 378 221 242 $ US |
| 2008 | 261 067 928 806 $ US | 101 396 938 741 $ US |
| 2007 | 212 472 350 773 $ US | 89 162 048 001 $ US |
| 2006 | 176 384 201 014 $ US | 74 370 385 763 $ US |
| 2005 | 156 251 277 085 $ US | 69 383 750 938 $ US |
| 2004 | 145 079 364 525 $ US | 63 281 670 929 $ US |
| 2003 | 118 221 264 632 $ US | 54 481 358 297 $ US |
| 2002 | 102 543 583 211 $ US | 47 419 719 833 $ US |
| 2001 | 96 945 555 874 $ US | 45 261 640 630 $ US |
| 2000 | 95 383 891 257 $ US | 47 141 376 477 $ US |
| 1999 | 92 694 323 021 $ US | 28 860 297 855 $ US |
| 1998 | 94 503 684 862 $ US | 26 127 639 871 $ US |
| 1997 | 96 016 330 046 $ US | 24 446 699 109 $ US |
| 1996 | 96 394 123 025 $ US | 25 555 942 104 $ US |
| 1995 | 98 016 170 964 $ US | 25 303 408 193 $ US |
| 1994 | 83 272 884 804 $ US | 22 103 652 685 $ US |
| 1993 | 75 920 908 670 $ US | 21 105 473 905 $ US |
| 1992 | 80 427 837 782 $ US | 20 683 203 533 $ US |
| 1991 | 74 952 109 206 $ US | 19 221 311 142 $ US |
| 1990 | 78 756 537 232 $ US | 18 276 390 380 $ US |
| 1989 | 66 397 237 037 $ US | 15 303 207 665 $ US |
| 1988 | 63 164 081 186 $ US | 16 113 578 897 $ US |
| 1987 | 55 603 851 506 $ US | 15 218 030 323 $ US |
| 1986 | 48 799 925 886 $ US | 12 029 462 177 $ US |
| 1985 | 37 303 352 495 $ US | 8 817 215 241 $ US |
| 1984 | 36 896 461 233 $ US | 8 151 736 761 $ US |
| 1983 | 34 166 822 168 $ US | 8 230 030 532 $ US |
| 1982 | 36 072 914 086 $ US | 6 979 318 377 $ US |
| 1981 | 40 103 605 170 $ US | 6 816 458 718 $ US |
| 1980 | 41 707 595 441 $ US | 6 887 693 394 $ US |
| 1979 | 33 827 284 322 $ US | 5 956 770 542 $ US |
| 1978 | 28 836 529 349 $ US | 5 436 409 094 $ US |
| 1977 | 20 991 711 867 $ US | 4 289 160 402 $ US |
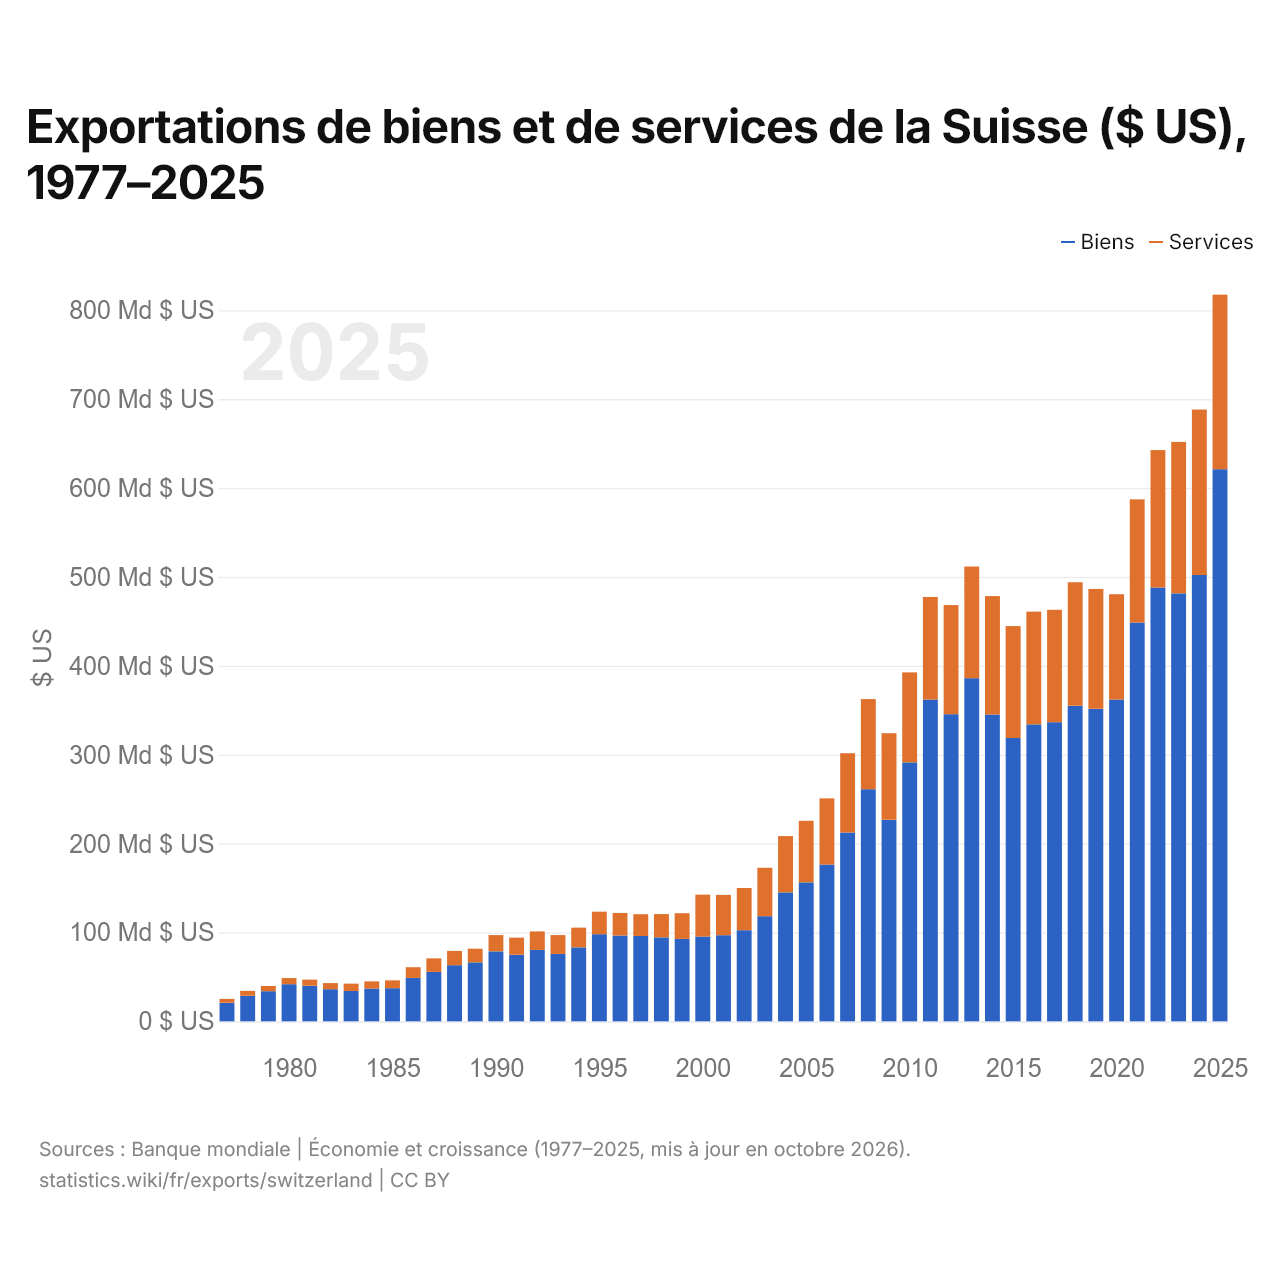
En 2025, les exportations de biens de la Suisse s'élevaient à 621 milliards de dollars et celles de services à 196 milliards de dollars ; les services représentaient 24,0 % du total, contre 17,0 % en 1977.
La Suisse dans le classement mondial des exportations, 2025
| Rang | Pays | Exportations | Part mondiale | |
|---|---|---|---|---|
| 10 |
Inde
|
881 Md $US | 2,52 % | vs Inde |
| 11 |
 Corée du Sud |
857 Md $US | 2,46 % | vs Corée du Sud |
| 12 |
Italie
|
822 Md $US | 2,36 % | vs Italie |
| 13 |
 Suisse |
815 Md $US | 2,33 % | |
| 14 |
 Canada |
727 Md $US | 2,08 % | vs Canada |
| 15 |
 Mexique |
727 Md $US | 2,08 % | vs Mexique |
| 16 |
 Espagne |
698 Md $US | 2 % | vs Espagne |
Exportations de biens et services de la Suisse, % du PIB, 1970–2025
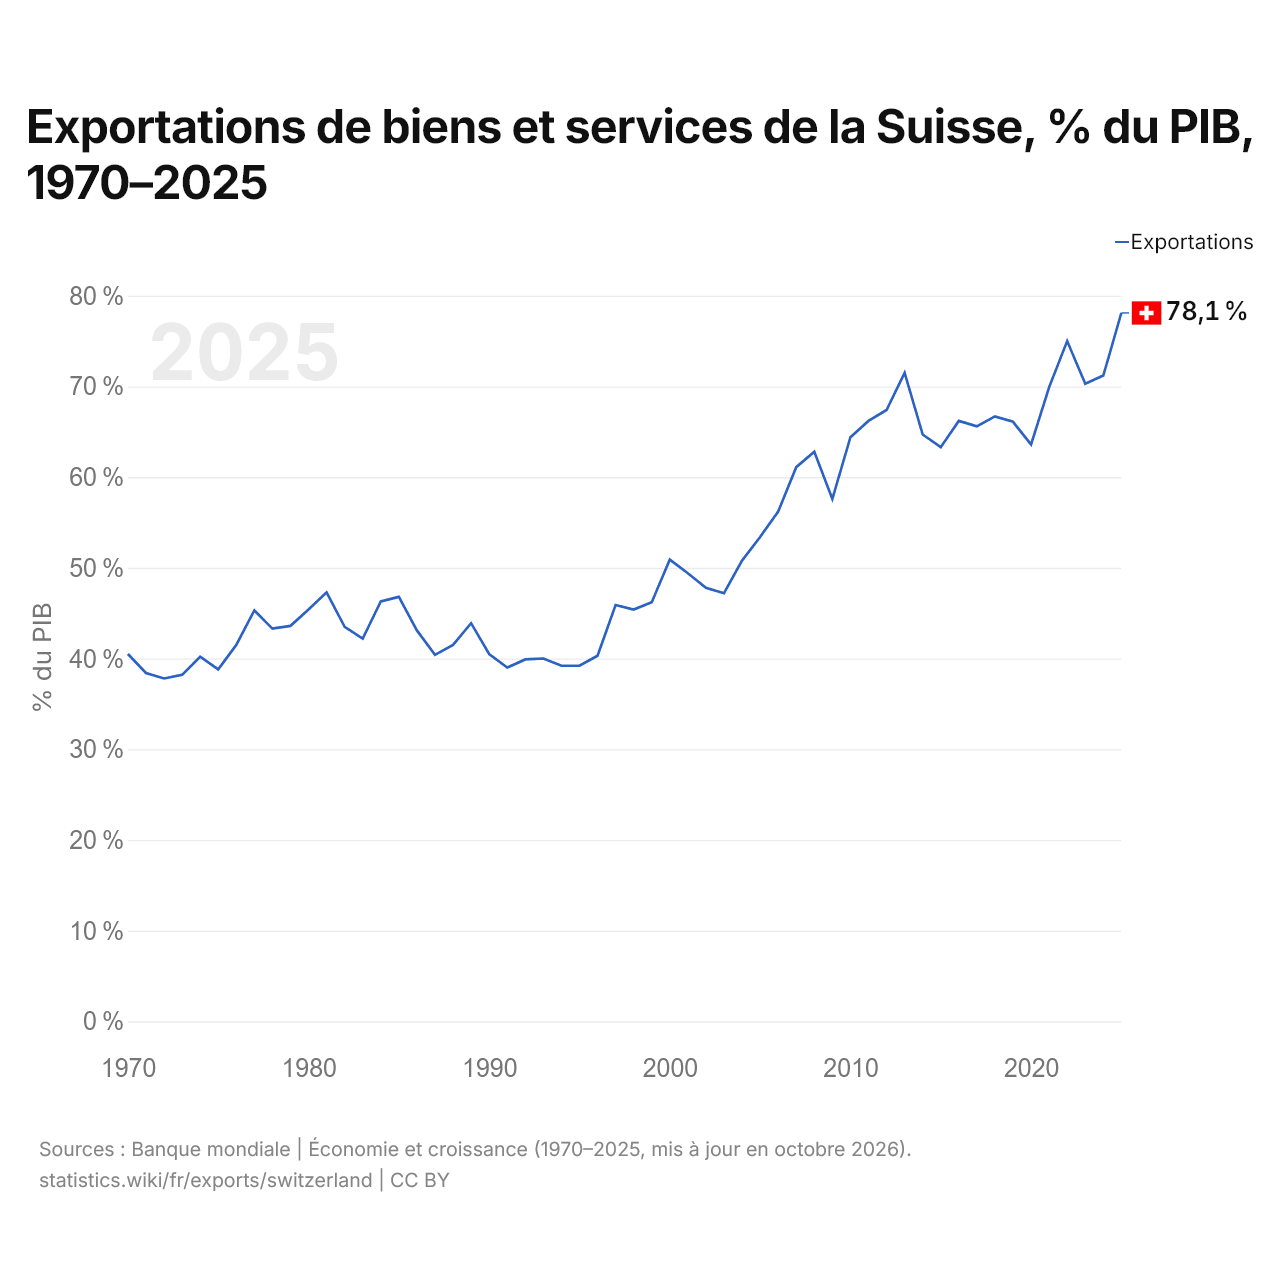
En 2025, les exportations de biens et services de la Suisse équivalaient à 78,1 % de son PIB, contre 40,5 % en 1970. La part la plus faible a été de 37,8 %, en 1972.
Comparer les exportations de la Suisse avec celles d'autres pays
Sources :
- TradeMap (2001–2025, mis à jour en octobre 2026)
- Banque mondiale | Économie et croissance (1970–2025, mis à jour en octobre 2026)
Creative Commons Attribution (CC BY) : vous pouvez copier, partager, adapter et réutiliser ce contenu, y compris à des fins commerciales, à condition de citer statistics.wiki et d’indiquer les modifications apportées. Les sources citées ci-dessus peuvent avoir leurs propres conditions de licence.