
Exportations de biens et services du Kenya par année ($ US), 1960–2025
| Année | $ US | Rang mondial |
|---|---|---|
| Exportations | Rang mondial | |
| 2025 | 21 429 875 347 $ US | #88 |
| 2024 | 20 292 950 694 $ US | #88 |
| 2023 | 17 966 992 983 $ US | #90 |
| 2022 | 18 262 655 905 $ US | #87 |
| 2021 | 14 381 862 480 $ US | #90 |
| 2020 | 11 516 270 712 $ US | #89 |
| 2019 | 11 471 243 360 $ US | #93 |
| 2018 | 11 564 075 006 $ US | #94 |
| 2017 | 10 448 711 418 $ US | #96 |
| 2016 | 9 912 815 674 $ US | #94 |
| 2015 | 10 608 335 823 $ US | #94 |
| 2014 | 11 248 585 738 $ US | #97 |
| 2013 | 10 972 694 027 $ US | #97 |
| 2012 | 11 203 175 900 $ US | #94 |
| 2011 | 10 100 126 370 $ US | #97 |
| 2010 | 9 137 589 276 $ US | #95 |
| 2009 | 7 950 667 080 $ US | #92 |
| 2008 | 8 138 887 724 $ US | #99 |
| 2007 | 7 004 914 020 $ US | #96 |
| 2006 | 5 935 978 411 $ US | #98 |
| 2005 | 5 341 992 293 $ US | #93 |
| 2004 | 4 283 010 819 $ US | #95 |
| 2003 | 3 590 023 638 $ US | #93 |
| 2002 | 3 273 519 932 $ US | #91 |
| 2001 | 2 977 896 210 $ US | #94 |
| 2000 | 2 742 776 491 $ US | #96 |
| 1999 | 2 686 591 710 $ US | #93 |
| 1998 | 2 842 655 388 $ US | #89 |
| 1997 | 2 975 493 106 $ US | #90 |
| 1996 | 3 035 630 590 $ US | #85 |
| 1995 | 2 948 349 669 $ US | #83 |
| 1994 | 2 647 694 303 $ US | #81 |
| 1993 | 2 237 653 804 $ US | #85 |
| 1992 | 2 155 745 830 $ US | #83 |
| 1991 | 2 204 295 626 $ US | #79 |
| 1990 | 2 202 462 430 $ US | #78 |
| 1989 | 1 907 852 204 $ US | #72 |
| 1988 | 1 869 200 100 $ US | #66 |
| 1987 | 1 698 200 923 $ US | #67 |
| 1986 | 1 871 195 154 $ US | #61 |
| 1985 | 1 552 098 193 $ US | #65 |
| 1984 | 1 656 202 770 $ US | #66 |
| 1983 | 1 551 597 921 $ US | #65 |
| 1982 | 1 714 496 080 $ US | #64 |
| 1981 | 2 087 870 039 $ US | #62 |
| 1980 | 2 144 500 671 $ US | #61 |
| 1979 | 1 605 552 359 $ US | #58 |
| 1978 | 1 534 663 245 $ US | #56 |
| 1977 | 1 571 183 974 $ US | #54 |
| 1976 | 1 127 505 380 $ US | #58 |
| 1975 | 972 056 842 $ US | #62 |
| 1974 | 1 000 159 880 $ US | #56 |
| 1973 | 687 311 675 $ US | #56 |
| 1972 | 560 279 776 $ US | #55 |
| 1971 | 509 319 796 $ US | #55 |
| 1970 | 478 239 809 $ US | #54 |
| 1969 | 430 639 828 $ US | - |
| 1968 | 397 879 841 $ US | - |
| 1967 | 350 839 860 $ US | - |
| 1966 | 377 439 849 $ US | - |
| 1965 | 313 319 875 $ US | - |
| 1964 | 333 479 881 $ US | - |
| 1963 | 296 813 881 $ US | - |
| 1962 | 278 123 875 $ US | - |
| 1961 | 259 433 896 $ US | - |
| 1960 | 246 049 902 $ US | - |
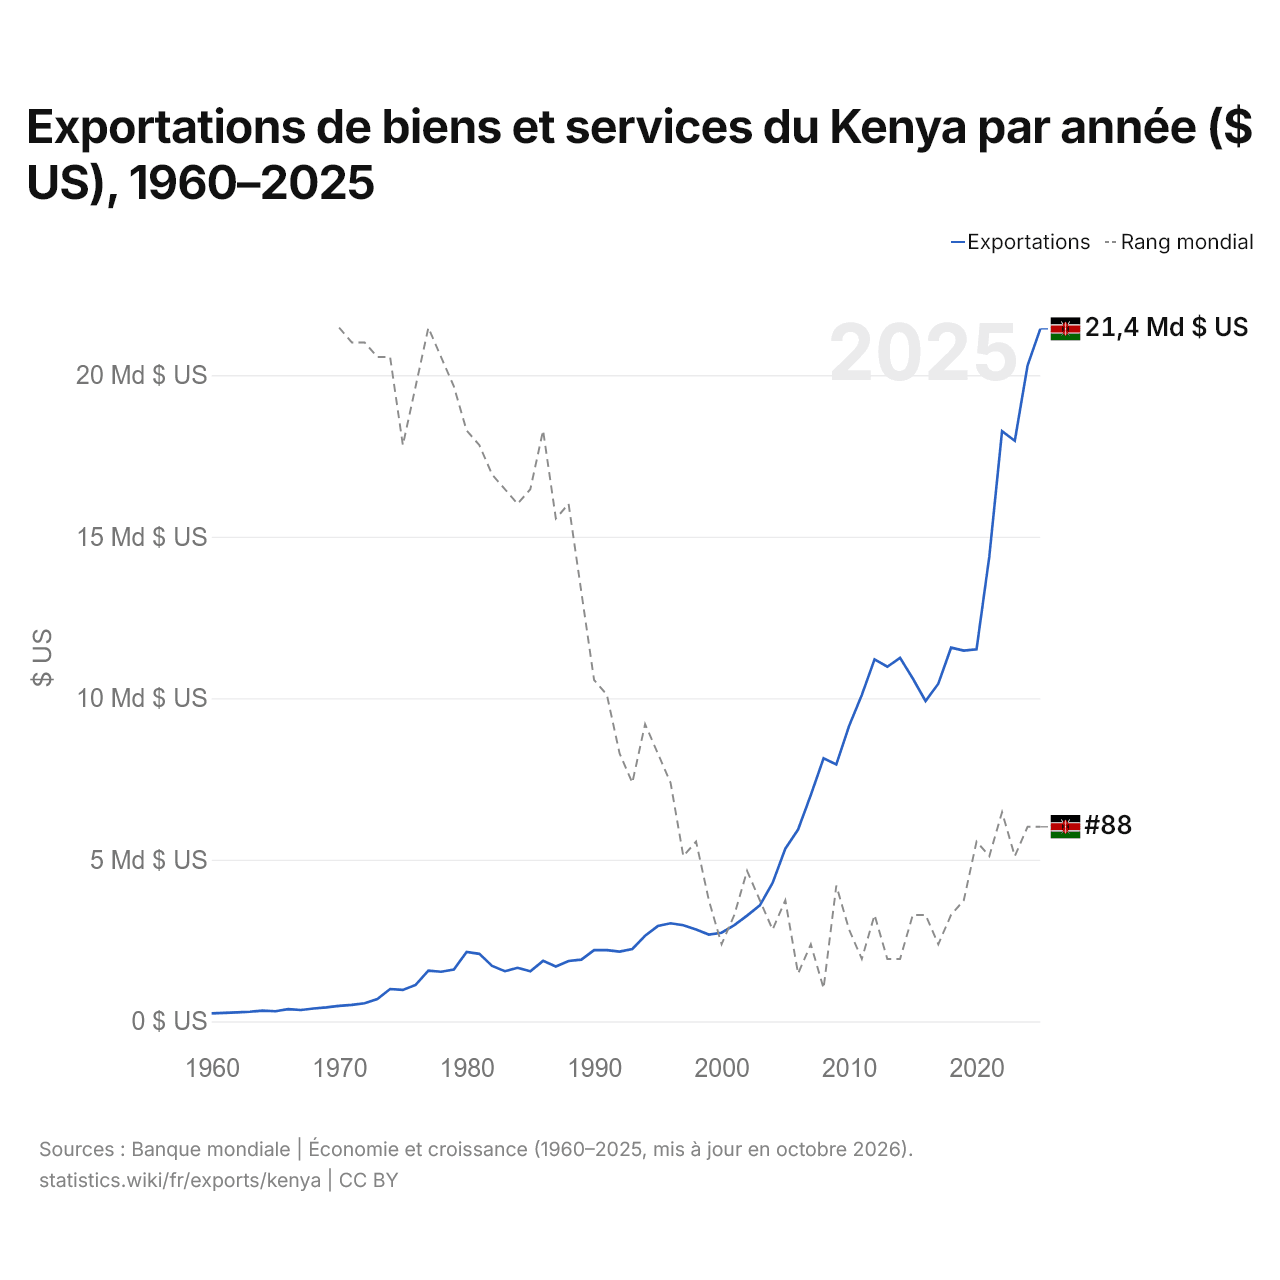
En 2025, les exportations de biens et services du Kenya s'élevaient à 21,4 milliards de dollars, contre 246 millions de dollars en 1960. Elles se classaient au 88e rang mondial, un rang qu'elles occupent depuis 2024. Leur meilleur rang a été le 54e, occupé pour la dernière fois en 1977.
En 2025, les exportations de biens et services du Kenya étaient les 11es plus élevées de 50 pays situés en Afrique. Les importations de biens et services du Kenya s'élevaient à 29,6 milliards de dollars en 2025, au 83e rang mondial. En 2025, les importations du Kenya dépassaient ses exportations de 8,15 milliards de dollars, soit un déficit commercial.
Exportations de biens du Kenya par catégorie, 2025
Exportations de biens, 2025: 8,62 Md $US
En 2025, la première catégorie des exportations de biens du Kenya était « cultures, plantes et fleurs (céréales, fruits, légumes, café, oléagineux) », avec 41,0 %, suivie de « pétrole, gaz, minerais et autres matières premières », avec 15,5 %.
Destinations des exportations de biens du Kenya : les 10 premières, 2025
| Rang | Pays | Exportations de biens | Part | |
|---|---|---|---|---|
| 1 |
 Ouganda |
1,25 Md $US | 14,5 % | vs Ouganda |
| 2 |
 États-Unis |
616 M $US | 7,15 % | |
| 3 |
 EAU |
601 M $US | 6,97 % | |
| 4 |
 Pakistan |
584 M $US | 6,77 % | |
| 5 |
 Pays-Bas |
533 M $US | 6,19 % | |
| 6 |
 Tanzanie |
486 M $US | 5,63 % | vs Tanzanie |
| 7 |
 Royaume-Uni |
464 M $US | 5,38 % | |
| 8 |
 Rwanda |
335 M $US | 3,89 % | vs Rwanda |
| 9 |
 RDC |
287 M $US | 3,33 % | vs RDC |
| 10 |
 Égypte |
205 M $US | 2,38 % | |
| Autres partenaires et non précisés | 3,26 Md $US | 37,8 % |
Exportations de biens du Kenya vers ses 5 principales destinations ($ US), 2001–2025
| Année | $ US | ||||
|---|---|---|---|---|---|
| Ouganda | États-Unis | Émirats arabes unis | Pakistan | Pays-Bas | |
| 2025 | 1 248 907 000 $ US | 616 213 000 $ US | 601 487 000 $ US | 583 978 000 $ US | 533 372 000 $ US |
| 2024 | 936 429 000 $ US | 662 507 000 $ US | 753 877 000 $ US | 570 422 000 $ US | 540 137 000 $ US |
| 2023 | 916 078 000 $ US | 461 447 000 $ US | 401 572 000 $ US | 566 747 000 $ US | 545 846 000 $ US |
| 2022 | 822 915 000 $ US | 679 333 000 $ US | 373 679 000 $ US | 544 272 000 $ US | 591 234 000 $ US |
| 2021 | 827 360 000 $ US | 543 351 000 $ US | 315 268 000 $ US | 485 039 000 $ US | 562 514 000 $ US |
| 2020 | 674 647 000 $ US | 464 054 000 $ US | 323 619 000 $ US | 513 662 000 $ US | 458 036 000 $ US |
| 2019 | 624 099 000 $ US | 508 512 000 $ US | 379 259 000 $ US | 443 431 000 $ US | 470 112 000 $ US |
| 2018 | 610 539 000 $ US | 467 263 000 $ US | 345 543 000 $ US | 586 164 000 $ US | 457 632 000 $ US |
| 2017 | 597 901 000 $ US | 457 224 000 $ US | 255 067 000 $ US | 619 604 000 $ US | 424 547 000 $ US |
| 2016 | 612 713 000 $ US | 427 318 000 $ US | 305 298 000 $ US | 396 767 000 $ US | 428 682 000 $ US |
| 2015 | 700 100 000 $ US | 415 775 000 $ US | 298 511 000 $ US | 359 878 000 $ US | 429 218 000 $ US |
| 2014 | 691 150 000 $ US | 435 387 000 $ US | 229 670 000 $ US | 250 407 000 $ US | 461 815 000 $ US |
| 2013 | 758 890 000 $ US | 347 576 000 $ US | 291 933 000 $ US | 280 165 000 $ US | 378 251 000 $ US |
| 2012 | 799 025 000 $ US | 312 845 000 $ US | 338 890 000 $ US | 282 991 000 $ US | 367 892 000 $ US |
| 2011 | 859 492 000 $ US | 290 993 000 $ US | 225 390 000 $ US | 237 742 000 $ US | 371 050 000 $ US |
| 2010 | 657 286 000 $ US | 284 946 000 $ US | 237 849 000 $ US | 227 920 000 $ US | 338 908 000 $ US |
| 2009 | 598 316 000 $ US | 226 081 000 $ US | 138 660 000 $ US | 196 311 000 $ US | 340 705 000 $ US |
| 2008 | 614 711 000 $ US | 299 605 000 $ US | 109 827 000 $ US | 202 327 000 $ US | 380 134 000 $ US |
| 2007 | 498 851 000 $ US | 285 763 000 $ US | 128 173 000 $ US | 201 040 000 $ US | 325 671 000 $ US |
| 2006 | 386 960 000 $ US | 291 277 000 $ US | 69 206 000 $ US | 201 680 000 $ US | 277 217 000 $ US |
| 2005 | 566 237 000 $ US | 228 094 000 $ US | 53 860 000 $ US | 186 159 000 $ US | 243 795 000 $ US |
| 2004 | 470 524 000 $ US | 48 249 000 $ US | 30 133 000 $ US | 144 430 000 $ US | 222 950 000 $ US |
| 2003 | 401 193 000 $ US | 40 912 000 $ US | 29 897 000 $ US | 130 897 000 $ US | 189 339 000 $ US |
| 2002 | 301 809 000 $ US | 19 707 000 $ US | 16 287 000 $ US | 33 930 000 $ US | 100 327 000 $ US |
| 2001 | 159 248 000 $ US | 40 401 000 $ US | 39 490 000 $ US | 112 544 000 $ US | 135 364 000 $ US |
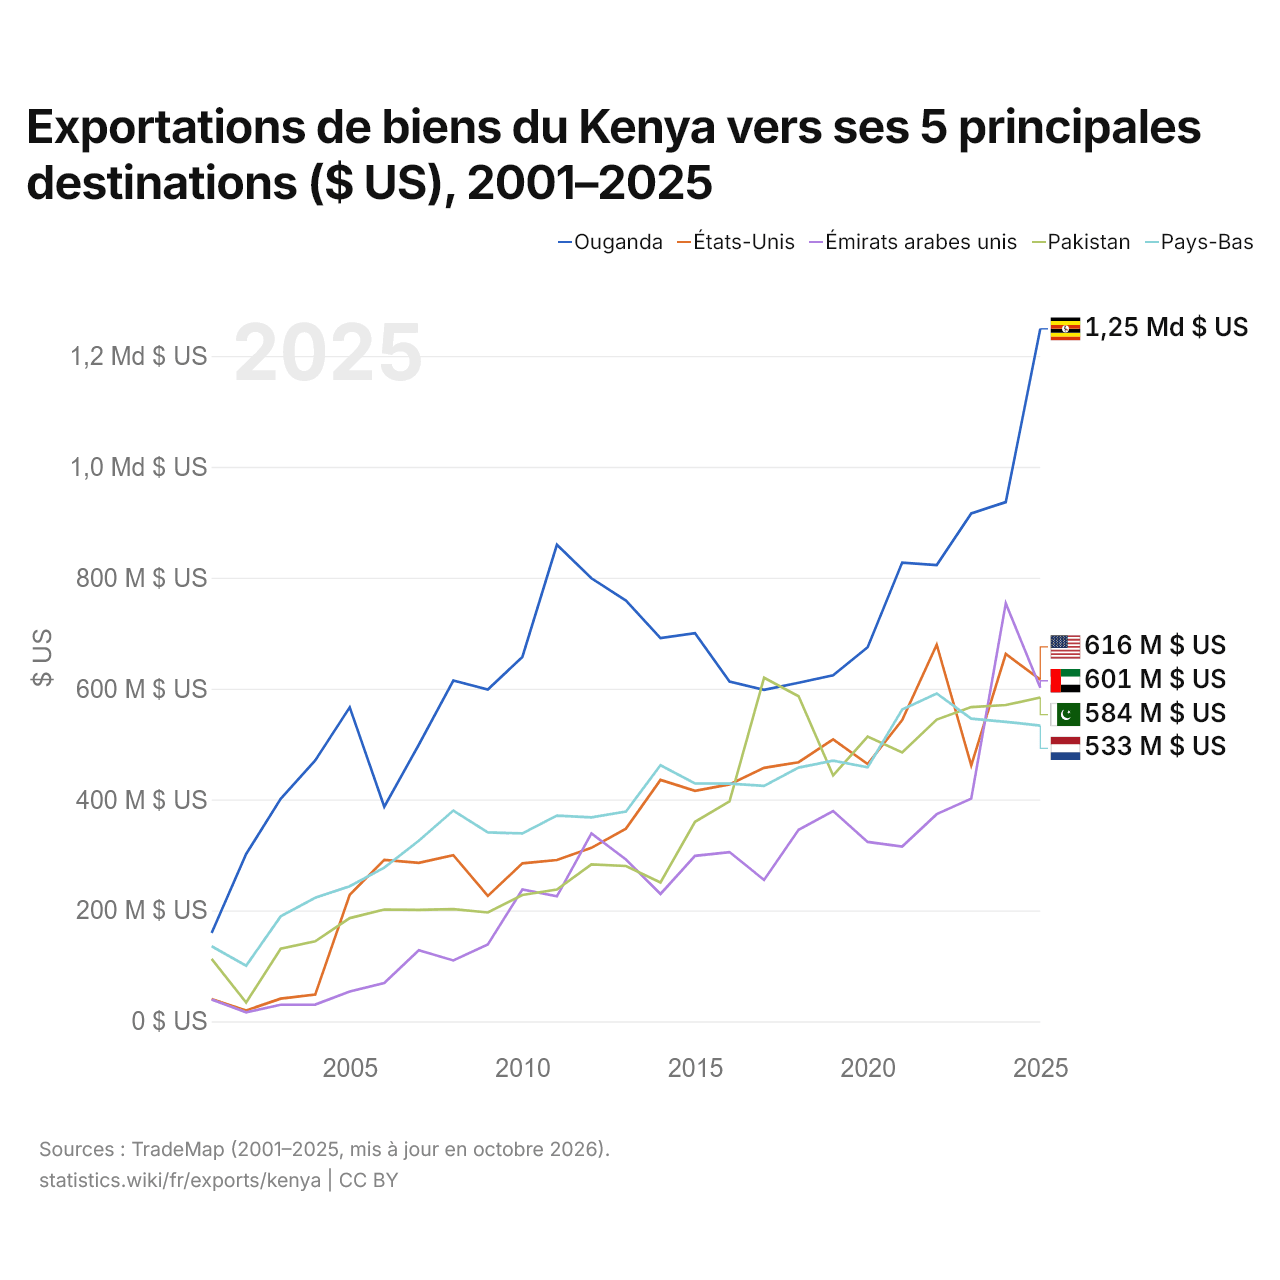
En 2025, les exportations de biens s'élevaient à 1,25 milliard de dollars vers l'Ouganda, 616 millions de dollars vers les États-Unis, 601 millions de dollars vers les Émirats arabes unis, 584 millions de dollars vers le Pakistan et 533 millions de dollars vers les Pays-Bas. Le premier rang des cinq destinations du Kenya est occupé par l'Ouganda depuis 2018. Le changement le plus récent dans leur ordre remonte à 2025, quand les exportations du Kenya vers les États-Unis ont dépassé celles vers les Émirats arabes unis.
Exportations de biens et de services du Kenya ($ US), 1975–2025
| Année | $ US | |
|---|---|---|
| Biens | Services | |
| 2025 | 13 036 055 581 $ US | 8 393 817 999 $ US |
| 2024 | 12 250 601 663 $ US | 8 042 349 983 $ US |
| 2023 | 10 850 321 214 $ US | 7 116 668 416 $ US |
| 2022 | 10 646 596 752 $ US | 7 616 062 587 $ US |
| 2021 | 9 011 127 290 $ US | 5 370 731 518 $ US |
| 2020 | 7 648 801 710 $ US | 3 867 470 329 $ US |
| 2019 | 5 870 736 830 $ US | 5 600 507 967 $ US |
| 2018 | 6 086 592 995 $ US | 5 477 461 359 $ US |
| 2017 | 5 801 181 358 $ US | 4 647 528 568 $ US |
| 2016 | 5 747 698 482 $ US | 4 165 117 576 $ US |
| 2015 | 5 970 149 702 $ US | 4 638 184 664 $ US |
| 2014 | 6 218 926 449 $ US | 5 024 215 634 $ US |
| 2013 | 5 846 194 605 $ US | 5 132 045 464 $ US |
| 2012 | 6 212 262 084 $ US | 4 993 158 861 $ US |
| 2011 | 5 833 526 949 $ US | 4 134 283 152 $ US |
| 2010 | 5 210 877 279 $ US | 3 772 188 993 $ US |
| 2009 | 4 492 093 091 $ US | 2 893 022 474 $ US |
| 2008 | 5 028 644 478 $ US | 3 261 906 712 $ US |
| 2007 | 4 123 210 762 $ US | 2 939 590 953 $ US |
| 2006 | 3 509 011 372 $ US | 2 436 765 260 $ US |
| 2005 | 3 459 469 536 $ US | 1 882 771 508 $ US |
| 2004 | 2 723 419 273 $ US | 1 559 069 432 $ US |
| 2003 | 2 409 571 843 $ US | 1 200 295 733 $ US |
| 2002 | 2 159 397 466 $ US | 1 056 269 685 $ US |
| 2001 | 1 888 506 138 $ US | 1 122 990 221 $ US |
| 2000 | 1 778 396 179 $ US | 997 202 019 $ US |
| 1999 | 1 756 694 528 $ US | 2 530 634 924 $ US |
| 1998 | 2 013 690 992 $ US | 2 356 294 855 $ US |
| 1997 | 2 057 847 269 $ US | 2 101 714 615 $ US |
| 1996 | 2 066 338 712 $ US | 1 595 821 637 $ US |
| 1995 | 1 908 394 032 $ US | 1 617 355 641 $ US |
| 1994 | 2 647 021 480 $ US | 1 574 037 372 $ US |
| 1993 | 2 335 641 001 $ US | 1 309 666 513 $ US |
| 1992 | 1 099 425 249 $ US | 1 051 282 715 $ US |
| 1991 | 1 185 348 191 $ US | 1 014 422 541 $ US |
| 1990 | 1 090 170 385 $ US | 1 138 305 285 $ US |
| 1989 | 1 000 512 011 $ US | 922 349 289 $ US |
| 1988 | 1 072 738 645 $ US | 798 947 434 $ US |
| 1987 | 960 649 549 $ US | 740 588 056 $ US |
| 1986 | 1 216 400 483 $ US | 648 968 794 $ US |
| 1985 | 988 186 752 $ US | 580 205 228 $ US |
| 1984 | 1 078 474 734 $ US | 545 654 794 $ US |
| 1983 | 980 654 596 $ US | 515 493 476 $ US |
| 1982 | 1 042 085 820 $ US | 565 996 709 $ US |
| 1981 | 1 188 505 331 $ US | 573 086 594 $ US |
| 1980 | 1 421 527 421 $ US | 585 834 253 $ US |
| 1979 | 1 108 181 590 $ US | 460 716 731 $ US |
| 1978 | 1 050 407 212 $ US | 445 831 168 $ US |
| 1977 | 1 212 822 597 $ US | 340 237 939 $ US |
| 1976 | 808 997 573 $ US | 298 548 669 $ US |
| 1975 | 686 622 260 $ US | 268 139 474 $ US |
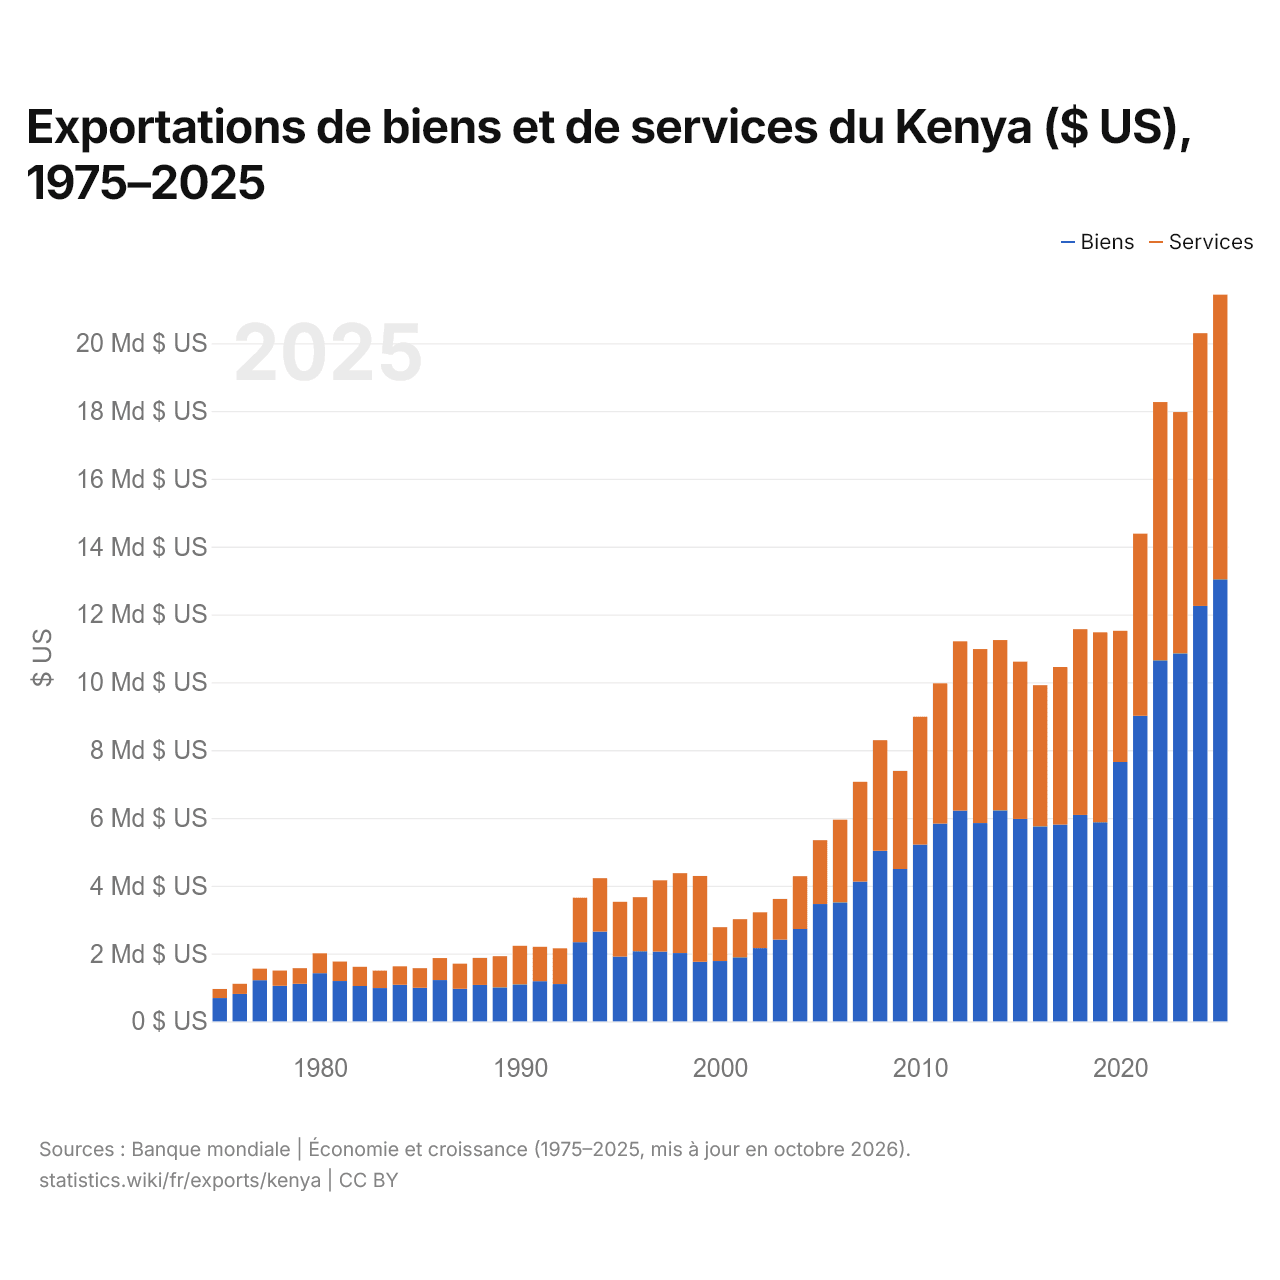
En 2025, les exportations de biens du Kenya s'élevaient à 13 milliards de dollars et celles de services à 8,39 milliards de dollars ; les services représentaient 39,2 % du total, contre 28,1 % en 1975.
Le Kenya dans le classement mondial des exportations, 2025







Exportations de biens et services du Kenya, % du PIB, 1960–2025
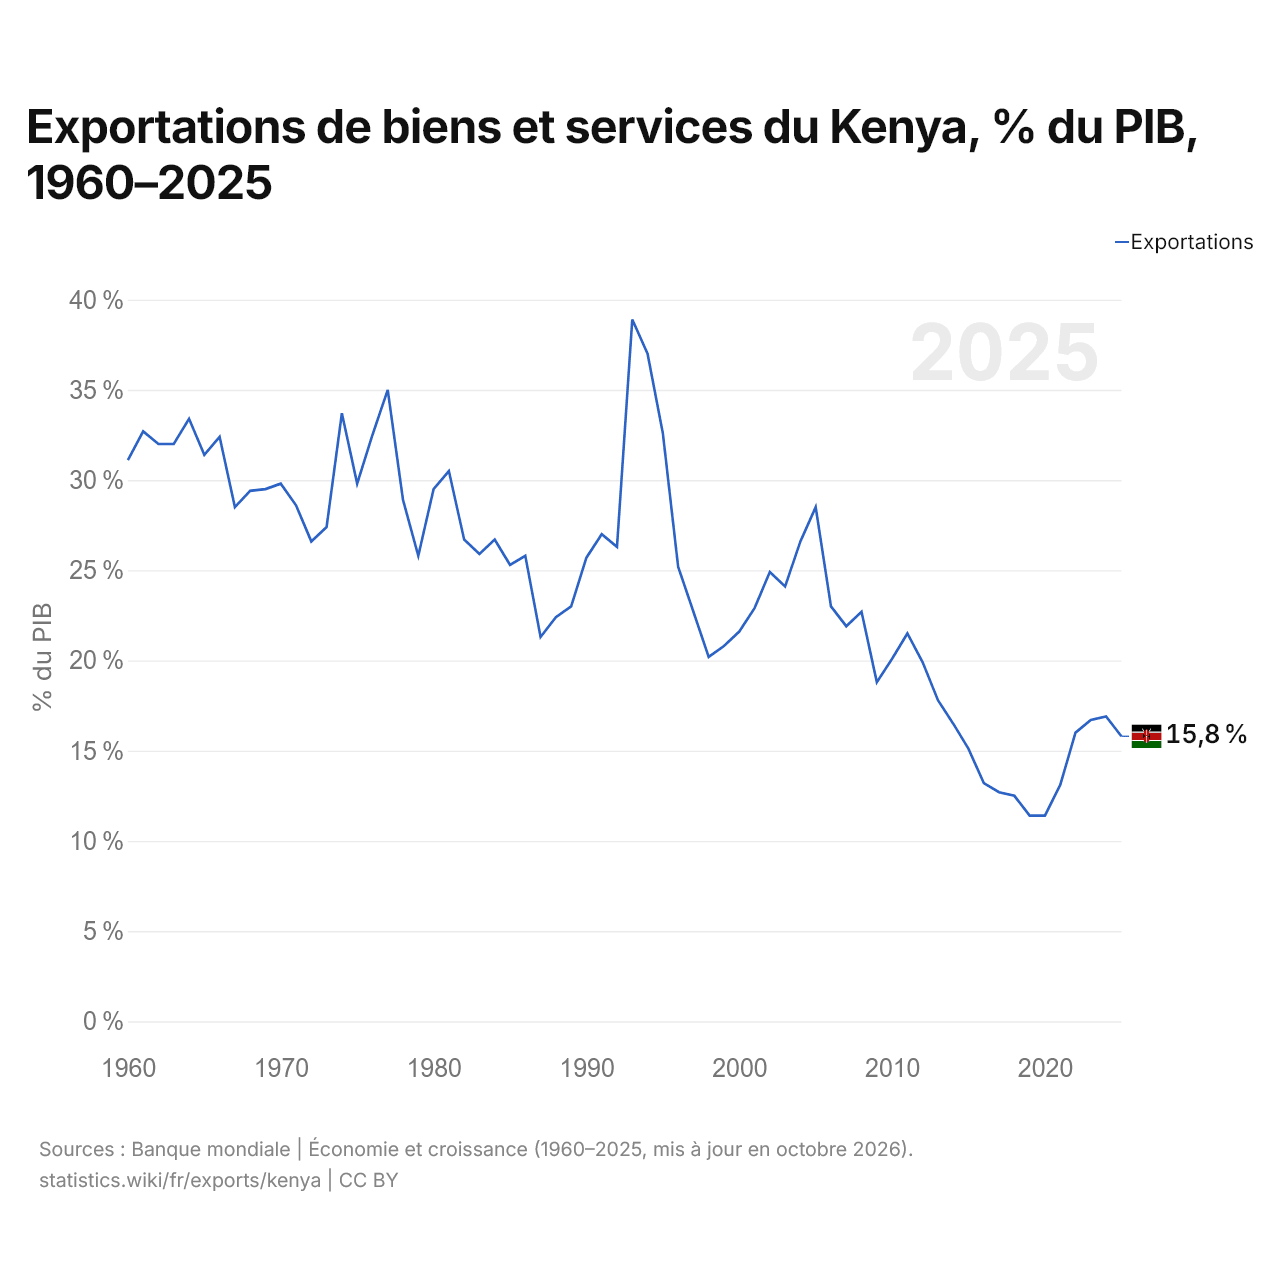
En 2025, les exportations de biens et services du Kenya équivalaient à 15,8 % de son PIB, contre 31,1 % en 1960. La part la plus élevée a été de 38,9 %, en 1993.
Comparer les exportations du Kenya avec celles d'autres pays
Sources :
- Banque mondiale | Économie et croissance (1960–2025, mis à jour en octobre 2026)
- TradeMap (2001–2025, mis à jour en octobre 2026)
Creative Commons Attribution (CC BY) : vous pouvez copier, partager, adapter et réutiliser ce contenu, y compris à des fins commerciales, à condition de citer statistics.wiki et d’indiquer les modifications apportées. Les sources citées ci-dessus peuvent avoir leurs propres conditions de licence.