
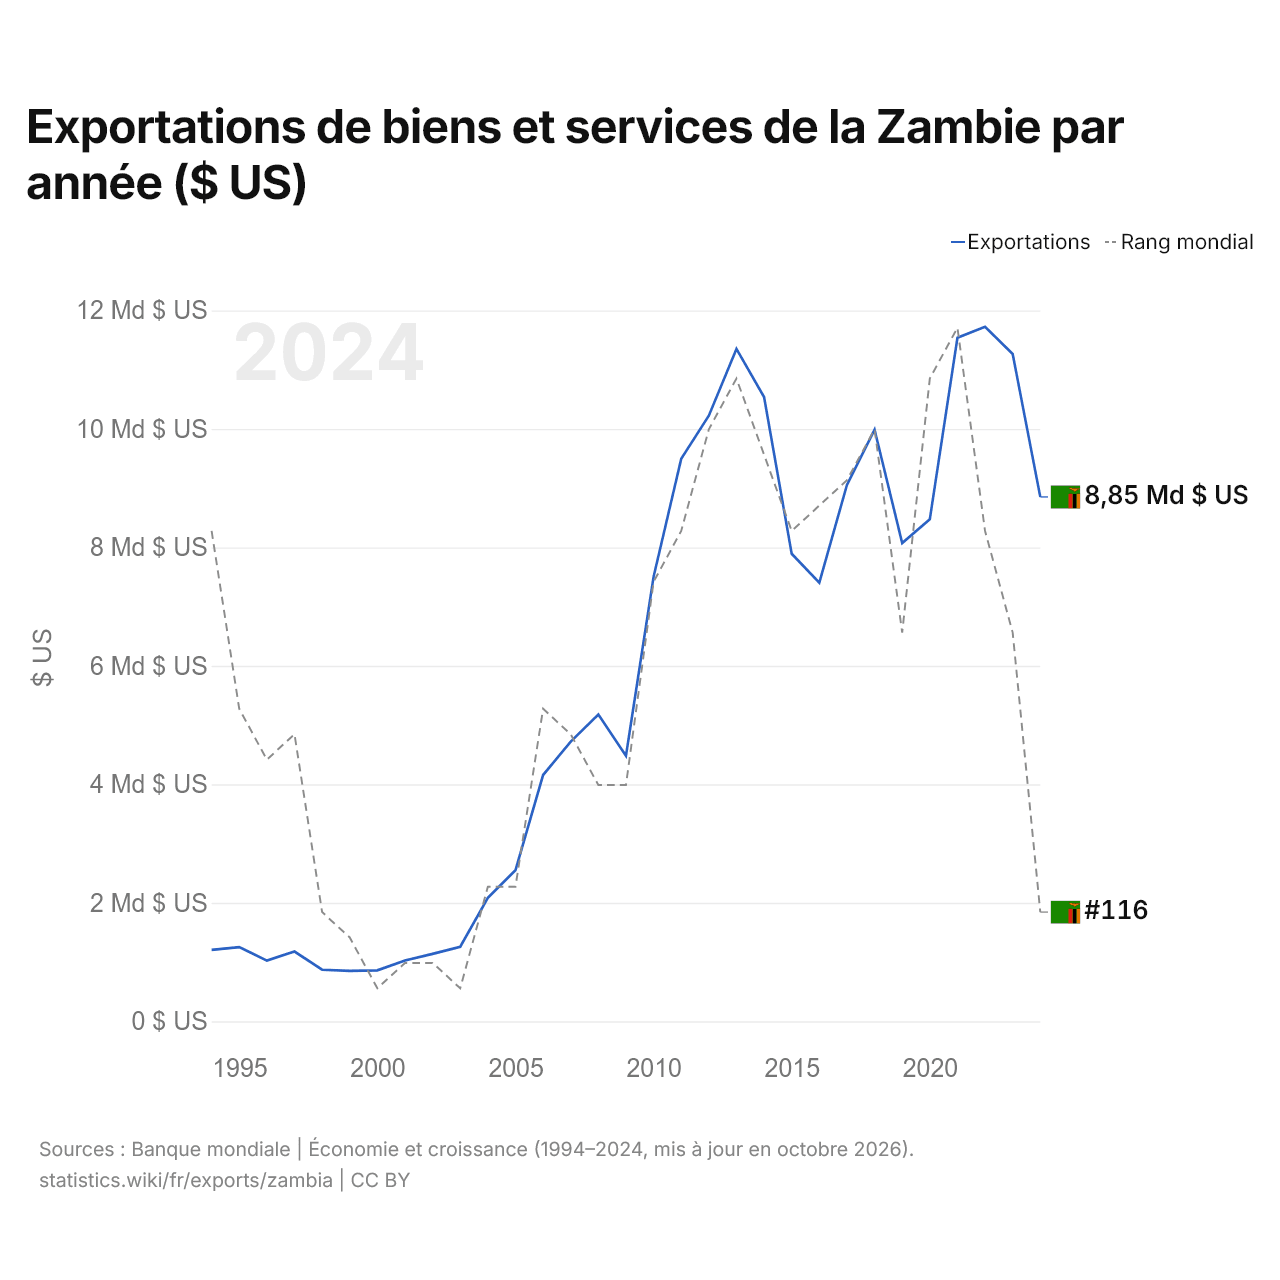
Exportations de biens et services de la Zambie par année ($ US)
| Année | $ US | Rang mondial |
|---|---|---|
| Exportations | Rang mondial | |
| 2024 | 8 851 528 098 $ US | #116 |
| 2023 | 11 264 526 288 $ US | #105 |
| 2022 | 11 722 089 926 $ US | #101 |
| 2021 | 11 537 884 956 $ US | #93 |
| 2020 | 8 473 997 597 $ US | #95 |
| 2019 | 8 073 235 066 $ US | #105 |
| 2018 | 9 987 165 259 $ US | #97 |
| 2017 | 9 053 912 488 $ US | #99 |
| 2016 | 7 403 491 271 $ US | #100 |
| 2015 | 7 892 388 634 $ US | #101 |
| 2014 | 10 536 766 856 $ US | #98 |
| 2013 | 11 350 236 220 $ US | #95 |
| 2012 | 10 222 369 009 $ US | #97 |
| 2011 | 9 494 352 665 $ US | #101 |
| 2010 | 7 503 512 539 $ US | #103 |
| 2009 | 4 483 693 050 $ US | #111 |
| 2008 | 5 179 705 636 $ US | #111 |
| 2007 | 4 721 899 913 $ US | #109 |
| 2006 | 4 157 837 751 $ US | #108 |
| 2005 | 2 550 444 808 $ US | #115 |
| 2004 | 2 086 559 263 $ US | #115 |
| 2003 | 1 258 994 467 $ US | #119 |
| 2002 | 1 137 945 890 $ US | #118 |
| 2001 | 1 028 101 891 $ US | #118 |
| 2000 | 861 410 215 $ US | #119 |
| 1999 | 852 338 277 $ US | #117 |
| 1998 | 870 912 947 $ US | #116 |
| 1997 | 1 177 864 173 $ US | #109 |
| 1996 | 1 024 449 292 $ US | #110 |
| 1995 | 1 252 536 630 $ US | #108 |
| 1994 | 1 204 932 093 $ US | #101 |
Les exportations de biens et services de la Zambie s'élèvent à 8,85 milliards de dollars (2024), contre 1,2 milliard de dollars en 1994. Le maximum a été de 11,7 milliards de dollars, en 2022. Elles se classent au 116e rang mondial, en baisse par rapport au 105e rang l'année précédente. Leur meilleur rang a été le 93e, occupé pour la dernière fois en 2021.
Les exportations de biens et services de la Zambie sont les 21es plus élevées de 50 pays situés en Afrique. Les importations de biens et services de la Zambie s'élèvent à 6,97 milliards de dollars (2024), au 129e rang mondial. Les exportations de la Zambie dépassent ses importations de 1,88 milliard de dollars, soit un excédent commercial (2024).
Exportations de biens de la Zambie par catégorie, 2025
Exportations de biens, 2025: 13,3 Md $US
En 2025, la première catégorie des exportations de biens de la Zambie était « métaux communs (fer, acier, cuivre, aluminium) », avec 67,1 %, suivie de « pétrole, gaz, minerais et autres matières premières », avec 14,7 %.
Destinations des exportations de biens de la Zambie : les 10 premières, 2025
| Rang | Pays | Exportations de biens | Part | |
|---|---|---|---|---|
| 1 |
 Canada |
3,44 Md $US | 25,8 % | |
| 2 |
 Suisse |
2,20 Md $US | 16,5 % | |
| 3 |
 Singapour |
1,83 Md $US | 13,7 % | |
| 4 |
 RDC |
1,59 Md $US | 12 % | vs RDC |
| 5 |
 Chine |
1,17 Md $US | 8,8 % | |
| 6 |
 EAU |
735 M $US | 5,52 % | |
| 7 |
 Afrique du Sud |
463 M $US | 3,48 % | |
| 8 |
 Zimbabwe |
354 M $US | 2,65 % | vs Zimbabwe |
| 9 |
 Tanzanie |
292 M $US | 2,19 % | vs Tanzanie |
| 10 |
 Namibie |
240 M $US | 1,8 % | vs Namibie |
| Autres partenaires et non précisés | 1,02 Md $US | 7,63 % |
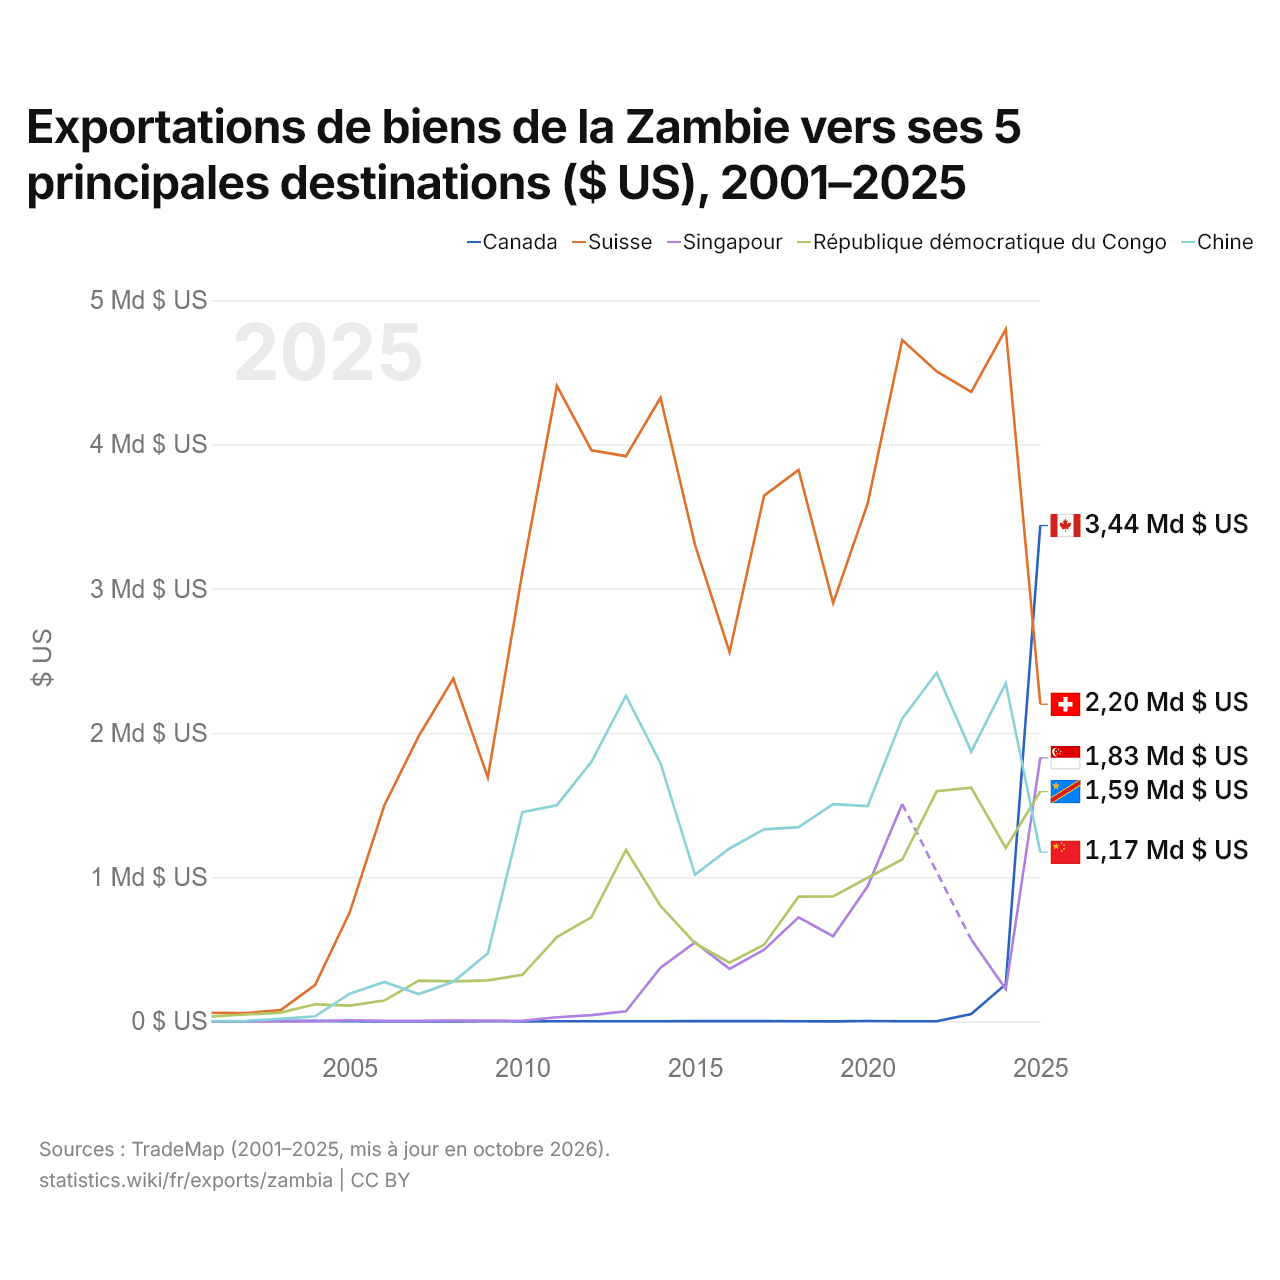
Exportations de biens de la Zambie vers ses 5 principales destinations ($ US), 2001–2025
| Année | $ US | ||||
|---|---|---|---|---|---|
| Canada | Suisse | Singapour | République démocratique du Congo | Chine | |
| 2025 | 3 437 592 000 $ US | 2 198 326 000 $ US | 1 826 594 000 $ US | 1 593 019 000 $ US | 1 172 479 000 $ US |
| 2024 | 257 428 000 $ US | 4 797 775 000 $ US | 223 271 000 $ US | 1 201 625 000 $ US | 2 342 788 000 $ US |
| 2023 | 50 359 000 $ US | 4 364 103 000 $ US | 567 411 000 $ US | 1 619 352 000 $ US | 1 869 446 000 $ US |
| 2022 | 314 000 $ US | 4 505 556 000 $ US | - | 1 594 892 000 $ US | 2 416 479 000 $ US |
| 2021 | 764 000 $ US | 4 723 507 000 $ US | 1 505 880 000 $ US | 1 121 576 000 $ US | 2 098 993 000 $ US |
| 2020 | 2 035 000 $ US | 3 589 581 000 $ US | 935 537 000 $ US | 995 024 000 $ US | 1 492 493 000 $ US |
| 2019 | 132 000 $ US | 2 899 572 000 $ US | 589 677 000 $ US | 866 133 000 $ US | 1 506 024 000 $ US |
| 2018 | 297 000 $ US | 3 822 432 000 $ US | 721 417 000 $ US | 864 636 000 $ US | 1 346 134 000 $ US |
| 2017 | 1 251 000 $ US | 3 644 395 000 $ US | 496 331 000 $ US | 531 102 000 $ US | 1 331 136 000 $ US |
| 2016 | 1 463 000 $ US | 2 559 060 000 $ US | 363 386 000 $ US | 406 202 000 $ US | 1 198 457 000 $ US |
| 2015 | 1 277 000 $ US | 3 303 296 000 $ US | 547 230 000 $ US | 541 020 000 $ US | 1 017 494 000 $ US |
| 2014 | 458 000 $ US | 4 323 207 000 $ US | 371 816 000 $ US | 800 061 000 $ US | 1 789 814 000 $ US |
| 2013 | 406 000 $ US | 3 917 967 000 $ US | 70 004 000 $ US | 1 187 937 000 $ US | 2 257 462 000 $ US |
| 2012 | 386 000 $ US | 3 959 038 000 $ US | 43 453 000 $ US | 722 318 000 $ US | 1 799 292 000 $ US |
| 2011 | 487 000 $ US | 4 405 329 000 $ US | 28 321 000 $ US | 584 144 000 $ US | 1 498 462 000 $ US |
| 2010 | 158 000 $ US | 3 113 584 000 $ US | 3 346 000 $ US | 322 512 000 $ US | 1 450 412 000 $ US |
| 2009 | 609 000 $ US | 1 690 956 000 $ US | 4 921 000 $ US | 283 820 000 $ US | 472 056 000 $ US |
| 2008 | 224 000 $ US | 2 375 770 000 $ US | 4 824 000 $ US | 276 504 000 $ US | 274 705 000 $ US |
| 2007 | 204 000 $ US | 1 978 186 000 $ US | 3 657 000 $ US | 282 665 000 $ US | 189 362 000 $ US |
| 2006 | 246 000 $ US | 1 496 290 000 $ US | 3 724 000 $ US | 143 955 000 $ US | 273 438 000 $ US |
| 2005 | 303 000 $ US | 755 667 000 $ US | 7 387 000 $ US | 108 668 000 $ US | 192 123 000 $ US |
| 2004 | 2 709 000 $ US | 253 247 000 $ US | 479 000 $ US | 118 066 000 $ US | 35 208 000 $ US |
| 2003 | 2 016 000 $ US | 77 358 000 $ US | 395 000 $ US | 60 628 000 $ US | 16 820 000 $ US |
| 2002 | 730 000 $ US | 57 436 000 $ US | 590 000 $ US | 47 525 000 $ US | 3 717 000 $ US |
| 2001 | 473 000 $ US | 59 696 000 $ US | 342 000 $ US | 33 910 000 $ US | 588 000 $ US |
En 2025, les exportations de biens s'élevaient à 3,44 milliards de dollars vers le Canada, 2,2 milliards de dollars vers la Suisse, 1,83 milliard de dollars vers Singapour, 1,59 milliard de dollars vers la République démocratique du Congo et 1,17 milliard de dollars vers la Chine. Le changement le plus récent dans leur ordre remonte à 2025, quand les exportations de la Zambie vers le Canada ont dépassé celles vers la Suisse.
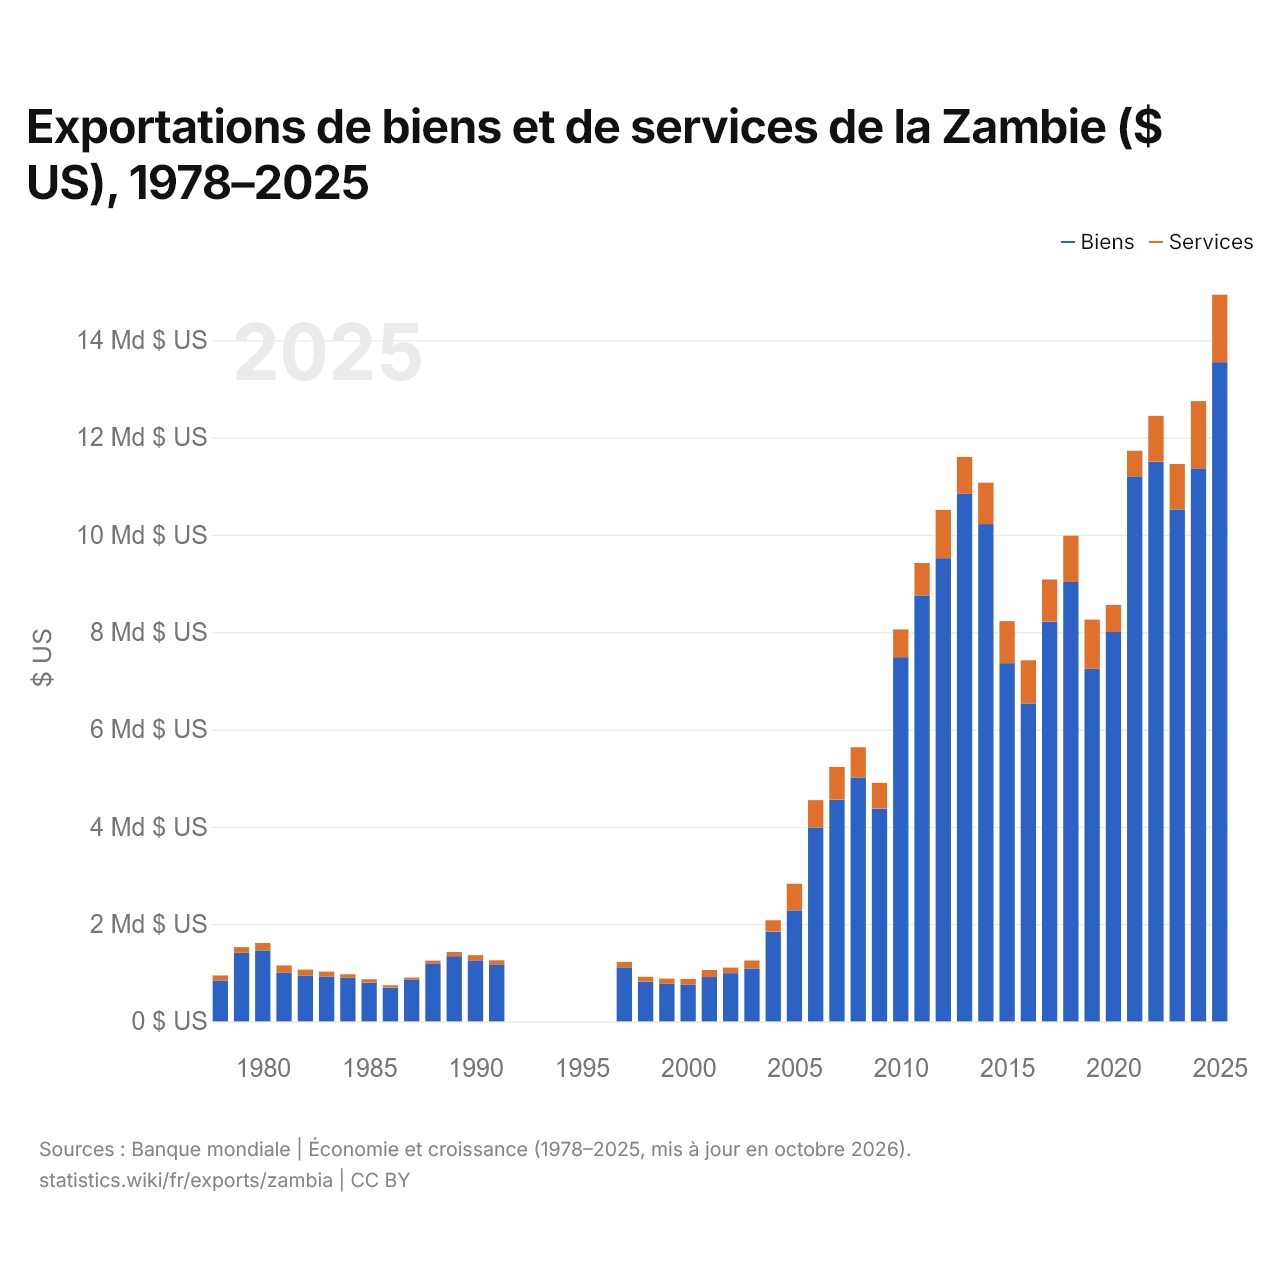
Exportations de biens et de services de la Zambie ($ US), 1978–2025
| Année | $ US | |
|---|---|---|
| Biens | Services | |
| 2025 | 13 547 013 332 $ US | 1 388 167 370 $ US |
| 2024 | 11 366 787 901 $ US | 1 379 861 354 $ US |
| 2023 | 10 521 101 209 $ US | 932 798 981 $ US |
| 2022 | 11 504 782 266 $ US | 938 916 418 $ US |
| 2021 | 11 201 979 700 $ US | 525 541 832 $ US |
| 2020 | 8 002 853 405 $ US | 555 624 814 $ US |
| 2019 | 7 246 057 821 $ US | 1 011 822 350 $ US |
| 2018 | 9 029 401 556 $ US | 953 204 795 $ US |
| 2017 | 8 215 549 658 $ US | 864 940 287 $ US |
| 2016 | 6 534 819 286 $ US | 885 102 775 $ US |
| 2015 | 7 361 953 250 $ US | 861 512 074 $ US |
| 2014 | 10 220 151 404 $ US | 850 866 424 $ US |
| 2013 | 10 843 374 324 $ US | 758 019 429 $ US |
| 2012 | 9 520 790 727 $ US | 990 095 738 $ US |
| 2011 | 8 753 615 653 $ US | 665 404 102 $ US |
| 2010 | 7 483 488 751 $ US | 570 852 570 $ US |
| 2009 | 4 371 909 782 $ US | 528 549 368 $ US |
| 2008 | 5 013 122 980 $ US | 618 541 334 $ US |
| 2007 | 4 555 622 325 $ US | 671 525 767 $ US |
| 2006 | 3 984 807 086 $ US | 562 284 084 $ US |
| 2005 | 2 278 227 201 $ US | 549 467 860 $ US |
| 2004 | 1 844 506 000 $ US | 231 800 000 $ US |
| 2003 | 1 086 517 000 $ US | 165 000 000 $ US |
| 2002 | 989 149 000 $ US | 115 320 000 $ US |
| 2001 | 910 785 000 $ US | 144 040 000 $ US |
| 2000 | 756 960 000 $ US | 115 010 000 $ US |
| 1999 | 772 000 000 $ US | 106 600 000 $ US |
| 1998 | 814 400 000 $ US | 102 400 000 $ US |
| 1997 | 1 110 400 000 $ US | 111 900 000 $ US |
| 1996 | - | - |
| 1995 | - | - |
| 1994 | - | - |
| 1993 | - | - |
| 1992 | - | - |
| 1991 | 1 172 200 000 $ US | 82 900 000 $ US |
| 1990 | 1 253 500 000 $ US | 106 800 000 $ US |
| 1989 | 1 340 000 000 $ US | 85 300 000 $ US |
| 1988 | 1 189 500 000 $ US | 58 100 000 $ US |
| 1987 | 852 100 000 $ US | 47 700 000 $ US |
| 1986 | 692 500 000 $ US | 47 000 000 $ US |
| 1985 | 797 000 000 $ US | 68 100 000 $ US |
| 1984 | 892 600 000 $ US | 75 500 000 $ US |
| 1983 | 923 100 000 $ US | 98 600 000 $ US |
| 1982 | 942 000 000 $ US | 121 700 000 $ US |
| 1981 | 996 200 000 $ US | 152 800 000 $ US |
| 1980 | 1 457 300 000 $ US | 151 400 000 $ US |
| 1979 | 1 407 800 000 $ US | 115 500 000 $ US |
| 1978 | 830 700 000 $ US | 112 700 000 $ US |
En 2025, les exportations de biens de la Zambie s'élevaient à 13,5 milliards de dollars et celles de services à 1,39 milliard de dollars ; les services représentaient 9,3 % du total, contre 11,9 % en 1978.
La Zambie dans le classement mondial des exportations
| Rang | Pays | Exportations | Part mondiale | |
|---|---|---|---|---|
| 113 |
 Burkina Faso |
9,67 Md $US (2025) | 0,03 % | vs Burkina Faso |
| 114 |
 Nicaragua |
9,25 Md $US (2025) | 0,03 % | |
| 115 |
 Mozambique |
9,24 Md $US (2025) | 0,03 % | |
| 116 |
 Zambie |
8,85 Md $US | 0,03 % | |
| 117 |
 Cuba |
8,77 Md $US (2020) | 0,04 % | |
| 118 |
 Congo-Brazza |
7,83 Md $US (2025) | 0,02 % | |
| 119 |
 Cameroun |
7,71 Md $US (2025) | 0,02 % |
Exportations de biens et services de la Zambie, % du PIB
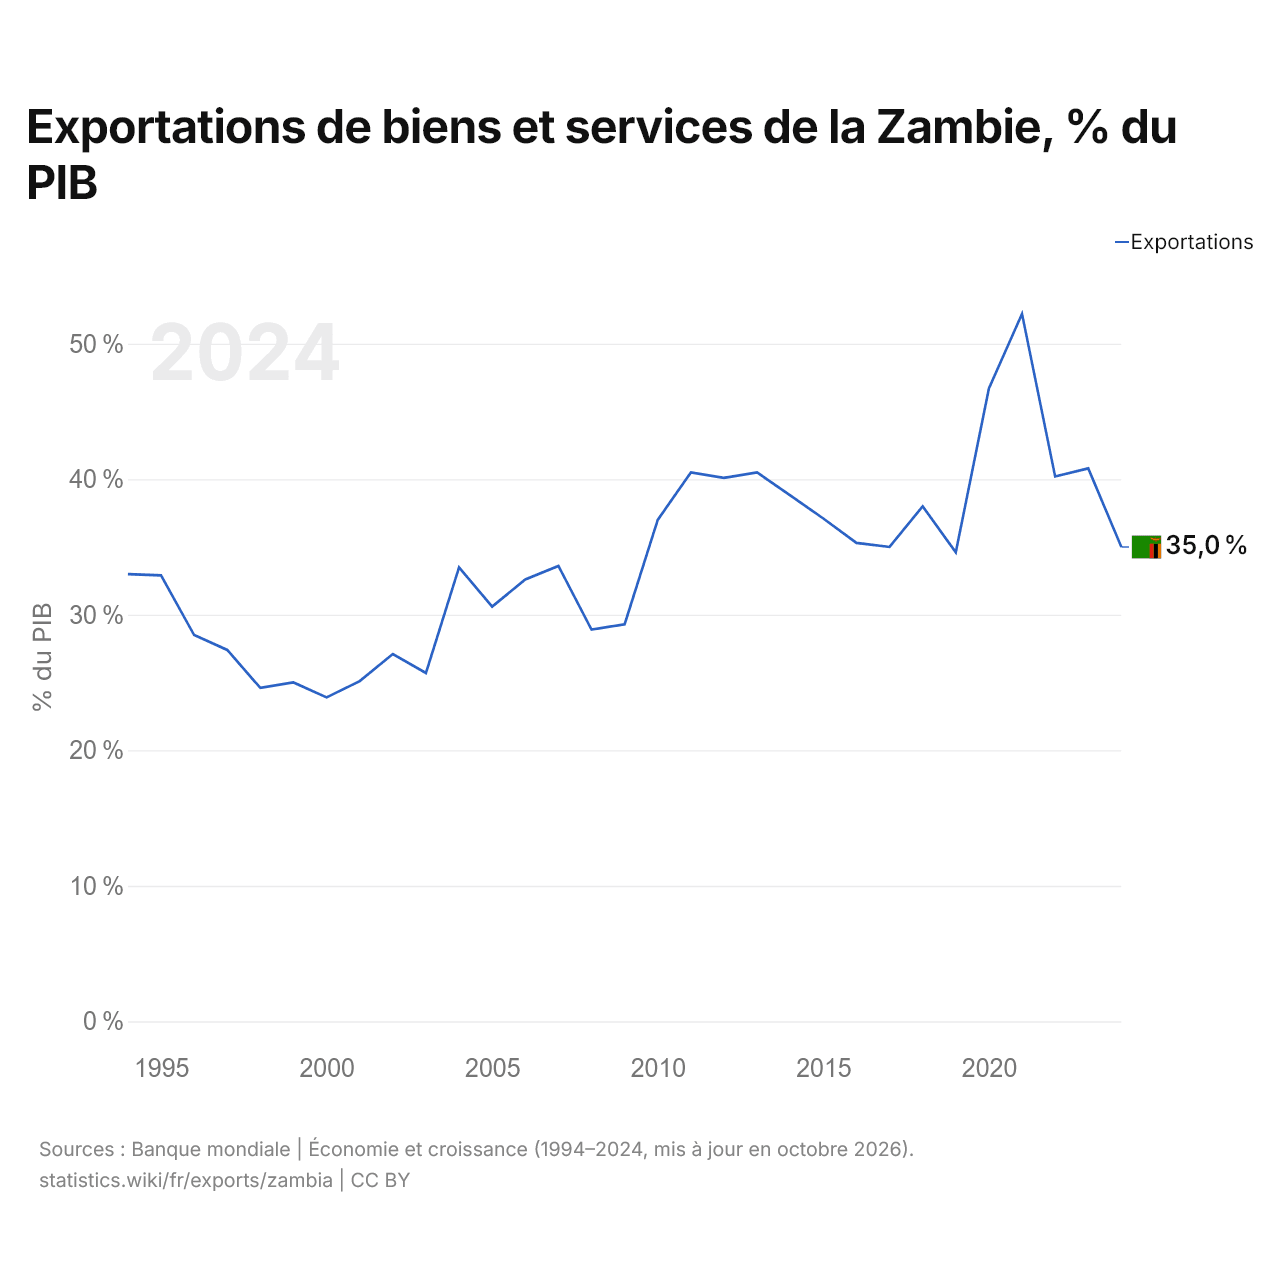
Les exportations de biens et services de la Zambie équivalent à 35,0 % de son PIB (2024), contre 33,0 % en 1994. La part la plus élevée a été de 52,2 %, en 2021.
Comparer les exportations de la Zambie avec celles d'autres pays
Sources :
- TradeMap (2001–2025, mis à jour en octobre 2026)
- Banque mondiale | Économie et croissance (1978–2025, mis à jour en octobre 2026)
Creative Commons Attribution (CC BY) : vous pouvez copier, partager, adapter et réutiliser ce contenu, y compris à des fins commerciales, à condition de citer statistics.wiki et d’indiquer les modifications apportées. Les sources citées ci-dessus peuvent avoir leurs propres conditions de licence.