
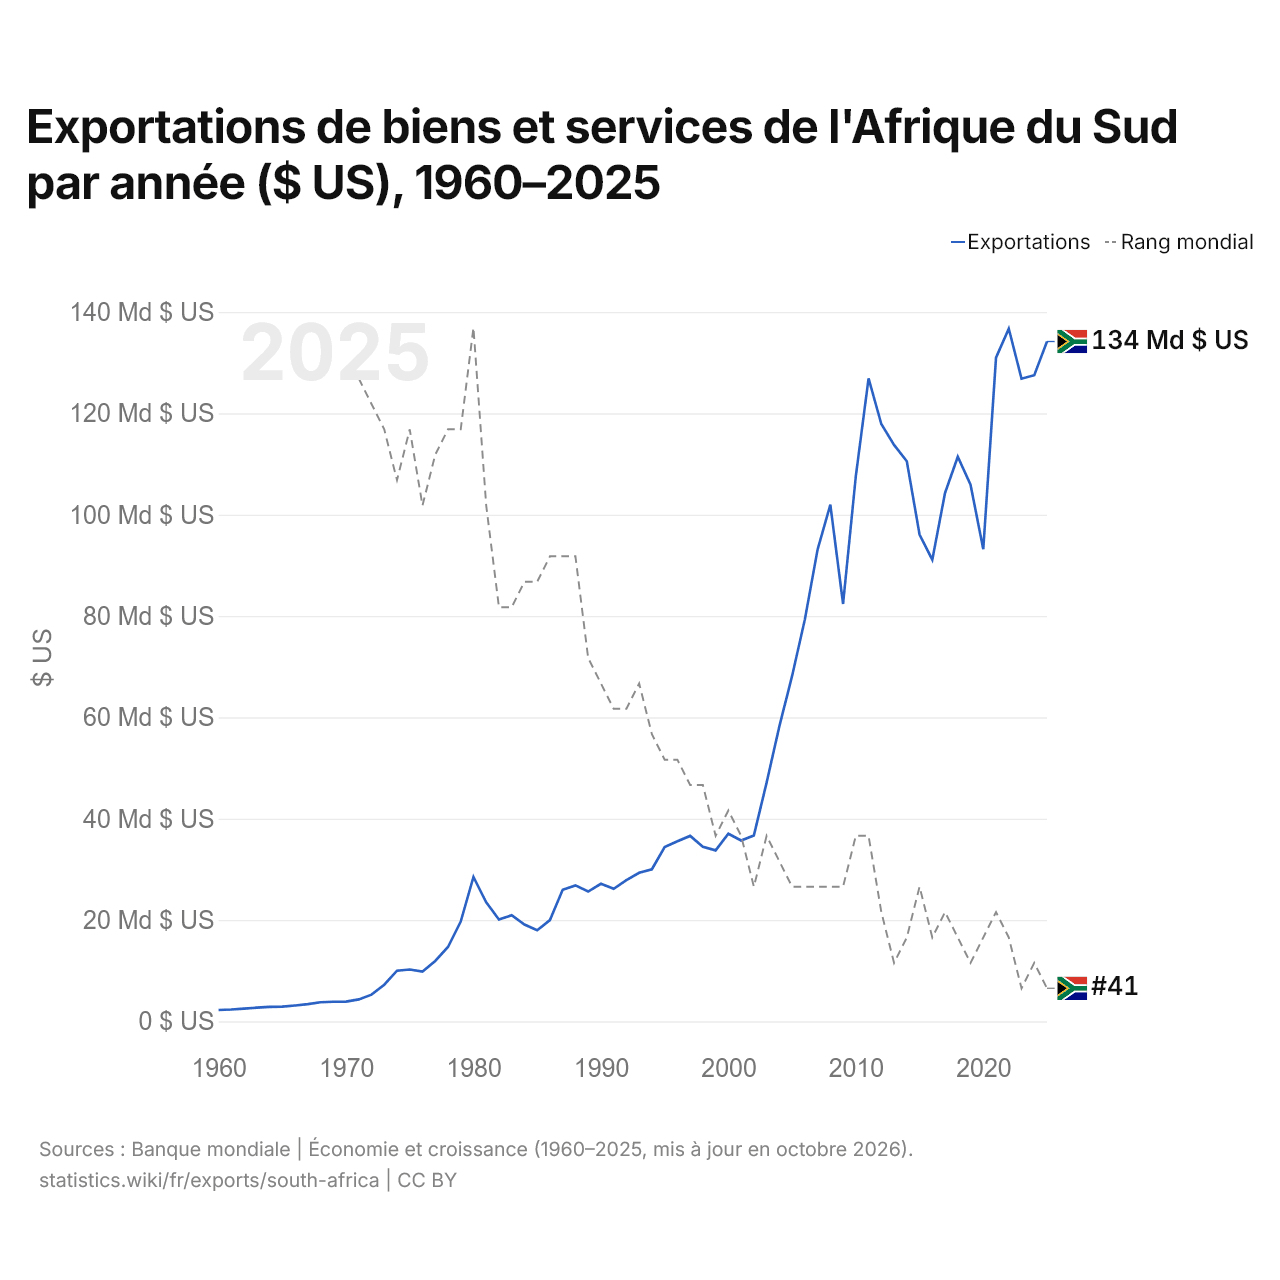
Exportations de biens et services de l'Afrique du Sud par année ($ US), 1960–2025
| Année | $ US | Rang mondial |
|---|---|---|
| Exportations | Rang mondial | |
| 2025 | 134 179 428 668 $ US | #41 |
| 2024 | 127 531 645 077 $ US | #40 |
| 2023 | 126 843 584 296 $ US | #41 |
| 2022 | 136 705 431 597 $ US | #39 |
| 2021 | 131 000 485 997 $ US | #38 |
| 2020 | 93 199 600 859 $ US | #39 |
| 2019 | 105 906 059 179 $ US | #40 |
| 2018 | 111 434 691 806 $ US | #39 |
| 2017 | 104 288 394 993 $ US | #38 |
| 2016 | 91 109 021 409 $ US | #39 |
| 2015 | 96 085 897 668 $ US | #37 |
| 2014 | 110 550 033 012 $ US | #39 |
| 2013 | 113 768 565 563 $ US | #40 |
| 2012 | 117 892 612 029 $ US | #38 |
| 2011 | 126 912 776 369 $ US | #35 |
| 2010 | 107 610 657 456 $ US | #35 |
| 2009 | 82 381 621 006 $ US | #37 |
| 2008 | 101 967 105 839 $ US | #37 |
| 2007 | 93 124 912 620 $ US | #37 |
| 2006 | 79 301 796 384 $ US | #37 |
| 2005 | 68 171 982 952 $ US | #37 |
| 2004 | 58 215 305 278 $ US | #36 |
| 2003 | 47 117 624 127 $ US | #35 |
| 2002 | 36 701 099 078 $ US | #37 |
| 2001 | 35 694 800 702 $ US | #35 |
| 2000 | 37 034 203 153 $ US | #34 |
| 1999 | 33 741 638 410 $ US | #35 |
| 1998 | 34 450 654 127 $ US | #33 |
| 1997 | 36 601 647 323 $ US | #33 |
| 1996 | 35 543 985 845 $ US | #32 |
| 1995 | 34 412 207 048 $ US | #32 |
| 1994 | 30 010 718 717 $ US | #31 |
| 1993 | 29 312 901 692 $ US | #29 |
| 1992 | 27 855 753 864 $ US | #30 |
| 1991 | 26 149 497 613 $ US | #30 |
| 1990 | 27 148 931 269 $ US | #29 |
| 1989 | 25 616 574 210 $ US | #28 |
| 1988 | 26 828 616 017 $ US | #24 |
| 1987 | 25 959 795 347 $ US | #24 |
| 1986 | 19 987 466 259 $ US | #24 |
| 1985 | 17 986 023 085 $ US | #25 |
| 1984 | 19 094 719 161 $ US | #25 |
| 1983 | 20 941 567 184 $ US | #26 |
| 1982 | 20 090 880 960 $ US | #26 |
| 1981 | 23 474 809 675 $ US | #22 |
| 1980 | 28 496 444 685 $ US | #15 |
| 1979 | 19 695 423 997 $ US | #19 |
| 1978 | 14 669 403 667 $ US | #19 |
| 1977 | 11 914 002 979 $ US | #20 |
| 1976 | 9 840 552 460 $ US | #22 |
| 1975 | 10 231 126 641 $ US | #19 |
| 1974 | 9 997 395 055 $ US | #21 |
| 1973 | 7 213 682 653 $ US | #19 |
| 1972 | 5 260 658 883 $ US | #18 |
| 1971 | 4 325 959 814 $ US | #17 |
| 1970 | 3 904 598 438 $ US | #17 |
| 1969 | 3 859 798 456 $ US | - |
| 1968 | 3 760 398 496 $ US | - |
| 1967 | 3 385 198 646 $ US | - |
| 1966 | 3 123 398 751 $ US | - |
| 1965 | 2 913 398 835 $ US | - |
| 1964 | 2 846 198 862 $ US | - |
| 1963 | 2 696 398 921 $ US | - |
| 1962 | 2 498 999 000 $ US | - |
| 1961 | 2 337 999 065 $ US | - |
| 1960 | 2 238 599 105 $ US | - |
En 2025, les exportations de biens et services de l'Afrique du Sud s'élevaient à 134 milliards de dollars, contre 2,24 milliards de dollars en 1960. Le maximum a été de 137 milliards de dollars, en 2022. Elles se classaient au 41e rang mondial, en baisse par rapport au 40e rang en 2024. Leur meilleur rang a été le 15e, occupé pour la dernière fois en 1980.
En 2025, les exportations de biens et services de l'Afrique du Sud étaient les plus élevées de 50 pays situés en Afrique. Les importations de biens et services de l'Afrique du Sud s'élevaient à 126 milliards de dollars en 2025, au 43e rang mondial. En 2025, les exportations de l'Afrique du Sud dépassaient ses importations de 8,16 milliards de dollars, soit un excédent commercial.
Exportations de biens de l'Afrique du Sud par catégorie, 2025
Exportations de biens, 2025: 117 Md $US
En 2025, la première catégorie des exportations de biens de l'Afrique du Sud était « pétrole, gaz, minerais et autres matières premières », avec 26,4 %, suivie de « machines, électronique et véhicules », avec 21,5 %.
Destinations des exportations de biens de l'Afrique du Sud : les 10 premières, 2025
| Rang | Pays | Exportations de biens | Part | |
|---|---|---|---|---|
| 1 |
 Chine |
12,8 Md $US | 11 % | vs Chine |
| 2 |
 Allemagne |
9,21 Md $US | 7,89 % | |
| 3 |
 États-Unis |
8,27 Md $US | 7,09 % | vs USA |
| 4 |
 Japon |
5,49 Md $US | 4,7 % | |
| 5 |
 Royaume-Uni |
5,40 Md $US | 4,62 % | |
| 6 |
 Mozambique |
5,27 Md $US | 4,51 % | vs Mozambique |
| 7 |
 Inde |
4,70 Md $US | 4,02 % | vs Inde |
| 8 |
 Pays-Bas |
4,30 Md $US | 3,68 % | |
| 9 |
 Namibie |
4,15 Md $US | 3,56 % | |
| 10 |
 Belgique |
4,14 Md $US | 3,55 % | vs Belgique |
| Autres partenaires et non précisés | 53,0 Md $US | 45,4 % |
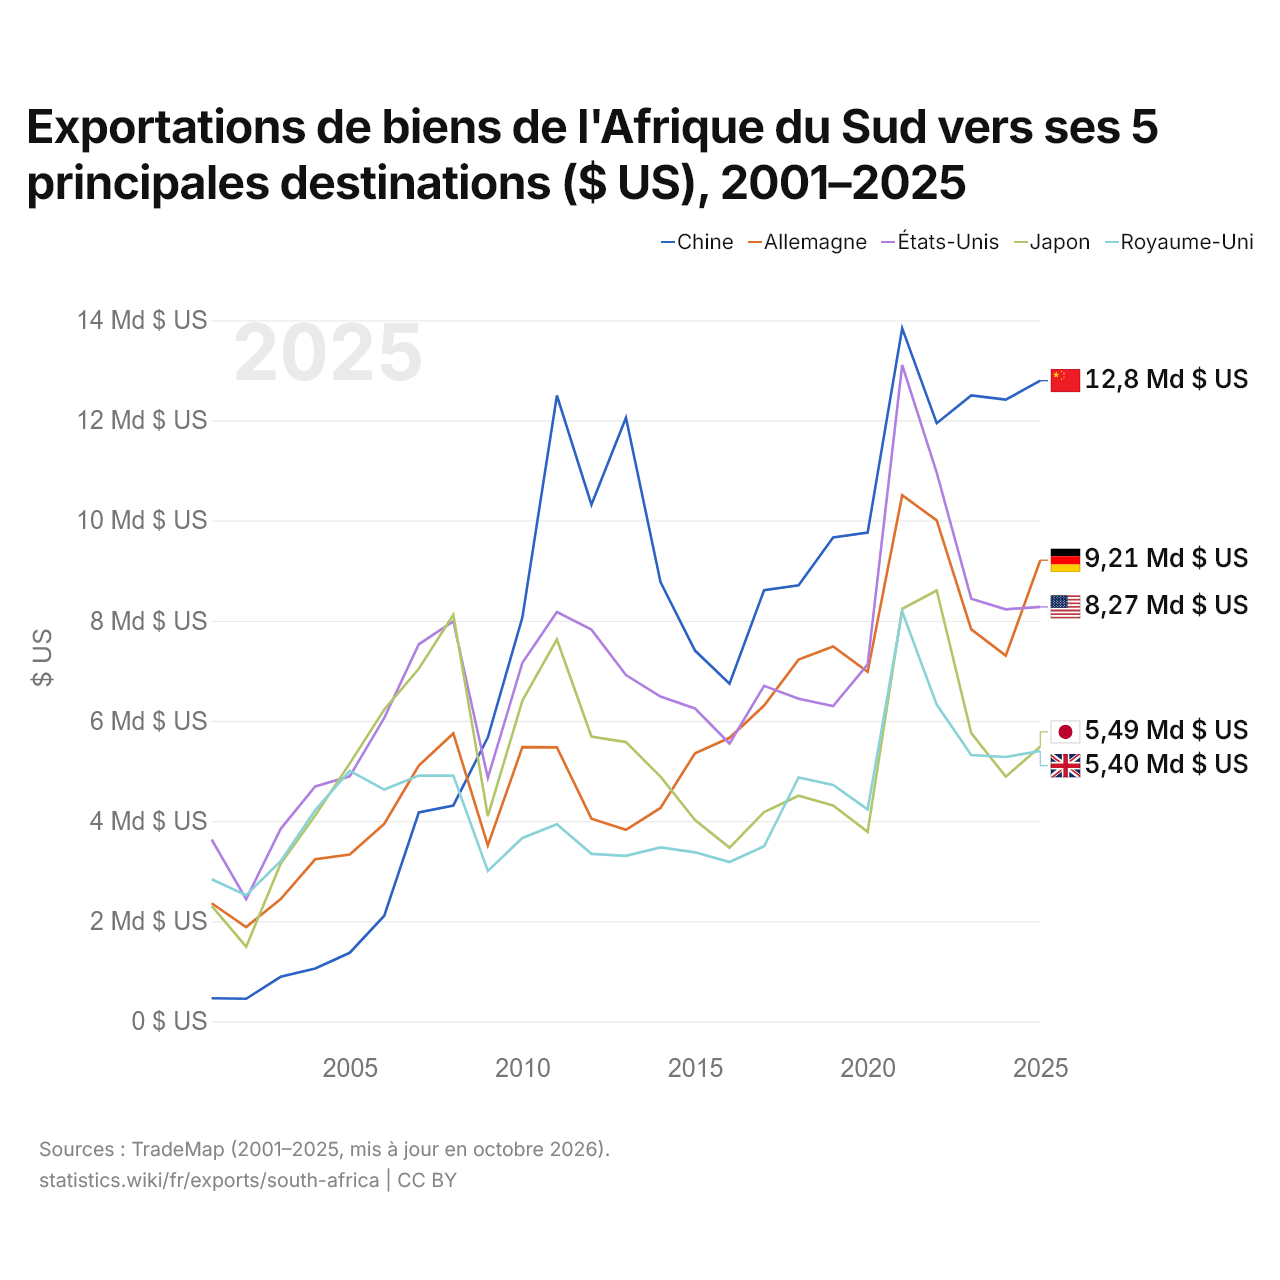
Exportations de biens de l'Afrique du Sud vers ses 5 principales destinations ($ US), 2001–2025
| Année | $ US | ||||
|---|---|---|---|---|---|
| Chine | Allemagne | États-Unis | Japon | Royaume-Uni | |
| 2025 | 12 792 124 000 $ US | 9 206 296 000 $ US | 8 274 948 000 $ US | 5 486 001 000 $ US | 5 396 969 000 $ US |
| 2024 | 12 412 903 000 $ US | 7 300 666 000 $ US | 8 227 140 000 $ US | 4 884 952 000 $ US | 5 278 508 000 $ US |
| 2023 | 12 498 467 000 $ US | 7 827 493 000 $ US | 8 438 060 000 $ US | 5 755 462 000 $ US | 5 316 362 000 $ US |
| 2022 | 11 942 859 000 $ US | 10 001 405 000 $ US | 10 955 729 000 $ US | 8 601 491 000 $ US | 6 323 841 000 $ US |
| 2021 | 13 839 764 000 $ US | 10 506 115 000 $ US | 13 105 430 000 $ US | 8 236 937 000 $ US | 8 182 961 000 $ US |
| 2020 | 9 758 899 000 $ US | 6 979 290 000 $ US | 7 127 511 000 $ US | 3 784 090 000 $ US | 4 230 960 000 $ US |
| 2019 | 9 659 694 000 $ US | 7 484 849 000 $ US | 6 295 901 000 $ US | 4 309 142 000 $ US | 4 721 032 000 $ US |
| 2018 | 8 706 032 000 $ US | 7 222 361 000 $ US | 6 440 248 000 $ US | 4 503 693 000 $ US | 4 869 005 000 $ US |
| 2017 | 8 608 962 000 $ US | 6 305 625 000 $ US | 6 698 536 000 $ US | 4 176 767 000 $ US | 3 494 174 000 $ US |
| 2016 | 6 742 878 000 $ US | 5 661 691 000 $ US | 5 546 070 000 $ US | 3 467 404 000 $ US | 3 181 681 000 $ US |
| 2015 | 7 403 169 000 $ US | 5 353 640 000 $ US | 6 247 195 000 $ US | 4 018 105 000 $ US | 3 374 491 000 $ US |
| 2014 | 8 772 195 000 $ US | 4 260 352 000 $ US | 6 483 538 000 $ US | 4 885 580 000 $ US | 3 472 594 000 $ US |
| 2013 | 12 053 895 000 $ US | 3 824 369 000 $ US | 6 913 630 000 $ US | 5 574 971 000 $ US | 3 302 742 000 $ US |
| 2012 | 10 316 258 000 $ US | 4 046 768 000 $ US | 7 820 345 000 $ US | 5 686 868 000 $ US | 3 344 329 000 $ US |
| 2011 | 12 495 976 000 $ US | 5 470 434 000 $ US | 8 173 523 000 $ US | 7 625 111 000 $ US | 3 936 486 000 $ US |
| 2010 | 8 066 345 000 $ US | 5 476 354 000 $ US | 7 158 562 000 $ US | 6 405 002 000 $ US | 3 662 360 000 $ US |
| 2009 | 5 670 123 000 $ US | 3 512 736 000 $ US | 4 859 695 000 $ US | 4 096 141 000 $ US | 3 002 064 000 $ US |
| 2008 | 4 309 780 000 $ US | 5 748 890 000 $ US | 7 987 446 000 $ US | 8 119 609 000 $ US | 4 905 860 000 $ US |
| 2007 | 4 169 608 000 $ US | 5 106 030 000 $ US | 7 528 705 000 $ US | 7 039 332 000 $ US | 4 907 275 000 $ US |
| 2006 | 2 108 757 000 $ US | 3 944 251 000 $ US | 6 058 239 000 $ US | 6 226 977 000 $ US | 4 627 716 000 $ US |
| 2005 | 1 368 724 000 $ US | 3 329 696 000 $ US | 4 893 176 000 $ US | 5 149 334 000 $ US | 5 000 163 000 $ US |
| 2004 | 1 055 746 000 $ US | 3 236 553 000 $ US | 4 689 548 000 $ US | 4 110 387 000 $ US | 4 215 465 000 $ US |
| 2003 | 889 148 000 $ US | 2 439 814 000 $ US | 3 844 229 000 $ US | 3 147 713 000 $ US | 3 197 496 000 $ US |
| 2002 | 450 298 000 $ US | 1 883 689 000 $ US | 2 439 154 000 $ US | 1 490 186 000 $ US | 2 519 194 000 $ US |
| 2001 | 461 312 000 $ US | 2 357 854 000 $ US | 3 631 452 000 $ US | 2 306 464 000 $ US | 2 836 834 000 $ US |
En 2025, les exportations de biens s'élevaient à 12,8 milliards de dollars vers la Chine, 9,21 milliards de dollars vers l'Allemagne, 8,27 milliards de dollars vers les États-Unis, 5,49 milliards de dollars vers le Japon et 5,4 milliards de dollars vers le Royaume-Uni. Le premier rang des cinq destinations de l'Afrique du Sud est occupé par la Chine depuis 2009. Le changement le plus récent dans leur ordre remonte à 2025, quand les exportations de l'Afrique du Sud vers l'Allemagne ont dépassé celles vers les États-Unis.
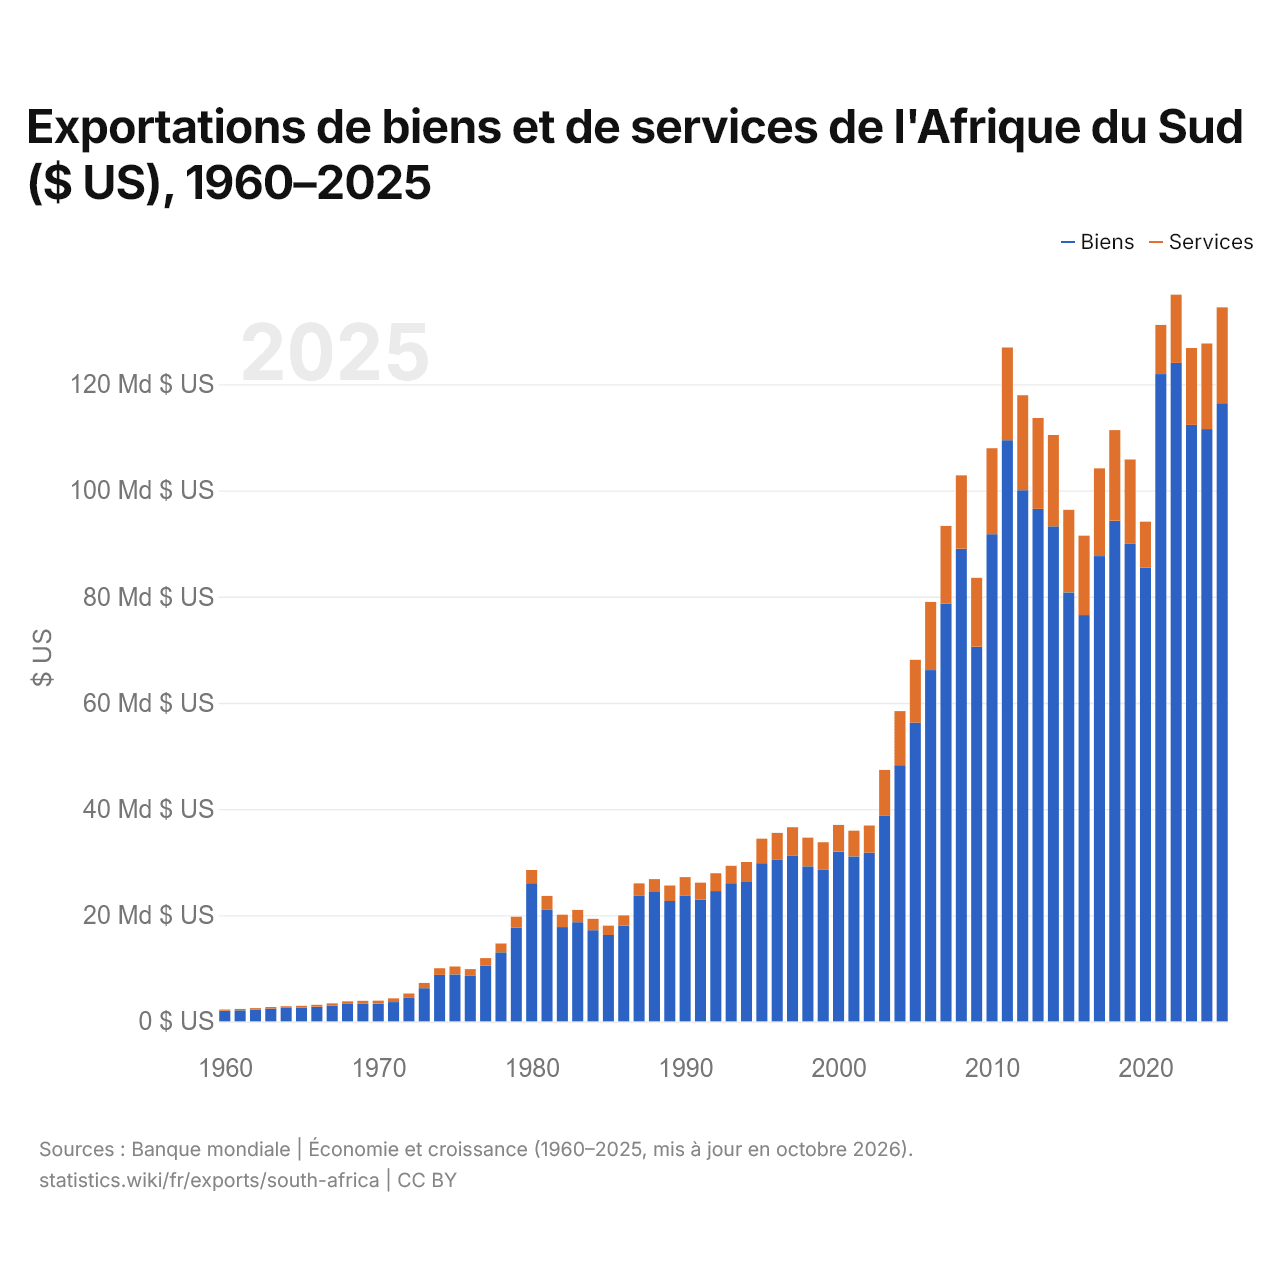
Exportations de biens et de services de l'Afrique du Sud ($ US), 1960–2025
| Année | $ US | |
|---|---|---|
| Biens | Services | |
| 2025 | 116 437 290 623 $ US | 18 050 849 009 $ US |
| 2024 | 111 560 865 799 $ US | 16 114 763 456 $ US |
| 2023 | 112 363 421 321 $ US | 14 456 428 200 $ US |
| 2022 | 124 028 226 501 $ US | 12 847 944 763 $ US |
| 2021 | 121 921 158 283 $ US | 9 257 363 925 $ US |
| 2020 | 85 470 584 218 $ US | 8 656 535 032 $ US |
| 2019 | 89 927 265 207 $ US | 15 906 153 468 $ US |
| 2018 | 94 289 618 799 $ US | 17 083 256 002 $ US |
| 2017 | 87 638 027 809 $ US | 16 533 979 464 $ US |
| 2016 | 76 517 462 442 $ US | 14 965 188 304 $ US |
| 2015 | 80 790 790 821 $ US | 15 555 730 035 $ US |
| 2014 | 93 246 684 684 $ US | 17 198 249 747 $ US |
| 2013 | 96 524 479 548 $ US | 17 119 749 869 $ US |
| 2012 | 100 042 921 408 $ US | 17 892 008 067 $ US |
| 2011 | 109 454 328 330 $ US | 17 480 710 045 $ US |
| 2010 | 91 760 122 455 $ US | 16 193 533 644 $ US |
| 2009 | 70 556 077 152 $ US | 12 975 619 669 $ US |
| 2008 | 89 030 761 369 $ US | 13 809 654 227 $ US |
| 2007 | 78 691 590 488 $ US | 14 624 569 127 $ US |
| 2006 | 66 157 547 302 $ US | 12 841 720 653 $ US |
| 2005 | 56 261 041 953 $ US | 11 828 676 645 $ US |
| 2004 | 48 236 927 418 $ US | 10 199 098 424 $ US |
| 2003 | 38 700 083 789 $ US | 8 658 809 340 $ US |
| 2002 | 31 772 111 972 $ US | 5 110 273 842 $ US |
| 2001 | 31 063 633 958 $ US | 4 845 268 897 $ US |
| 2000 | 31 949 744 260 $ US | 5 045 602 095 $ US |
| 1999 | 28 533 997 382 $ US | 5 209 872 260 $ US |
| 1998 | 29 198 775 558 $ US | 5 395 955 955 $ US |
| 1997 | 31 166 601 219 $ US | 5 394 482 015 $ US |
| 1996 | 30 426 457 917 $ US | 5 068 660 328 $ US |
| 1995 | 29 783 450 232 $ US | 4 618 686 900 $ US |
| 1994 | 26 250 591 783 $ US | 3 750 650 321 $ US |
| 1993 | 26 017 308 970 $ US | 3 277 558 510 $ US |
| 1992 | 24 539 919 850 $ US | 3 353 351 076 $ US |
| 1991 | 22 934 999 183 $ US | 3 191 023 922 $ US |
| 1990 | 23 726 268 780 $ US | 3 433 970 211 $ US |
| 1989 | 22 676 225 044 $ US | 2 915 349 537 $ US |
| 1988 | 24 367 871 050 $ US | 2 430 228 998 $ US |
| 1987 | 23 626 305 610 $ US | 2 351 790 105 $ US |
| 1986 | 18 032 550 278 $ US | 1 927 389 571 $ US |
| 1985 | 16 263 926 782 $ US | 1 766 865 631 $ US |
| 1984 | 17 170 850 801 $ US | 2 131 602 855 $ US |
| 1983 | 18 684 414 752 $ US | 2 295 172 041 $ US |
| 1982 | 17 753 330 396 $ US | 2 328 616 200 $ US |
| 1981 | 21 008 683 395 $ US | 2 612 373 641 $ US |
| 1980 | 26 013 394 351 $ US | 2 488 257 605 $ US |
| 1979 | 17 690 058 601 $ US | 2 029 111 574 $ US |
| 1978 | 12 993 849 989 $ US | 1 676 699 999 $ US |
| 1977 | 10 494 899 991 $ US | 1 419 099 999 $ US |
| 1976 | 8 559 449 993 $ US | 1 281 099 999 $ US |
| 1975 | 8 839 265 941 $ US | 1 483 948 140 $ US |
| 1974 | 8 747 567 732 $ US | 1 249 094 465 $ US |
| 1973 | 6 239 348 867 $ US | 991 571 230 $ US |
| 1972 | 4 511 200 021 $ US | 743 726 532 $ US |
| 1971 | 3 622 301 658 $ US | 703 190 505 $ US |
| 1970 | 3 316 598 675 $ US | 587 999 765 $ US |
| 1969 | 3 352 998 660 $ US | 506 799 797 $ US |
| 1968 | 3 291 398 685 $ US | 468 999 813 $ US |
| 1967 | 2 958 198 818 $ US | 426 999 829 $ US |
| 1966 | 2 745 398 903 $ US | 377 999 849 $ US |
| 1965 | 2 585 798 967 $ US | 327 599 869 $ US |
| 1964 | 2 536 798 986 $ US | 309 399 876 $ US |
| 1963 | 2 393 999 043 $ US | 302 399 879 $ US |
| 1962 | 2 230 199 109 $ US | 268 799 893 $ US |
| 1961 | 2 080 399 169 $ US | 257 599 897 $ US |
| 1960 | 1 987 999 206 $ US | 250 599 900 $ US |
En 2025, les exportations de biens de l'Afrique du Sud s'élevaient à 116 milliards de dollars et celles de services à 18,1 milliards de dollars ; les services représentaient 13,4 % du total, contre 11,2 % en 1960.
L'Afrique du Sud dans le classement mondial des exportations, 2025







Exportations de biens et services de l'Afrique du Sud, % du PIB, 1960–2025
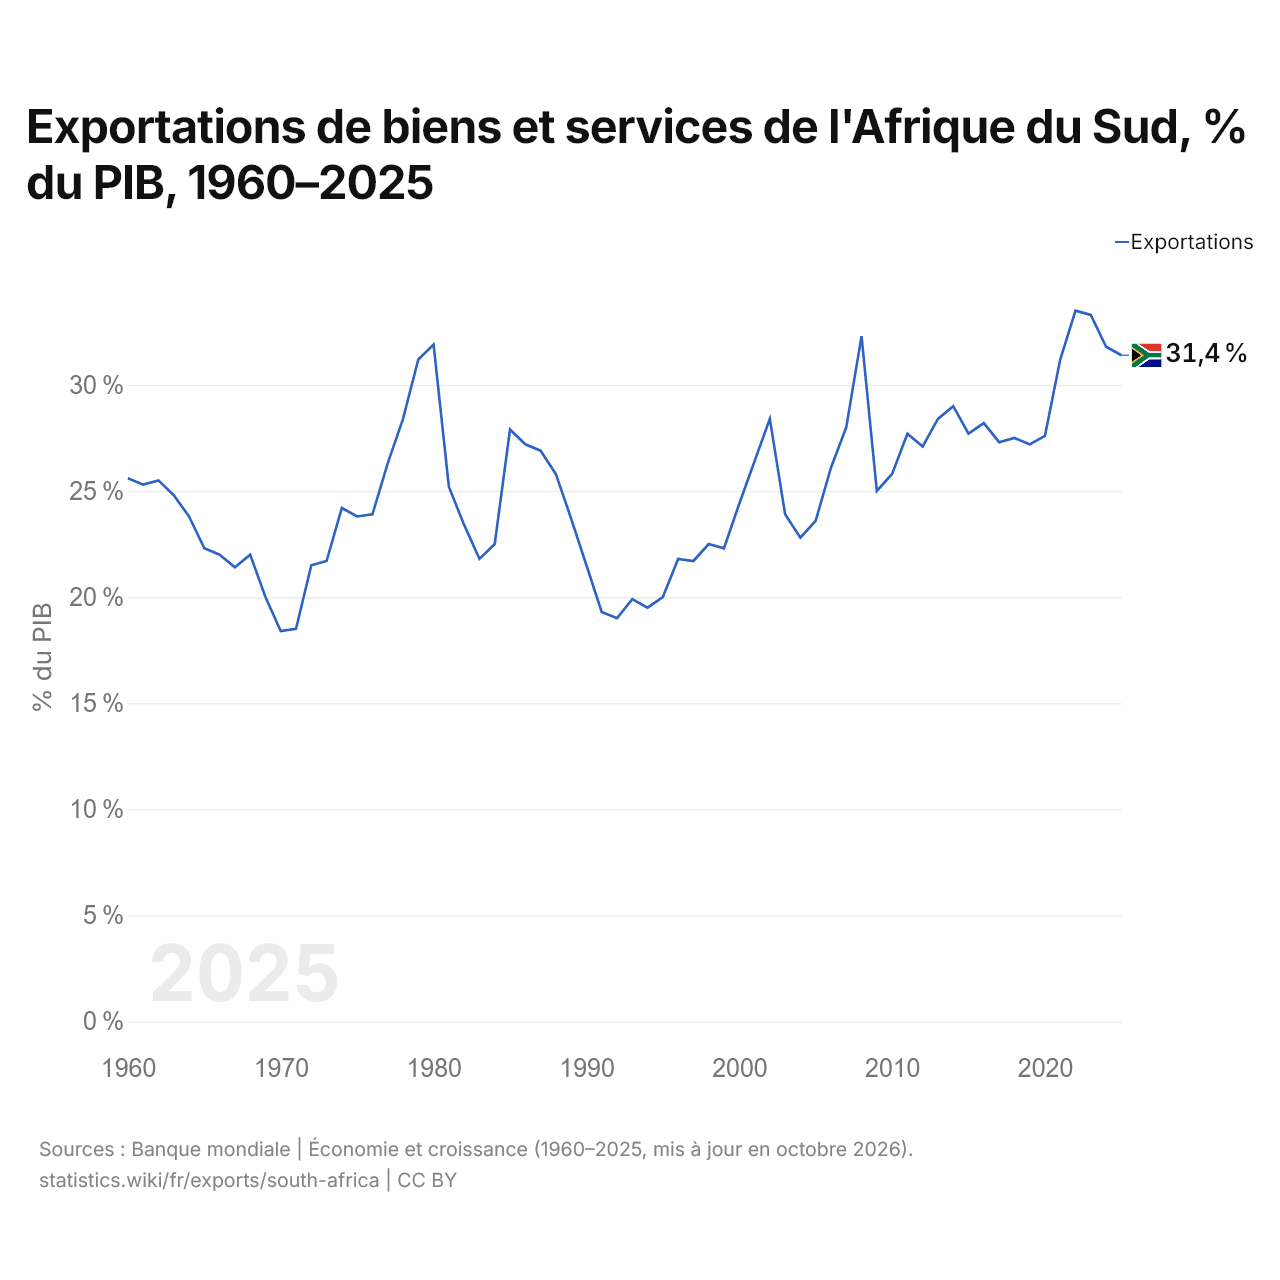
En 2025, les exportations de biens et services de l'Afrique du Sud équivalaient à 31,4 % de son PIB, contre 25,6 % en 1960. La part la plus élevée a été de 33,5 %, en 2022.
Comparer les exportations de l'Afrique du Sud avec celles d'autres pays
Sources :
- Banque mondiale | Économie et croissance (1960–2025, mis à jour en octobre 2026)
- TradeMap (2001–2025, mis à jour en octobre 2026)
Creative Commons Attribution (CC BY) : vous pouvez copier, partager, adapter et réutiliser ce contenu, y compris à des fins commerciales, à condition de citer statistics.wiki et d’indiquer les modifications apportées. Les sources citées ci-dessus peuvent avoir leurs propres conditions de licence.