
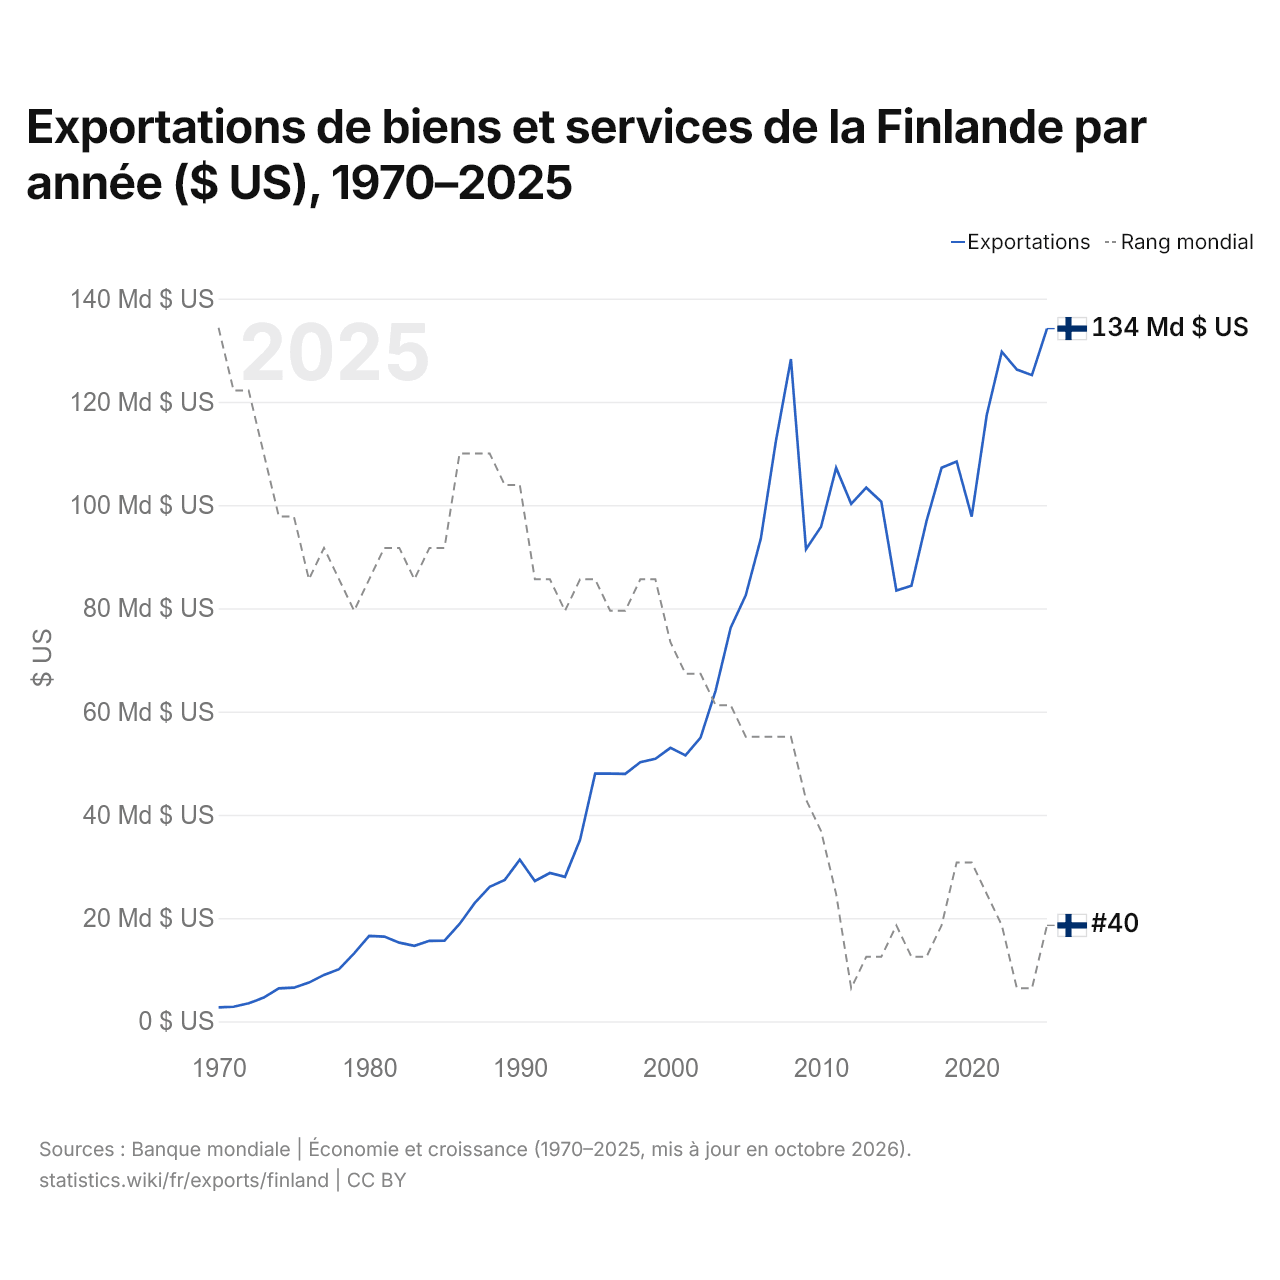
Exportations de biens et services de la Finlande par année ($ US), 1970–2025
| Année | $ US | Rang mondial |
|---|---|---|
| Exportations | Rang mondial | |
| 2025 | 134 192 277 448 $ US | #40 |
| 2024 | 125 177 301 211 $ US | #42 |
| 2023 | 126 248 924 941 $ US | #42 |
| 2022 | 129 714 531 245 $ US | #40 |
| 2021 | 117 459 122 934 $ US | #39 |
| 2020 | 97 778 840 103 $ US | #38 |
| 2019 | 108 456 929 459 $ US | #38 |
| 2018 | 107 217 678 991 $ US | #40 |
| 2017 | 96 883 717 056 $ US | #41 |
| 2016 | 84 368 155 261 $ US | #41 |
| 2015 | 83 446 464 504 $ US | #40 |
| 2014 | 100 656 518 925 $ US | #41 |
| 2013 | 103 378 051 936 $ US | #41 |
| 2012 | 100 235 357 814 $ US | #42 |
| 2011 | 107 209 785 535 $ US | #39 |
| 2010 | 95 813 520 650 $ US | #37 |
| 2009 | 91 464 252 097 $ US | #36 |
| 2008 | 128 286 645 762 $ US | #34 |
| 2007 | 112 360 012 523 $ US | #34 |
| 2006 | 93 509 466 784 $ US | #34 |
| 2005 | 82 514 287 315 $ US | #34 |
| 2004 | 76 257 431 519 $ US | #33 |
| 2003 | 64 062 137 649 $ US | #33 |
| 2002 | 54 947 289 188 $ US | #32 |
| 2001 | 51 507 654 130 $ US | #32 |
| 2000 | 52 967 332 461 $ US | #31 |
| 1999 | 50 865 246 751 $ US | #29 |
| 1998 | 50 182 465 510 $ US | #29 |
| 1997 | 47 944 107 204 $ US | #30 |
| 1996 | 47 988 609 889 $ US | #30 |
| 1995 | 47 992 919 390 $ US | #29 |
| 1994 | 35 158 793 398 $ US | #29 |
| 1993 | 27 996 252 732 $ US | #30 |
| 1992 | 28 745 686 222 $ US | #29 |
| 1991 | 27 176 885 752 $ US | #29 |
| 1990 | 31 323 277 873 $ US | #26 |
| 1989 | 27 400 581 959 $ US | #26 |
| 1988 | 26 071 073 205 $ US | #25 |
| 1987 | 22 897 335 317 $ US | #25 |
| 1986 | 18 858 784 893 $ US | #25 |
| 1985 | 15 638 910 207 $ US | #28 |
| 1984 | 15 594 578 552 $ US | #28 |
| 1983 | 14 631 725 021 $ US | #29 |
| 1982 | 15 244 850 130 $ US | #28 |
| 1981 | 16 409 479 195 $ US | #28 |
| 1980 | 16 534 905 961 $ US | #29 |
| 1979 | 13 152 190 505 $ US | #30 |
| 1978 | 10 101 083 032 $ US | #29 |
| 1977 | 8 995 130 589 $ US | #28 |
| 1976 | 7 499 615 325 $ US | #29 |
| 1975 | 6 523 355 423 $ US | #27 |
| 1974 | 6 381 402 237 $ US | #27 |
| 1973 | 4 596 304 652 $ US | #25 |
| 1972 | 3 487 225 409 $ US | #23 |
| 1971 | 2 827 196 647 $ US | #23 |
| 1970 | 2 711 046 149 $ US | #21 |
En 2025, les exportations de biens et services de la Finlande s'élevaient à 134 milliards de dollars, contre 2,71 milliards de dollars en 1970. Elles se classaient au 40e rang mondial, en hausse par rapport au 42e rang en 2024. Leur meilleur rang a été le 21e, occupé pour la dernière fois en 1970.
En 2025, les exportations de biens et services de la Finlande étaient les 21es plus élevées de 41 pays situés en Europe. Les importations de biens et services de la Finlande s'élevaient à 130 milliards de dollars en 2025, au 42e rang mondial. En 2025, les exportations de la Finlande dépassaient ses importations de 3,99 milliards de dollars, soit un excédent commercial.
Exportations de biens de la Finlande par catégorie, 2025
Exportations de biens, 2025: 84,1 Md $US
En 2025, la première catégorie des exportations de biens de la Finlande était « machines, électronique et véhicules », avec 36,8 %, suivie de « bois, papier et imprimés », avec 16,6 %.
Destinations des exportations de biens de la Finlande : les 10 premières, 2025
| Rang | Pays | Exportations de biens | Part | |
|---|---|---|---|---|
| 1 |
 Suède |
9,50 Md $US | 11,3 % | vs Suède |
| 2 |
 États-Unis |
8,74 Md $US | 10,4 % | |
| 3 |
 Allemagne |
8,22 Md $US | 9,78 % | vs Allemagne |
| 4 |
 Pays-Bas |
6,28 Md $US | 7,47 % | vs Pays-Bas |
| 5 |
 Chine |
3,62 Md $US | 4,3 % | |
| 6 |
 Pologne |
3,17 Md $US | 3,77 % | vs Pologne |
| 7 |
 Royaume-Uni |
2,95 Md $US | 3,51 % | |
| 8 |
 Norvège |
2,78 Md $US | 3,3 % | vs Norvège |
| 9 |
 Belgique |
2,75 Md $US | 3,27 % | vs Belgique |
| 10 |
 Estonie |
2,70 Md $US | 3,22 % | vs Estonie |
| Autres partenaires et non précisés | 33,4 Md $US | 39,7 % |
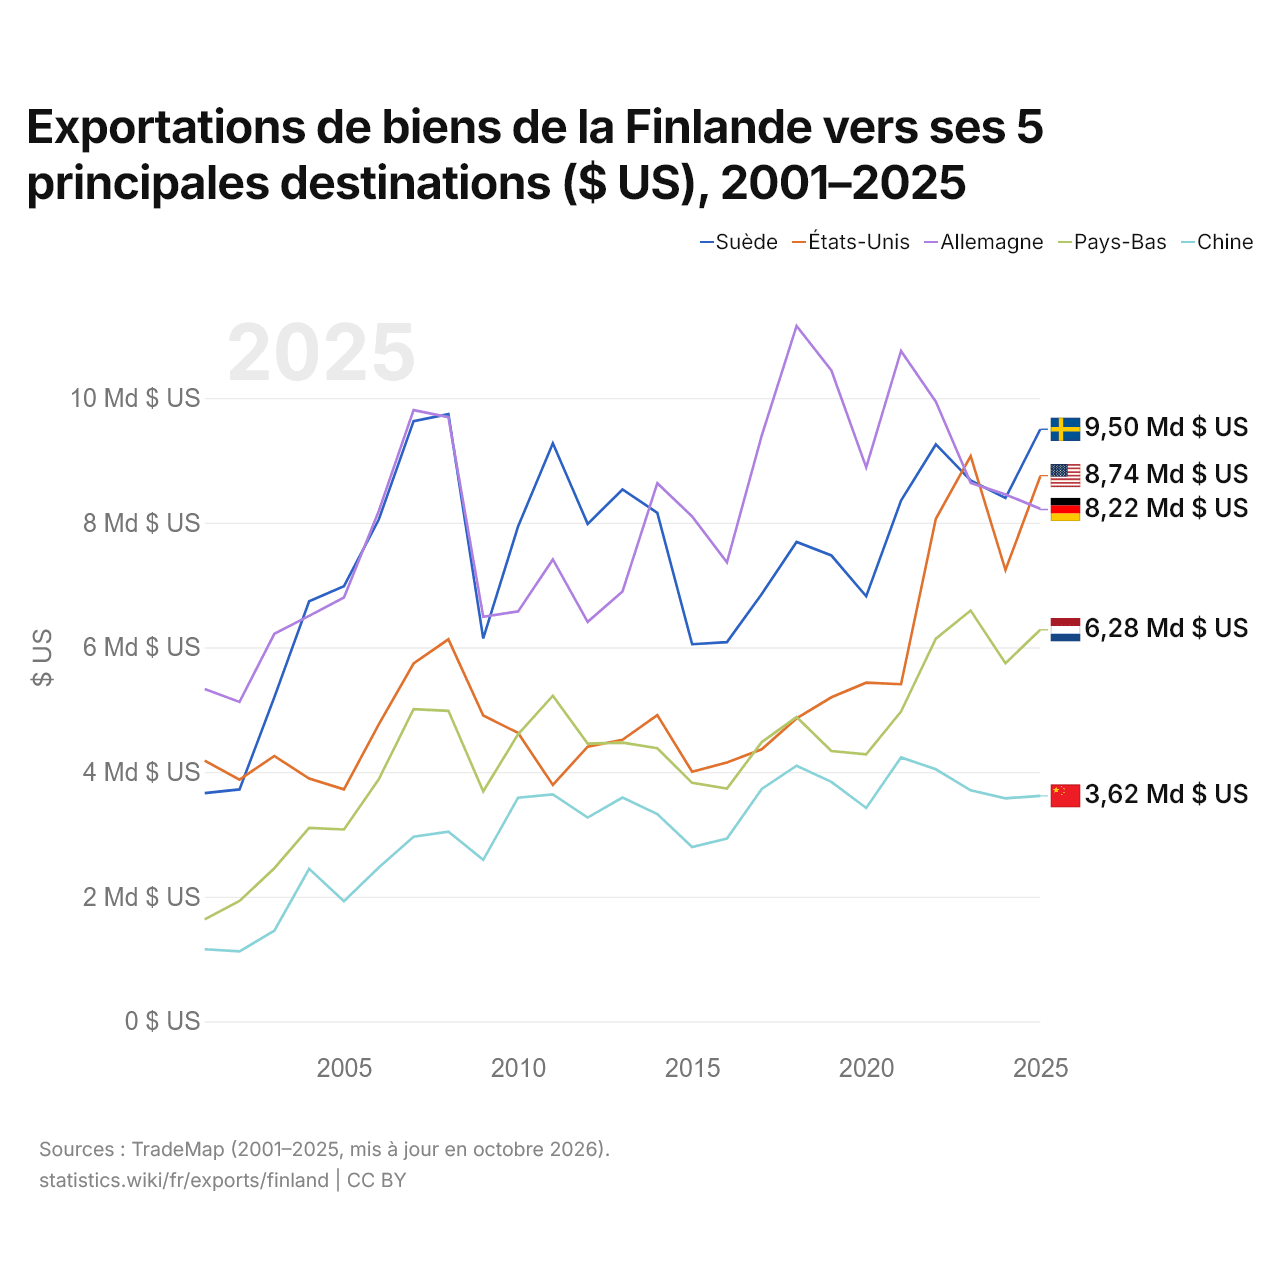
Exportations de biens de la Finlande vers ses 5 principales destinations ($ US), 2001–2025
| Année | $ US | ||||
|---|---|---|---|---|---|
| Suède | États-Unis | Allemagne | Pays-Bas | Chine | |
| 2025 | 9 498 683 000 $ US | 8 743 702 000 $ US | 8 222 205 000 $ US | 6 281 715 000 $ US | 3 617 096 000 $ US |
| 2024 | 8 395 786 000 $ US | 7 239 826 000 $ US | 8 452 571 000 $ US | 5 744 442 000 $ US | 3 578 377 000 $ US |
| 2023 | 8 677 483 000 $ US | 9 069 265 000 $ US | 8 638 343 000 $ US | 6 589 873 000 $ US | 3 705 636 000 $ US |
| 2022 | 9 255 261 000 $ US | 8 062 589 000 $ US | 9 941 670 000 $ US | 6 138 473 000 $ US | 4 043 216 000 $ US |
| 2021 | 8 353 450 000 $ US | 5 408 126 000 $ US | 10 755 514 000 $ US | 4 968 811 000 $ US | 4 234 888 000 $ US |
| 2020 | 6 818 134 000 $ US | 5 433 559 000 $ US | 8 886 352 000 $ US | 4 283 623 000 $ US | 3 422 534 000 $ US |
| 2019 | 7 473 357 000 $ US | 5 199 637 000 $ US | 10 440 898 000 $ US | 4 336 927 000 $ US | 3 842 829 000 $ US |
| 2018 | 7 691 324 000 $ US | 4 859 967 000 $ US | 11 156 093 000 $ US | 4 881 720 000 $ US | 4 100 577 000 $ US |
| 2017 | 6 855 168 000 $ US | 4 363 856 000 $ US | 9 398 924 000 $ US | 4 479 964 000 $ US | 3 728 816 000 $ US |
| 2016 | 6 083 208 000 $ US | 4 153 045 000 $ US | 7 363 687 000 $ US | 3 734 389 000 $ US | 2 933 649 000 $ US |
| 2015 | 6 049 931 000 $ US | 4 003 918 000 $ US | 8 099 890 000 $ US | 3 825 796 000 $ US | 2 796 368 000 $ US |
| 2014 | 8 158 534 000 $ US | 4 913 739 000 $ US | 8 633 785 000 $ US | 4 381 790 000 $ US | 3 326 035 000 $ US |
| 2013 | 8 532 189 000 $ US | 4 515 793 000 $ US | 6 896 707 000 $ US | 4 471 805 000 $ US | 3 590 391 000 $ US |
| 2012 | 7 980 382 000 $ US | 4 406 846 000 $ US | 6 408 619 000 $ US | 4 455 427 000 $ US | 3 269 298 000 $ US |
| 2011 | 9 274 132 000 $ US | 3 793 057 000 $ US | 7 410 033 000 $ US | 5 223 948 000 $ US | 3 640 425 000 $ US |
| 2010 | 7 938 098 000 $ US | 4 627 210 000 $ US | 6 576 539 000 $ US | 4 604 518 000 $ US | 3 586 936 000 $ US |
| 2009 | 6 142 904 000 $ US | 4 906 954 000 $ US | 6 491 008 000 $ US | 3 689 759 000 $ US | 2 591 088 000 $ US |
| 2008 | 9 741 141 000 $ US | 6 128 781 000 $ US | 9 692 068 000 $ US | 4 981 841 000 $ US | 3 044 208 000 $ US |
| 2007 | 9 629 543 000 $ US | 5 740 607 000 $ US | 9 806 281 000 $ US | 5 007 204 000 $ US | 2 961 719 000 $ US |
| 2006 | 8 050 438 000 $ US | 4 763 606 000 $ US | 8 187 571 000 $ US | 3 883 359 000 $ US | 2 468 972 000 $ US |
| 2005 | 6 981 888 000 $ US | 3 721 668 000 $ US | 6 800 766 000 $ US | 3 077 685 000 $ US | 1 927 224 000 $ US |
| 2004 | 6 739 515 000 $ US | 3 893 857 000 $ US | 6 505 021 000 $ US | 3 102 916 000 $ US | 2 446 727 000 $ US |
| 2003 | 5 197 705 000 $ US | 4 257 280 000 $ US | 6 217 676 000 $ US | 2 455 665 000 $ US | 1 452 948 000 $ US |
| 2002 | 3 720 891 000 $ US | 3 877 749 000 $ US | 5 123 508 000 $ US | 1 930 738 000 $ US | 1 121 489 000 $ US |
| 2001 | 3 660 099 000 $ US | 4 182 412 000 $ US | 5 331 358 000 $ US | 1 636 234 000 $ US | 1 157 044 000 $ US |
En 2025, les exportations de biens s'élevaient à 9,5 milliards de dollars vers la Suède, 8,74 milliards de dollars vers les États-Unis, 8,22 milliards de dollars vers l'Allemagne, 6,28 milliards de dollars vers les Pays-Bas et 3,62 milliards de dollars vers la Chine. Le changement le plus récent dans leur ordre remonte à 2025, quand les exportations de la Finlande vers les États-Unis ont dépassé celles vers l'Allemagne.
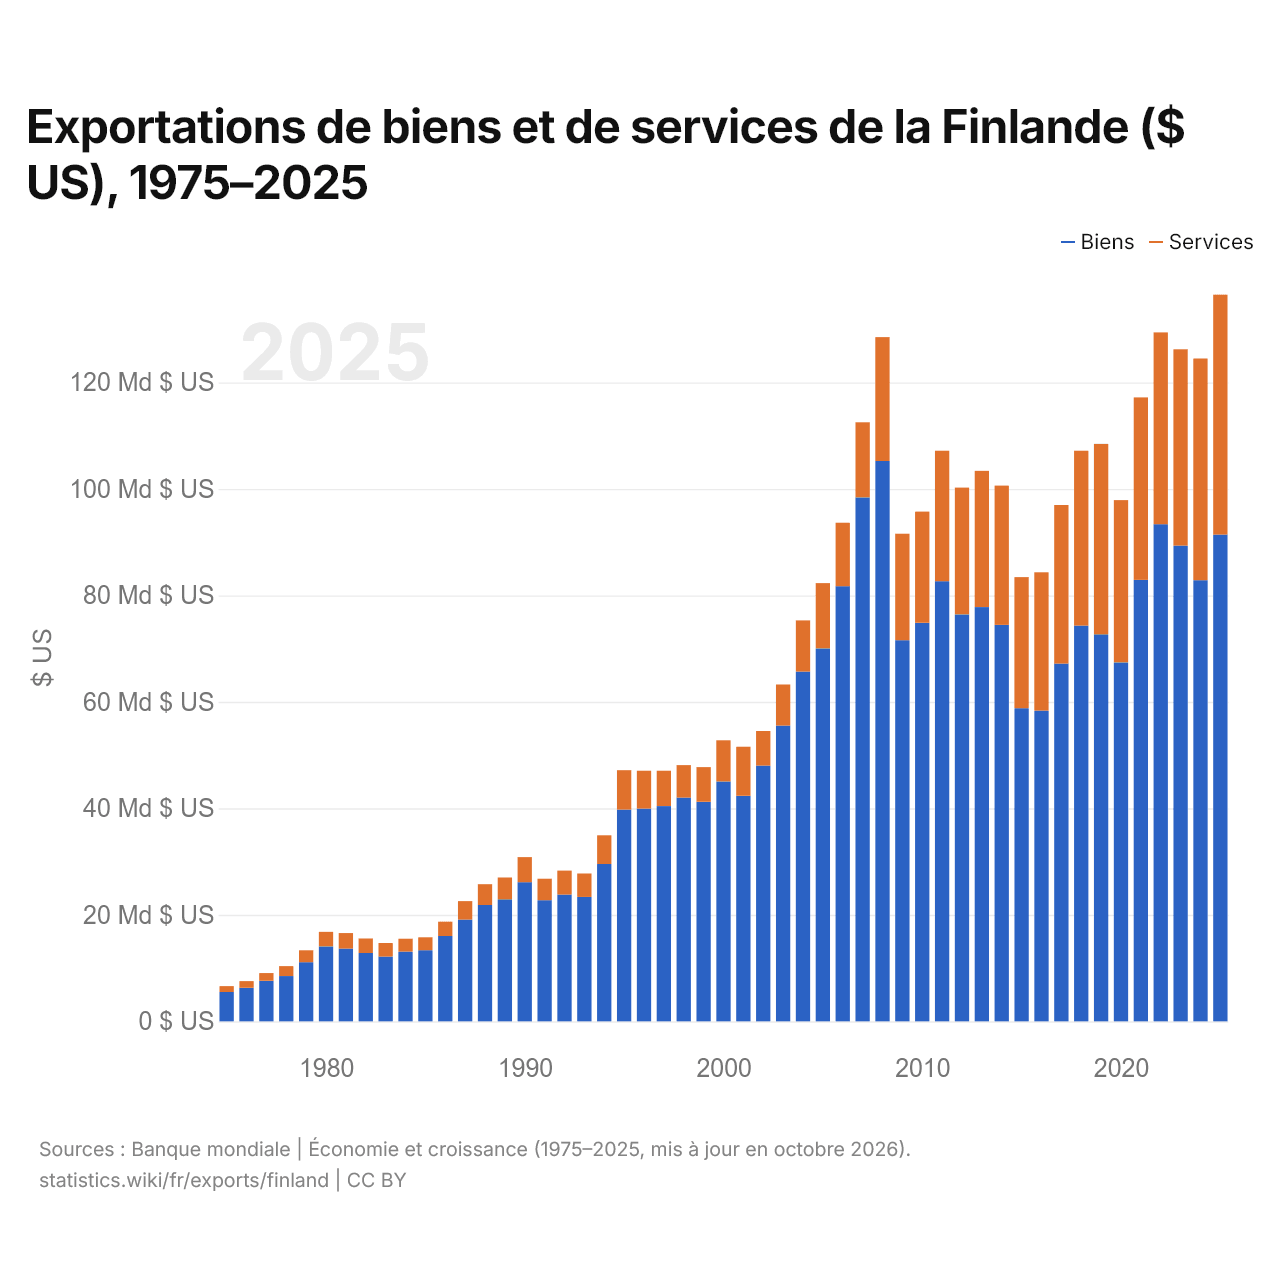
Exportations de biens et de services de la Finlande ($ US), 1975–2025
| Année | $ US | |
|---|---|---|
| Biens | Services | |
| 2025 | 91 401 121 103 $ US | 45 079 022 318 $ US |
| 2024 | 82 858 731 159 $ US | 41 625 238 916 $ US |
| 2023 | 89 340 983 280 $ US | 36 888 058 513 $ US |
| 2022 | 93 361 956 493 $ US | 36 025 933 016 $ US |
| 2021 | 82 912 145 159 $ US | 34 268 110 193 $ US |
| 2020 | 67 416 386 738 $ US | 30 477 168 678 $ US |
| 2019 | 72 690 213 780 $ US | 35 760 577 572 $ US |
| 2018 | 74 302 405 231 $ US | 32 860 197 725 $ US |
| 2017 | 67 198 318 454 $ US | 29 772 781 071 $ US |
| 2016 | 58 351 635 009 $ US | 25 986 185 605 $ US |
| 2015 | 58 806 695 990 $ US | 24 623 758 307 $ US |
| 2014 | 74 459 455 559 $ US | 26 157 718 456 $ US |
| 2013 | 77 796 801 806 $ US | 25 589 973 392 $ US |
| 2012 | 76 423 384 607 $ US | 23 816 454 672 $ US |
| 2011 | 82 652 086 077 $ US | 24 507 345 653 $ US |
| 2010 | 74 850 418 582 $ US | 20 878 908 992 $ US |
| 2009 | 71 590 351 327 $ US | 19 999 314 824 $ US |
| 2008 | 105 243 654 704 $ US | 23 266 922 094 $ US |
| 2007 | 98 404 957 694 $ US | 14 113 936 591 $ US |
| 2006 | 81 721 111 929 $ US | 11 918 413 532 $ US |
| 2005 | 70 041 740 217 $ US | 12 259 607 581 $ US |
| 2004 | 65 704 638 525 $ US | 9 597 429 849 $ US |
| 2003 | 55 564 828 656 $ US | 7 701 405 327 $ US |
| 2002 | 48 006 719 029 $ US | 6 525 241 364 $ US |
| 2001 | 42 362 126 737 $ US | 9 208 012 897 $ US |
| 2000 | 45 051 988 704 $ US | 7 728 149 473 $ US |
| 1999 | 41 228 677 570 $ US | 6 521 059 466 $ US |
| 1998 | 42 040 115 763 $ US | 6 084 310 946 $ US |
| 1997 | 40 426 237 605 $ US | 6 640 256 020 $ US |
| 1996 | 39 959 402 070 $ US | 7 110 706 436 $ US |
| 1995 | 39 785 143 630 $ US | 7 386 271 735 $ US |
| 1994 | 29 544 029 074 $ US | 5 394 941 329 $ US |
| 1993 | 23 366 648 234 $ US | 4 398 782 921 $ US |
| 1992 | 23 815 417 043 $ US | 4 502 167 273 $ US |
| 1991 | 22 760 613 233 $ US | 4 026 603 116 $ US |
| 1990 | 26 139 225 393 $ US | 4 706 455 527 $ US |
| 1989 | 22 921 232 969 $ US | 4 086 711 530 $ US |
| 1988 | 21 851 474 035 $ US | 3 909 942 524 $ US |
| 1987 | 19 107 723 395 $ US | 3 473 252 410 $ US |
| 1986 | 16 030 893 468 $ US | 2 692 512 755 $ US |
| 1985 | 13 351 143 765 $ US | 2 429 280 376 $ US |
| 1984 | 13 086 767 065 $ US | 2 437 835 581 $ US |
| 1983 | 12 172 115 935 $ US | 2 532 190 376 $ US |
| 1982 | 12 841 855 332 $ US | 2 722 980 214 $ US |
| 1981 | 13 661 606 807 $ US | 2 914 881 292 $ US |
| 1980 | 14 069 599 976 $ US | 2 732 767 839 $ US |
| 1979 | 11 099 776 681 $ US | 2 249 253 107 $ US |
| 1978 | 8 503 558 295 $ US | 1 861 299 571 $ US |
| 1977 | 7 609 271 347 $ US | 1 455 386 249 $ US |
| 1976 | 6 294 638 575 $ US | 1 252 979 574 $ US |
| 1975 | 5 508 465 757 $ US | 1 099 882 413 $ US |
En 2025, les exportations de biens de la Finlande s'élevaient à 91,4 milliards de dollars et celles de services à 45,1 milliards de dollars ; les services représentaient 33,0 % du total, contre 16,6 % en 1975.
La Finlande dans le classement mondial des exportations, 2025
| Rang | Pays | Exportations | Part mondiale | |
|---|---|---|---|---|
| 37 |
 Israël |
168 Md $US | 0,48 % | |
| 38 |
 Roumanie |
152 Md $US | 0,44 % | |
| 39 |
 Portugal |
151 Md $US | 0,43 % | |
| 40 |
 Finlande |
134 Md $US | 0,38 % | |
| 41 |
 Afrique du Sud |
134 Md $US | 0,38 % | |
| 42 |
 Slovaquie |
131 Md $US | 0,38 % | |
| 43 |
 Philippines |
129 Md $US | 0,37 % |
Exportations de biens et services de la Finlande, % du PIB, 1970–2025
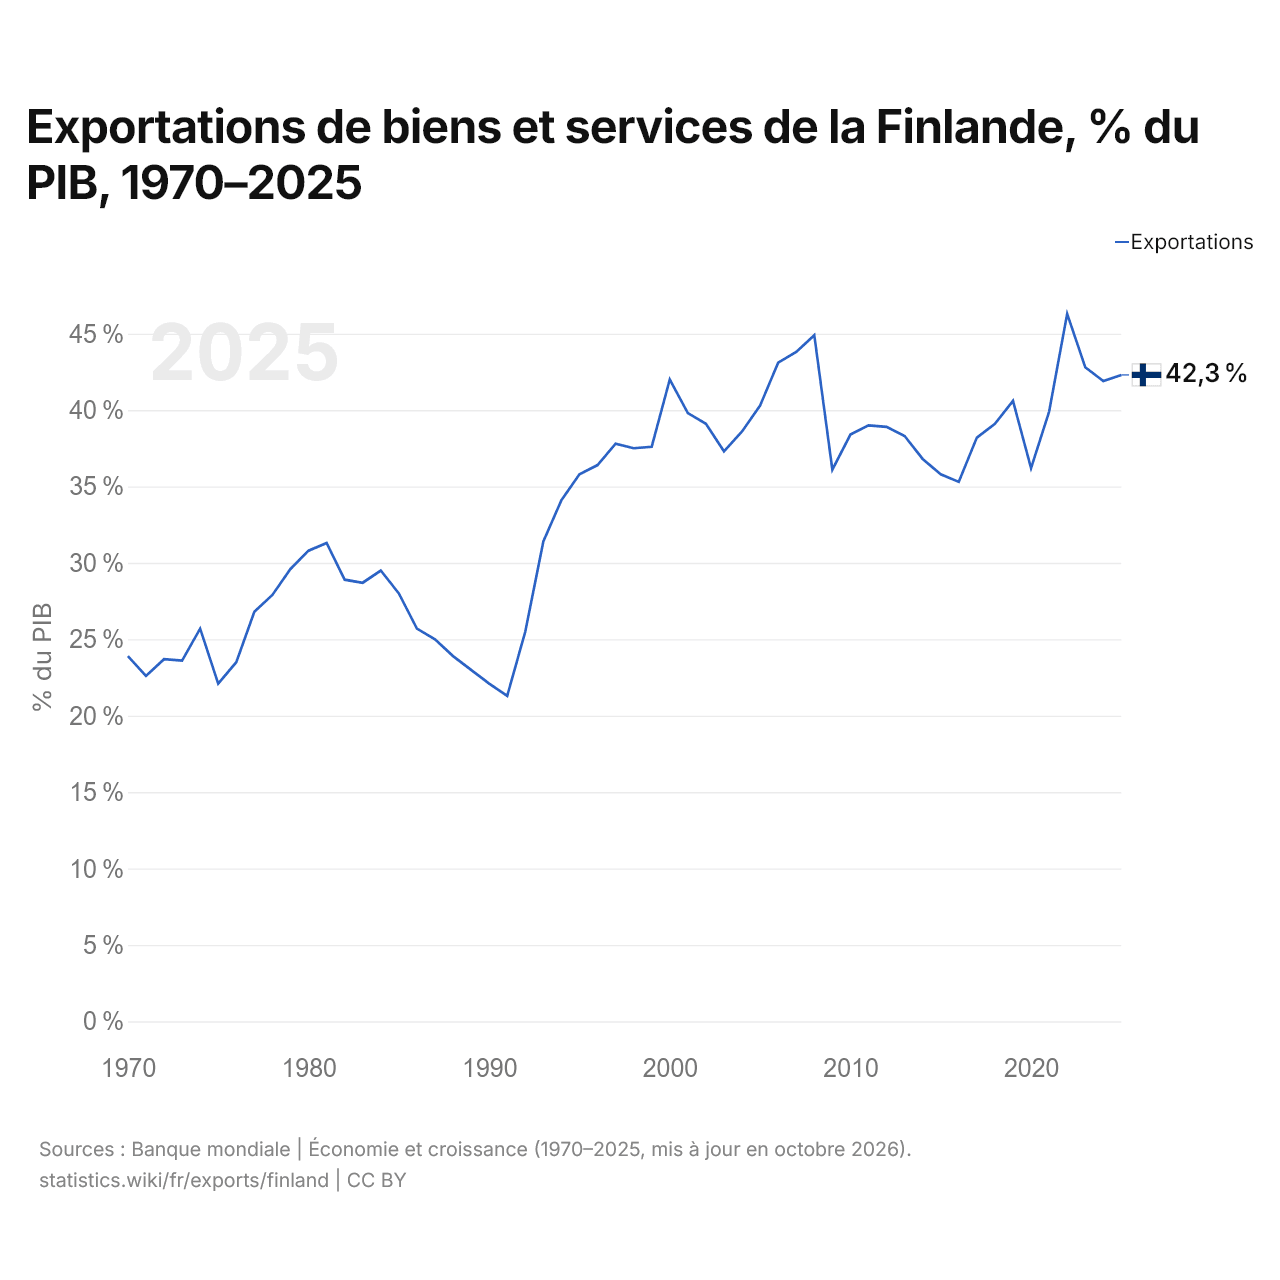
En 2025, les exportations de biens et services de la Finlande équivalaient à 42,3 % de son PIB, contre 23,9 % en 1970. La part la plus élevée a été de 46,3 %, en 2022.
Comparer les exportations de la Finlande avec celles d'autres pays
Sources :
- TradeMap (2001–2025, mis à jour en octobre 2026)
- Banque mondiale | Économie et croissance (1970–2025, mis à jour en octobre 2026)
Creative Commons Attribution (CC BY) : vous pouvez copier, partager, adapter et réutiliser ce contenu, y compris à des fins commerciales, à condition de citer statistics.wiki et d’indiquer les modifications apportées. Les sources citées ci-dessus peuvent avoir leurs propres conditions de licence.