
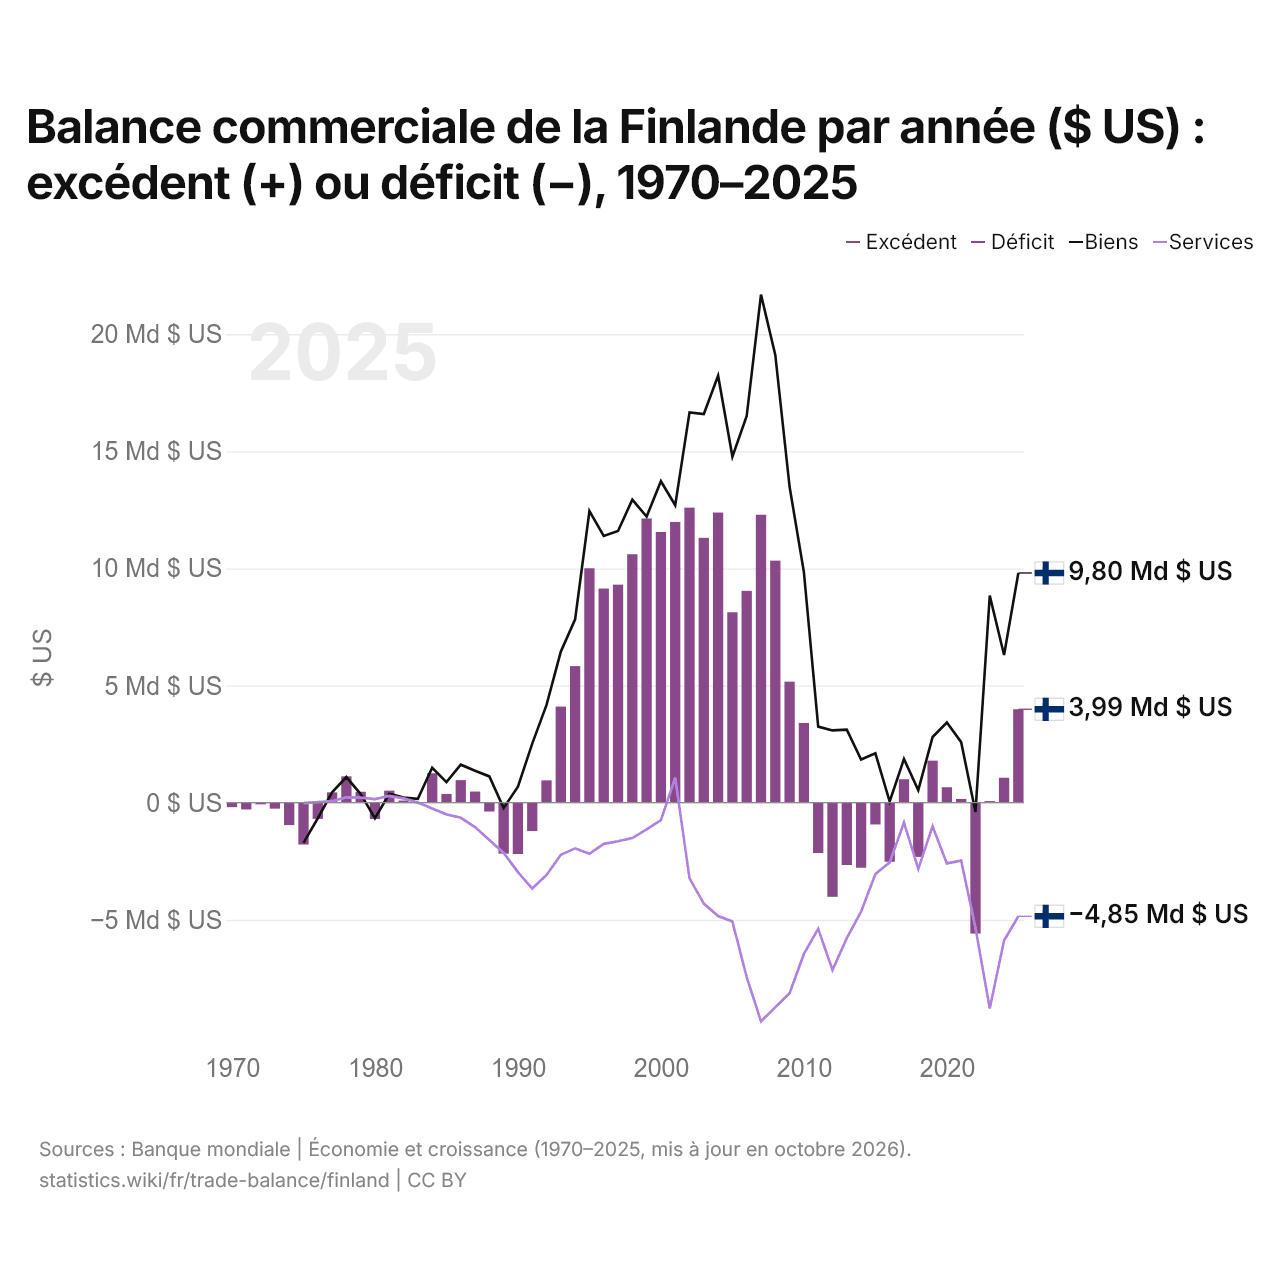
Balance commerciale de la Finlande par année ($ US) : excédent (+) ou déficit (−), 1970–2025
| Année | $ US | ||
|---|---|---|---|
| Biens et services | Biens | Services | |
| 2025 | 3 986 580 508 $ US | 9 804 081 942 $ US | −4 850 103 290 $ US |
| 2024 | 1 061 815 240 $ US | 6 304 871 618 $ US | −5 884 461 914 $ US |
| 2023 | 67 038 655 $ US | 8 834 972 549 $ US | −8 782 657 000 $ US |
| 2022 | −5 585 369 977 $ US | −393 686 416 $ US | −5 337 156 500 $ US |
| 2021 | 159 669 942 $ US | 2 582 796 655 $ US | −2 474 203 921 $ US |
| 2020 | 659 047 155 $ US | 3 421 053 981 $ US | −2 592 588 981 $ US |
| 2019 | 1 795 637 114 $ US | 2 800 992 766 $ US | −1 008 038 792 $ US |
| 2018 | −2 314 670 839 $ US | 533 686 345 $ US | −2 825 103 983 $ US |
| 2017 | 999 767 841 $ US | 1 863 435 799 $ US | −848 441 725 $ US |
| 2016 | −2 520 418 388 $ US | 48 692 356 $ US | −2 549 893 876 $ US |
| 2015 | −929 771 802 $ US | 2 108 910 608 $ US | −3 042 859 702 $ US |
| 2014 | −2 777 895 140 $ US | 1 844 356 208 $ US | −4 650 592 067 $ US |
| 2013 | −2 661 548 551 $ US | 3 118 846 251 $ US | −5 782 672 401 $ US |
| 2012 | −4 017 534 177 $ US | 3 083 723 288 $ US | −7 139 667 263 $ US |
| 2011 | −2 149 178 911 $ US | 3 247 120 516 $ US | −5 381 284 545 $ US |
| 2010 | 3 404 440 400 $ US | 9 840 964 417 $ US | −6 455 967 883 $ US |
| 2009 | 5 167 668 873 $ US | 13 482 644 848 $ US | −8 128 598 893 $ US |
| 2008 | 10 330 586 413 $ US | 19 113 793 404 $ US | −8 730 957 947 $ US |
| 2007 | 12 291 817 534 $ US | 21 683 815 551 $ US | −9 332 849 270 $ US |
| 2006 | 9 041 567 128 $ US | 16 510 948 187 $ US | −7 446 303 222 $ US |
| 2005 | 8 128 885 840 $ US | 14 772 451 936 $ US | −5 076 063 253 $ US |
| 2004 | 12 383 047 562 $ US | 18 225 753 513 $ US | −4 839 083 136 $ US |
| 2003 | 11 304 816 959 $ US | 16 587 966 640 $ US | −4 306 239 057 $ US |
| 2002 | 12 595 042 024 $ US | 16 658 116 705 $ US | −3 231 420 996 $ US |
| 2001 | 11 983 523 079 $ US | 12 698 495 119 $ US | 1 065 274 981 $ US |
| 2000 | 11 552 545 763 $ US | 13 721 252 051 $ US | −748 368 379 $ US |
| 1999 | 12 131 733 306 $ US | 12 209 671 524 $ US | −1 135 618 261 $ US |
| 1998 | 10 603 026 257 $ US | 12 932 597 547 $ US | −1 511 106 430 $ US |
| 1997 | 9 307 066 774 $ US | 11 597 026 175 $ US | −1 648 104 294 $ US |
| 1996 | 9 139 269 997 $ US | 11 384 955 208 $ US | −1 758 109 657 $ US |
| 1995 | 10 005 446 623 $ US | 12 447 395 176 $ US | −2 179 537 318 $ US |
| 1994 | 5 829 254 411 $ US | 7 827 443 446 $ US | −1 949 564 307 $ US |
| 1993 | 4 101 176 226 $ US | 6 449 241 743 $ US | −2 224 554 522 $ US |
| 1992 | 953 013 008 $ US | 4 173 741 992 $ US | −3 085 260 126 $ US |
| 1991 | −1 213 056 903 $ US | 2 521 125 929 $ US | −3 666 336 058 $ US |
| 1990 | −2 190 950 086 $ US | 684 406 084 $ US | −2 960 318 612 $ US |
| 1989 | −2 175 419 149 $ US | −227 422 250 $ US | −2 143 323 453 $ US |
| 1988 | −378 109 453 $ US | 1 122 085 435 $ US | −1 596 001 782 $ US |
| 1987 | 474 773 434 $ US | 1 362 363 071 $ US | −1 038 017 382 $ US |
| 1986 | 964 109 782 $ US | 1 620 356 688 $ US | −643 672 691 $ US |
| 1985 | 374 136 608 $ US | 877 686 455 $ US | −498 638 245 $ US |
| 1984 | 1 254 451 919 $ US | 1 491 249 280 $ US | −246 039 770 $ US |
| 1983 | −5 337 319 $ US | 161 926 044 $ US | 2 077 146 $ US |
| 1982 | 91 279 141 $ US | 214 791 334 $ US | 186 231 344 $ US |
| 1981 | 512 537 889 $ US | 377 053 637 $ US | 288 565 535 $ US |
| 1980 | −698 119 222 $ US | −657 663 626 $ US | 152 659 658 $ US |
| 1979 | 464 051 290 $ US | 365 550 198 $ US | 218 935 788 $ US |
| 1978 | 1 122 021 661 $ US | 1 095 125 459 $ US | 229 110 944 $ US |
| 1977 | 439 722 591 $ US | 441 840 689 $ US | 64 627 015 $ US |
| 1976 | −692 414 218 $ US | −665 621 693 $ US | 26 724 336 $ US |
| 1975 | −1 787 619 202 $ US | −1 715 110 890 $ US | −21 054 730 $ US |
| 1974 | −957 450 764 $ US | - | - |
| 1973 | −252 992 065 $ US | - | - |
| 1972 | −71 366 504 $ US | - | - |
| 1971 | −288 914 464 $ US | - | - |
| 1970 | −190 948 471 $ US | - | - |
En 2025, la balance commerciale de la Finlande affichait un excédent de 3,99 milliards de dollars, contre un déficit de 191 millions de dollars en 1970. Le plus grand déficit a été de 5,59 milliards de dollars, en 2022, et le plus grand excédent de 12,6 milliards de dollars, en 2002. La balance commerciale de la Finlande est excédentaire chaque année depuis 2023.
En 2025, le solde commercial de la Finlande était le 18e plus élevé de 41 pays situés en Europe, où les soldes allaient d'un déficit de 56,8 milliards de dollars en Ukraine à un excédent de 290 milliards de dollars en Irlande. De 2016 à 2025, les soldes commerciaux de la Finlande ont totalisé un déficit de 1,69 milliard de dollars, contre un excédent de 27,7 milliards de dollars de 2006 à 2015. En 2025, les transactions courantes de la Finlande affichaient un excédent de 1,6 % du PIB.
Commerce de biens de la Finlande avec ses 10 principaux partenaires commerciaux, selon la Finlande, 2025
| Pays | Exportations vers | Importations depuis | Solde | |
|---|---|---|---|---|
 Allemagne |
8,22 Md $US | 11,3 Md $US | −3,06 Md $US | vs Allemagne |
 Suède |
9,50 Md $US | 9,72 Md $US | −217 M $US | vs Suède |
 États-Unis |
8,74 Md $US | 4,66 Md $US | +4,08 Md $US | |
 Chine |
3,62 Md $US | 8,00 Md $US | −4,38 Md $US | |
 Pays-Bas |
6,28 Md $US | 4,06 Md $US | +2,22 Md $US | vs Pays-Bas |
 Norvège |
2,78 Md $US | 5,88 Md $US | −3,10 Md $US | vs Norvège |
 Pologne |
3,17 Md $US | 3,16 Md $US | +12,1 M $US | vs Pologne |
 Estonie |
2,70 Md $US | 2,79 Md $US | −86,4 M $US | vs Estonie |
 Italie |
2,31 Md $US | 2,53 Md $US | −217 M $US | vs Italie |
 France |
2,61 Md $US | 2,22 Md $US | +386 M $US | vs France |
Balance commerciale de la Finlande : excédent (+) ou déficit (−)
| Biens et services, $ US, 2025 | +3,99 Md $US |
|---|---|
| % du PIB, 2025 | +1,3 % |
| Années d'excédent, 2000–2025 | 18 |
| Biens, $ US, 2025 | +9,80 Md $US |
| Services, $ US, 2025 | −4,85 Md $US |
| Premier excédent en biens, 2025 | États-Unis +4,08 Md $US |
| Premier déficit en biens, 2025 | Chine −4,38 Md $US |
Comparer la balance commerciale de la Finlande avec celle d'autres pays
Sources :
- TradeMap (2025, mis à jour en octobre 2026)
- Banque mondiale | Économie et croissance (1970–2025, mis à jour en octobre 2026)
Creative Commons Attribution (CC BY) : vous pouvez copier, partager, adapter et réutiliser ce contenu, y compris à des fins commerciales, à condition de citer statistics.wiki et d’indiquer les modifications apportées. Les sources citées ci-dessus peuvent avoir leurs propres conditions de licence.