
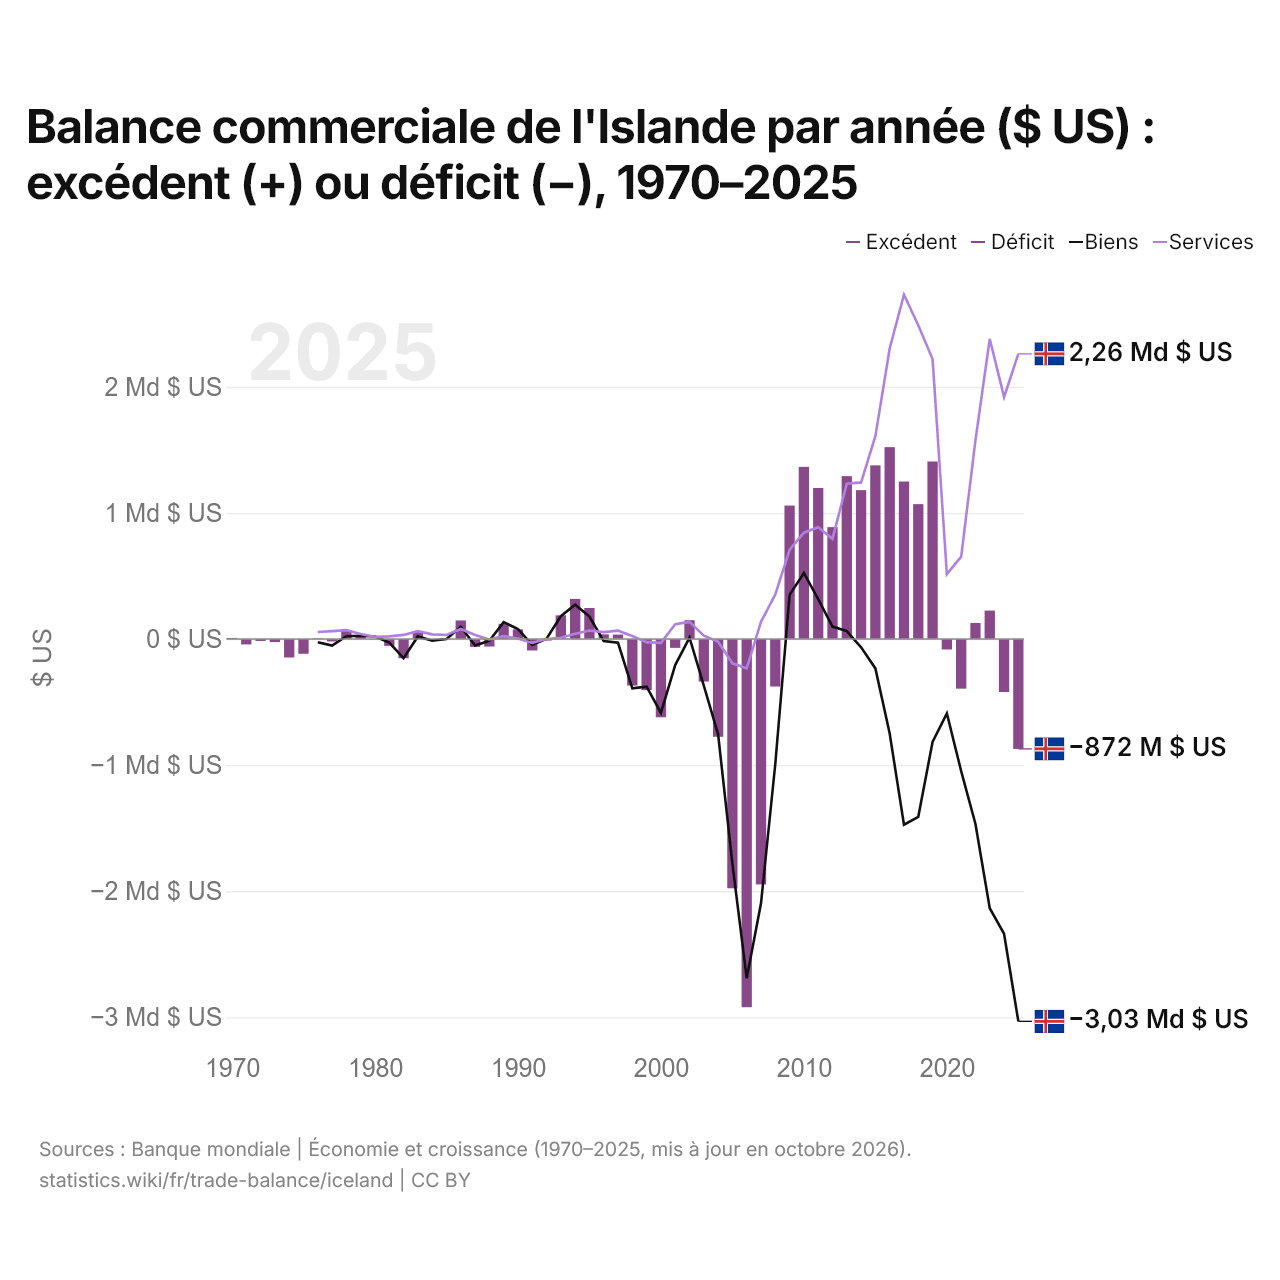
Balance commerciale de l'Islande par année ($ US) : excédent (+) ou déficit (−), 1970–2025
| Année | $ US | ||
|---|---|---|---|
| Biens et services | Biens | Services | |
| 2025 | −872 016 321 $ US | −3 033 162 201 $ US | 2 261 530 341 $ US |
| 2024 | −420 498 993 $ US | −2 338 263 568 $ US | 1 919 077 173 $ US |
| 2023 | 225 180 580 $ US | −2 136 257 372 $ US | 2 380 910 598 $ US |
| 2022 | 126 733 534 $ US | −1 467 680 394 $ US | 1 574 970 231 $ US |
| 2021 | −394 000 859 $ US | −1 047 668 334 $ US | 652 762 729 $ US |
| 2020 | −83 193 816 $ US | −590 343 141 $ US | 514 753 372 $ US |
| 2019 | 1 408 033 063 $ US | −816 461 056 $ US | 2 221 038 785 $ US |
| 2018 | 1 069 463 818 $ US | −1 411 148 842 $ US | 2 489 114 879 $ US |
| 2017 | 1 248 905 003 $ US | −1 472 648 107 $ US | 2 731 319 049 $ US |
| 2016 | 1 521 828 666 $ US | −749 591 135 $ US | 2 304 775 992 $ US |
| 2015 | 1 377 229 956 $ US | −233 393 993 $ US | 1 608 039 168 $ US |
| 2014 | 1 180 519 221 $ US | −65 439 692 $ US | 1 241 948 814 $ US |
| 2013 | 1 291 452 110 $ US | 62 480 031 $ US | 1 231 451 157 $ US |
| 2012 | 887 039 309 $ US | 98 616 634 $ US | 794 361 792 $ US |
| 2011 | 1 197 874 497 $ US | 315 667 449 $ US | 886 609 701 $ US |
| 2010 | 1 365 562 866 $ US | 523 791 506 $ US | 843 357 579 $ US |
| 2009 | 1 058 255 121 $ US | 349 965 622 $ US | 705 775 931 $ US |
| 2008 | −377 257 490 $ US | −990 592 280 $ US | 353 163 156 $ US |
| 2007 | −1 946 714 168 $ US | −2 096 824 505 $ US | 135 518 802 $ US |
| 2006 | −2 921 079 638 $ US | −2 691 346 825 $ US | −232 793 155 $ US |
| 2005 | −1 977 500 020 $ US | −1 783 228 297 $ US | −193 078 651 $ US |
| 2004 | −775 868 258 $ US | −756 188 522 $ US | −21 300 793 $ US |
| 2003 | −337 728 298 $ US | −369 261 000 $ US | 26 009 487 $ US |
| 2002 | 148 944 194 $ US | 10 916 709 $ US | 135 752 019 $ US |
| 2001 | −70 246 016 $ US | −206 716 709 $ US | 117 100 306 $ US |
| 2000 | −620 892 783 $ US | −586 260 576 $ US | −31 207 410 $ US |
| 1999 | −405 640 151 $ US | −377 936 075 $ US | −25 234 804 $ US |
| 1998 | −369 640 831 $ US | −391 744 294 $ US | 23 455 558 $ US |
| 1997 | 35 032 290 $ US | −30 006 317 $ US | 66 008 857 $ US |
| 1996 | 36 588 962 $ US | −16 711 709 $ US | 54 367 340 $ US |
| 1995 | 245 753 381 $ US | 177 860 021 $ US | 67 189 949 $ US |
| 1994 | 317 688 864 $ US | 271 879 797 $ US | 41 862 998 $ US |
| 1993 | 187 567 083 $ US | 180 681 814 $ US | 9 491 405 $ US |
| 1992 | −12 678 523 $ US | 1 966 976 $ US | 225 218 $ US |
| 1991 | −91 449 786 $ US | −47 907 589 $ US | −31 425 426 $ US |
| 1990 | 76 457 575 $ US | 79 300 658 $ US | 4 129 788 $ US |
| 1989 | 120 210 530 $ US | 134 200 000 $ US | 22 100 000 $ US |
| 1988 | −60 101 060 $ US | −14 000 000 $ US | −4 000 000 $ US |
| 1987 | −62 673 384 $ US | −52 100 000 $ US | 32 000 000 $ US |
| 1986 | 147 128 152 $ US | 96 800 000 $ US | 79 600 000 $ US |
| 1985 | 1 327 248 $ US | −300 000 $ US | 31 400 000 $ US |
| 1984 | −4 574 442 $ US | −13 400 000 $ US | 36 200 000 $ US |
| 1983 | 55 700 324 $ US | 20 400 000 $ US | 61 800 000 $ US |
| 1982 | −152 694 895 $ US | −152 100 000 $ US | 32 100 000 $ US |
| 1981 | −54 508 458 $ US | −29 100 000 $ US | 20 800 000 $ US |
| 1980 | −3 478 406 $ US | 19 900 000 $ US | 17 000 000 $ US |
| 1979 | 29 433 919 $ US | 25 500 000 $ US | 39 300 000 $ US |
| 1978 | 70 782 708 $ US | 21 900 000 $ US | 69 900 000 $ US |
| 1977 | −19 131 091 $ US | −52 100 000 $ US | 62 300 000 $ US |
| 1976 | 4 439 809 $ US | −25 900 000 $ US | 55 300 000 $ US |
| 1975 | −117 630 449 $ US | - | - |
| 1974 | −146 748 374 $ US | - | - |
| 1973 | −24 512 371 $ US | - | - |
| 1972 | −15 764 786 $ US | - | - |
| 1971 | −43 385 227 $ US | - | - |
| 1970 | 8 209 091 $ US | - | - |
En 2025, la balance commerciale de l'Islande affichait un déficit de 872 millions de dollars, contre un excédent de 8,21 millions de dollars en 1970. Le plus grand déficit a été de 2,92 milliards de dollars, en 2006, et le plus grand excédent de 1,52 milliard de dollars, en 2016.
En 2025, le solde commercial de l'Islande était le 25e plus élevé de 41 pays situés en Europe, où les soldes allaient d'un déficit de 56,8 milliards de dollars en Ukraine à un excédent de 290 milliards de dollars en Irlande. De 2016 à 2025, les soldes commerciaux de l'Islande ont totalisé un excédent de 3,83 milliards de dollars, contre un excédent de 3,11 milliards de dollars de 2006 à 2015. En 2025, les transactions courantes de l'Islande affichaient un déficit de 3,9 % du PIB.
Commerce de biens de l'Islande avec ses 10 principaux partenaires commerciaux, selon l'Islande, 2025
| Pays | Exportations vers | Importations depuis | Solde | |
|---|---|---|---|---|
 Pays-Bas |
2,48 Md $US | 559 M $US | +1,92 Md $US | |
 Chine |
198 M $US | 1,30 Md $US | −1,10 Md $US | |
 États-Unis |
668 M $US | 754 M $US | −86,4 M $US | |
 Norvège |
262 M $US | 1,07 Md $US | −812 M $US | vs Norvège |
 Allemagne |
316 M $US | 943 M $US | −627 M $US | |
 Royaume-Uni |
714 M $US | 394 M $US | +320 M $US | |
 Danemark |
158 M $US | 647 M $US | −489 M $US | |
 France |
527 M $US | 272 M $US | +255 M $US | vs France |
 Espagne |
375 M $US | 199 M $US | +176 M $US | |
 Suède |
82,4 M $US | 448 M $US | −365 M $US |
Balance commerciale de l'Islande : excédent (+) ou déficit (−)
Comparer la balance commerciale de l'Islande avec celle d'autres pays
Sources :
- TradeMap (2025, mis à jour en octobre 2026)
- Banque mondiale | Économie et croissance (1970–2025, mis à jour en octobre 2026)
Creative Commons Attribution (CC BY) : vous pouvez copier, partager, adapter et réutiliser ce contenu, y compris à des fins commerciales, à condition de citer statistics.wiki et d’indiquer les modifications apportées. Les sources citées ci-dessus peuvent avoir leurs propres conditions de licence.