
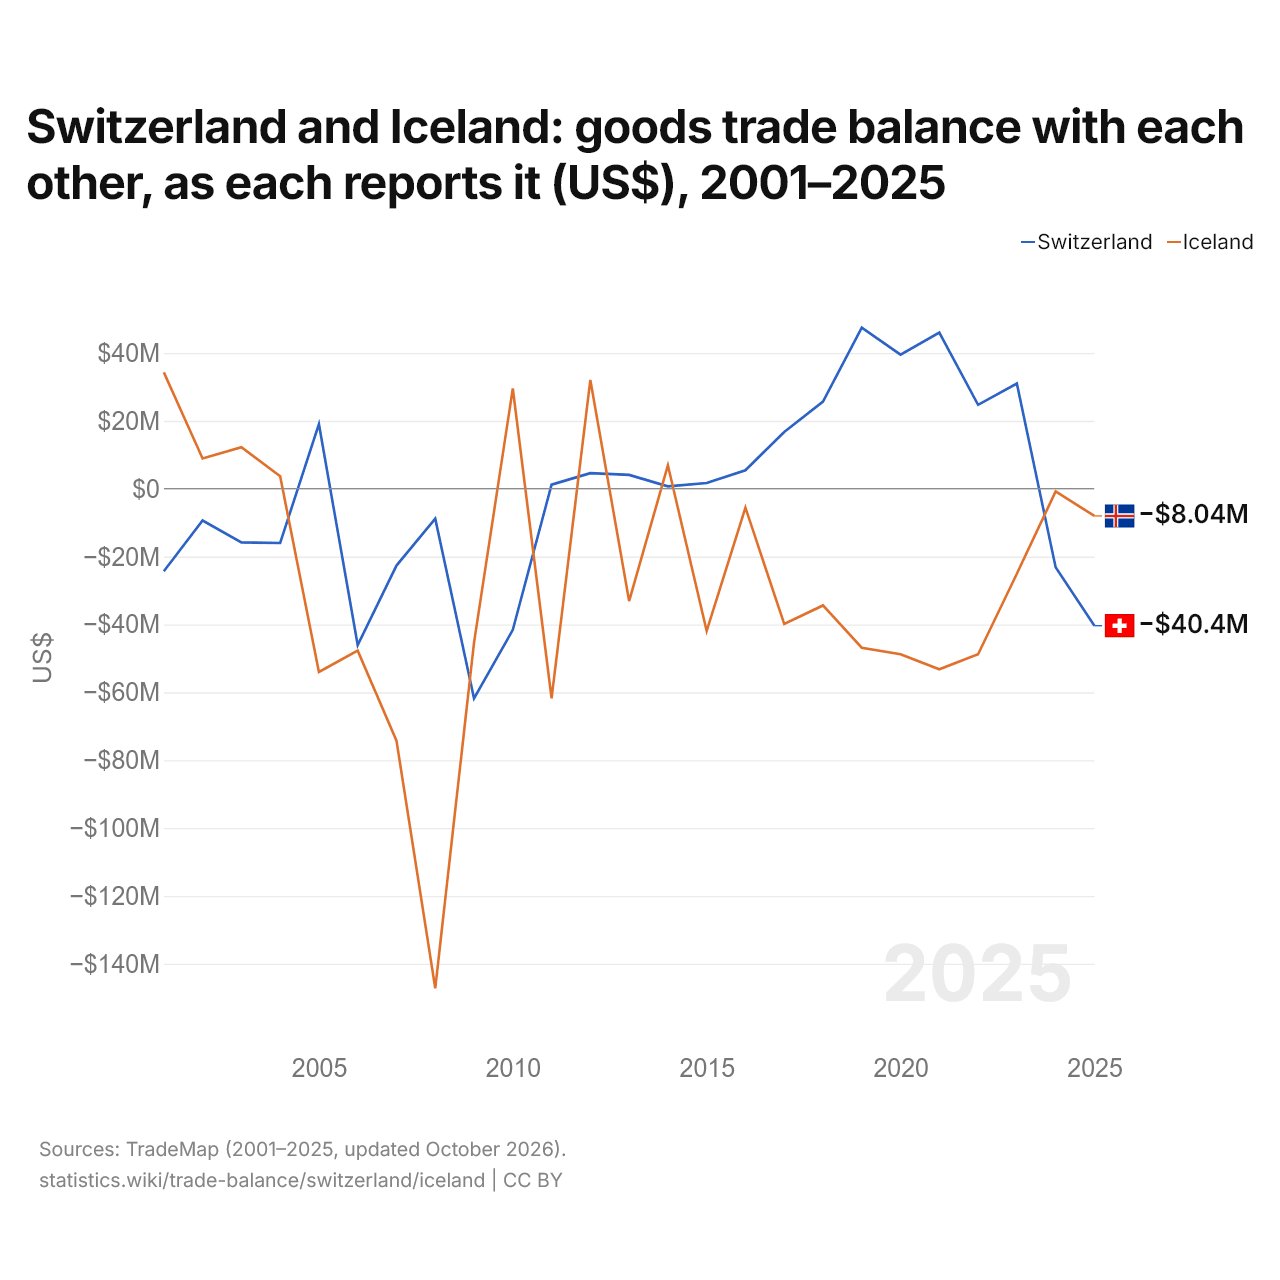
La Suisse et l'Islande : solde de leur commerce de biens bilatéral, selon chacun ($ US), 2001–2025
| Année | $ US | |
|---|---|---|
| Suisse | Islande | |
| 2025 | −40 381 000 $ US | −8 038 000 $ US |
| 2024 | −23 158 000 $ US | −819 000 $ US |
| 2023 | 30 974 000 $ US | −25 064 000 $ US |
| 2022 | 24 710 000 $ US | −48 801 000 $ US |
| 2021 | 46 008 000 $ US | −53 207 000 $ US |
| 2020 | 39 481 000 $ US | −48 801 000 $ US |
| 2019 | 47 439 000 $ US | −46 862 000 $ US |
| 2018 | 25 658 000 $ US | −34 407 000 $ US |
| 2017 | 16 723 000 $ US | −39 866 000 $ US |
| 2016 | 5 440 000 $ US | −5 590 000 $ US |
| 2015 | 1 663 000 $ US | −41 937 000 $ US |
| 2014 | 698 000 $ US | 6 900 000 $ US |
| 2013 | 4 062 000 $ US | −33 126 000 $ US |
| 2012 | 4 576 000 $ US | 32 054 000 $ US |
| 2011 | 1 173 000 $ US | −61 774 000 $ US |
| 2010 | −41 596 000 $ US | 29 508 000 $ US |
| 2009 | −61 773 000 $ US | −45 373 000 $ US |
| 2008 | −8 818 000 $ US | −147 228 000 $ US |
| 2007 | −22 655 000 $ US | −74 232 000 $ US |
| 2006 | −46 091 000 $ US | −47 728 000 $ US |
| 2005 | 19 019 000 $ US | −54 021 000 $ US |
| 2004 | −16 001 000 $ US | 3 654 000 $ US |
| 2003 | −15 868 000 $ US | 12 201 000 $ US |
| 2002 | −9 363 000 $ US | 8 890 000 $ US |
| 2001 | −24 337 000 $ US | 34 258 000 $ US |
En 2025, selon la Suisse, son commerce de biens avec l'Islande affichait un déficit de 40,4 millions de dollars ; selon l'Islande, son commerce de biens avec la Suisse affichait un déficit de 8,04 millions de dollars. En 2001, les chiffres étaient un déficit de 24,3 millions de dollars pour la Suisse et un excédent de 34,3 millions de dollars pour l'Islande.
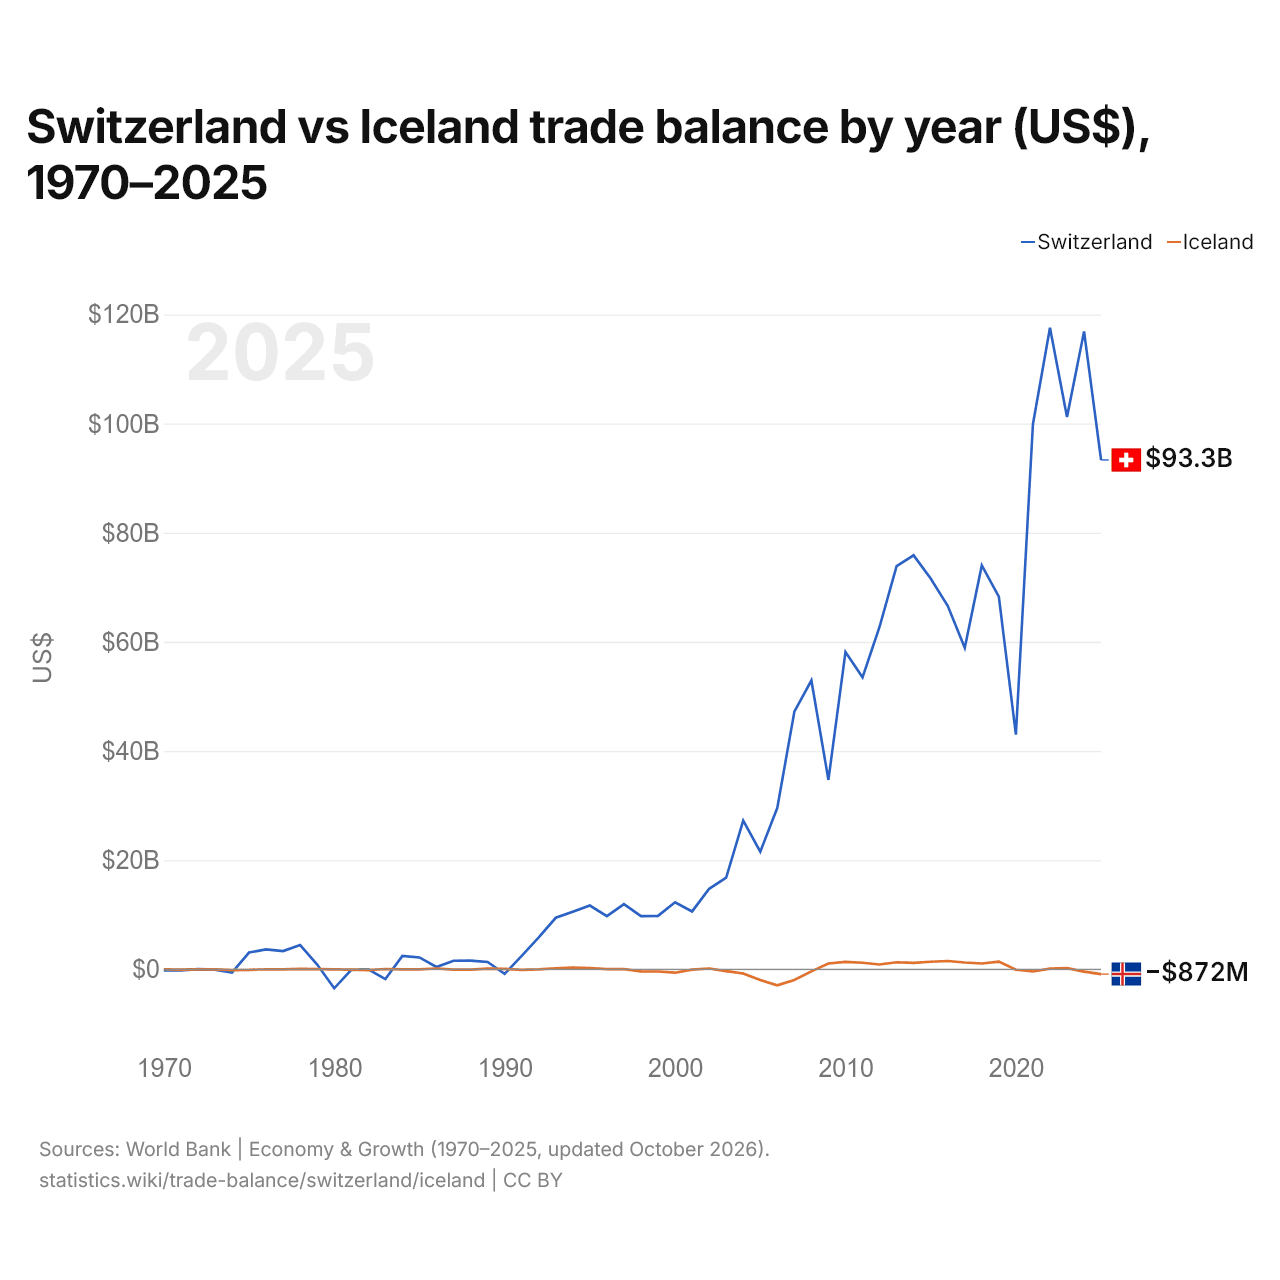
Suisse vs Islande : balance commerciale par année ($ US), 1970–2025
| Année | $ US | |
|---|---|---|
 Suisse |
 Islande |
|
| 2025 | 93 327 424 779 $ US | −872 016 321 $ US |
| 2024 | 116 875 945 667 $ US | −420 498 993 $ US |
| 2023 | 101 202 061 236 $ US | 225 180 580 $ US |
| 2022 | 117 559 414 871 $ US | 126 733 534 $ US |
| 2021 | 99 877 578 549 $ US | −394 000 859 $ US |
| 2020 | 42 986 735 072 $ US | −83 193 816 $ US |
| 2019 | 68 295 204 649 $ US | 1 408 033 063 $ US |
| 2018 | 73 995 137 798 $ US | 1 069 463 818 $ US |
| 2017 | 58 909 490 111 $ US | 1 248 905 003 $ US |
| 2016 | 66 597 209 588 $ US | 1 521 828 666 $ US |
| 2015 | 71 602 620 494 $ US | 1 377 229 956 $ US |
| 2014 | 75 842 856 051 $ US | 1 180 519 221 $ US |
| 2013 | 73 866 194 779 $ US | 1 291 452 110 $ US |
| 2012 | 62 754 994 042 $ US | 887 039 309 $ US |
| 2011 | 53 497 314 868 $ US | 1 197 874 497 $ US |
| 2010 | 58 133 791 152 $ US | 1 365 562 866 $ US |
| 2009 | 34 705 789 909 $ US | 1 058 255 121 $ US |
| 2008 | 52 921 058 074 $ US | −377 257 490 $ US |
| 2007 | 47 201 037 154 $ US | −1 946 714 168 $ US |
| 2006 | 29 597 737 279 $ US | −2 921 079 638 $ US |
| 2005 | 21 536 056 858 $ US | −1 977 500 020 $ US |
| 2004 | 27 242 195 416 $ US | −775 868 258 $ US |
| 2003 | 16 783 998 663 $ US | −337 728 298 $ US |
| 2002 | 14 761 475 683 $ US | 148 944 194 $ US |
| 2001 | 10 603 772 813 $ US | −70 246 016 $ US |
| 2000 | 12 292 429 536 $ US | −620 892 783 $ US |
| 1999 | 9 788 555 452 $ US | −405 640 151 $ US |
| 1998 | 9 746 614 016 $ US | −369 640 831 $ US |
| 1997 | 11 941 174 120 $ US | 35 032 290 $ US |
| 1996 | 9 727 214 401 $ US | 36 588 962 $ US |
| 1995 | 11 678 361 945 $ US | 245 753 381 $ US |
| 1994 | 10 539 556 189 $ US | 317 688 864 $ US |
| 1993 | 9 449 052 518 $ US | 187 567 083 $ US |
| 1992 | 5 842 552 269 $ US | −12 678 523 $ US |
| 1991 | 2 469 264 296 $ US | −91 449 786 $ US |
| 1990 | −826 786 640 $ US | 76 457 575 $ US |
| 1989 | 1 347 452 778 $ US | 120 210 530 $ US |
| 1988 | 1 585 879 861 $ US | −60 101 060 $ US |
| 1987 | 1 565 024 812 $ US | −62 673 384 $ US |
| 1986 | 434 064 150 $ US | 147 128 152 $ US |
| 1985 | 2 176 477 962 $ US | 1 327 248 $ US |
| 1984 | 2 438 939 013 $ US | −4 574 442 $ US |
| 1983 | −1 788 923 824 $ US | 55 700 324 $ US |
| 1982 | 4 030 439 $ US | −152 694 895 $ US |
| 1981 | −99 430 302 $ US | −54 508 458 $ US |
| 1980 | −3 479 950 468 $ US | −3 478 406 $ US |
| 1979 | 879 793 108 $ US | 29 433 919 $ US |
| 1978 | 4 440 991 611 $ US | 70 782 708 $ US |
| 1977 | 3 344 607 447 $ US | −19 131 091 $ US |
| 1976 | 3 651 735 878 $ US | 4 439 809 $ US |
| 1975 | 3 077 404 796 $ US | −117 630 449 $ US |
| 1974 | −618 285 168 $ US | −146 748 374 $ US |
| 1973 | −63 467 202 $ US | −24 512 371 $ US |
| 1972 | 43 511 115 $ US | −15 764 786 $ US |
| 1971 | −193 591 766 $ US | −43 385 227 $ US |
| 1970 | −193 422 365 $ US | 8 209 091 $ US |
En 2025, la balance commerciale de la Suisse affichait un excédent de 93,3 milliards de dollars et celle de l'Islande un déficit de 872 millions de dollars. En 1970, la balance commerciale de la Suisse affichait un déficit de 193 millions de dollars et celle de l'Islande un excédent de 8,21 millions de dollars.
De 1970 à 2025, la balance commerciale de la Suisse a été excédentaire pendant 48 des 56 années, et celle de l'Islande pendant 28. Les balances commerciales de la Suisse et de l'Islande ont été déficitaires en même temps pendant 5 de ces années, la dernière fois en 1981.
Suisse vs Islande : chiffres de la balance commerciale
|
Suisse
|
Islande
|
|
|---|---|---|
| Biens et services, $ US | +93,3 Md $US (2025) | −872 M $US (2025) |
| % du PIB | +8,9 % (2025) | −2,3 % (2025) |
| Années d'excédent depuis 2000 | 26 sur 26 | 14 sur 26 |
| Solde des biens entre les deux, chiffres propres | −40,4 M $US (2025) | −8,04 M $US (2025) |
| Premier excédent en biens avec | États-Unis (+57,0 Md $US, 2025) | Pays-Bas (+1,92 Md $US, 2025) |
| Premier déficit en biens avec | Émirats arabes unis (−35,9 Md $US, 2025) | Chine (−1,10 Md $US, 2025) |
Comparer la balance commerciale de 2 pays au choix
Sources :
- Banque mondiale | Économie et croissance (1970–2025, mis à jour en octobre 2026)
- TradeMap (2001–2025, mis à jour en octobre 2026)
Creative Commons Attribution (CC BY) : vous pouvez copier, partager, adapter et réutiliser ce contenu, y compris à des fins commerciales, à condition de citer statistics.wiki et d’indiquer les modifications apportées. Les sources citées ci-dessus peuvent avoir leurs propres conditions de licence.