
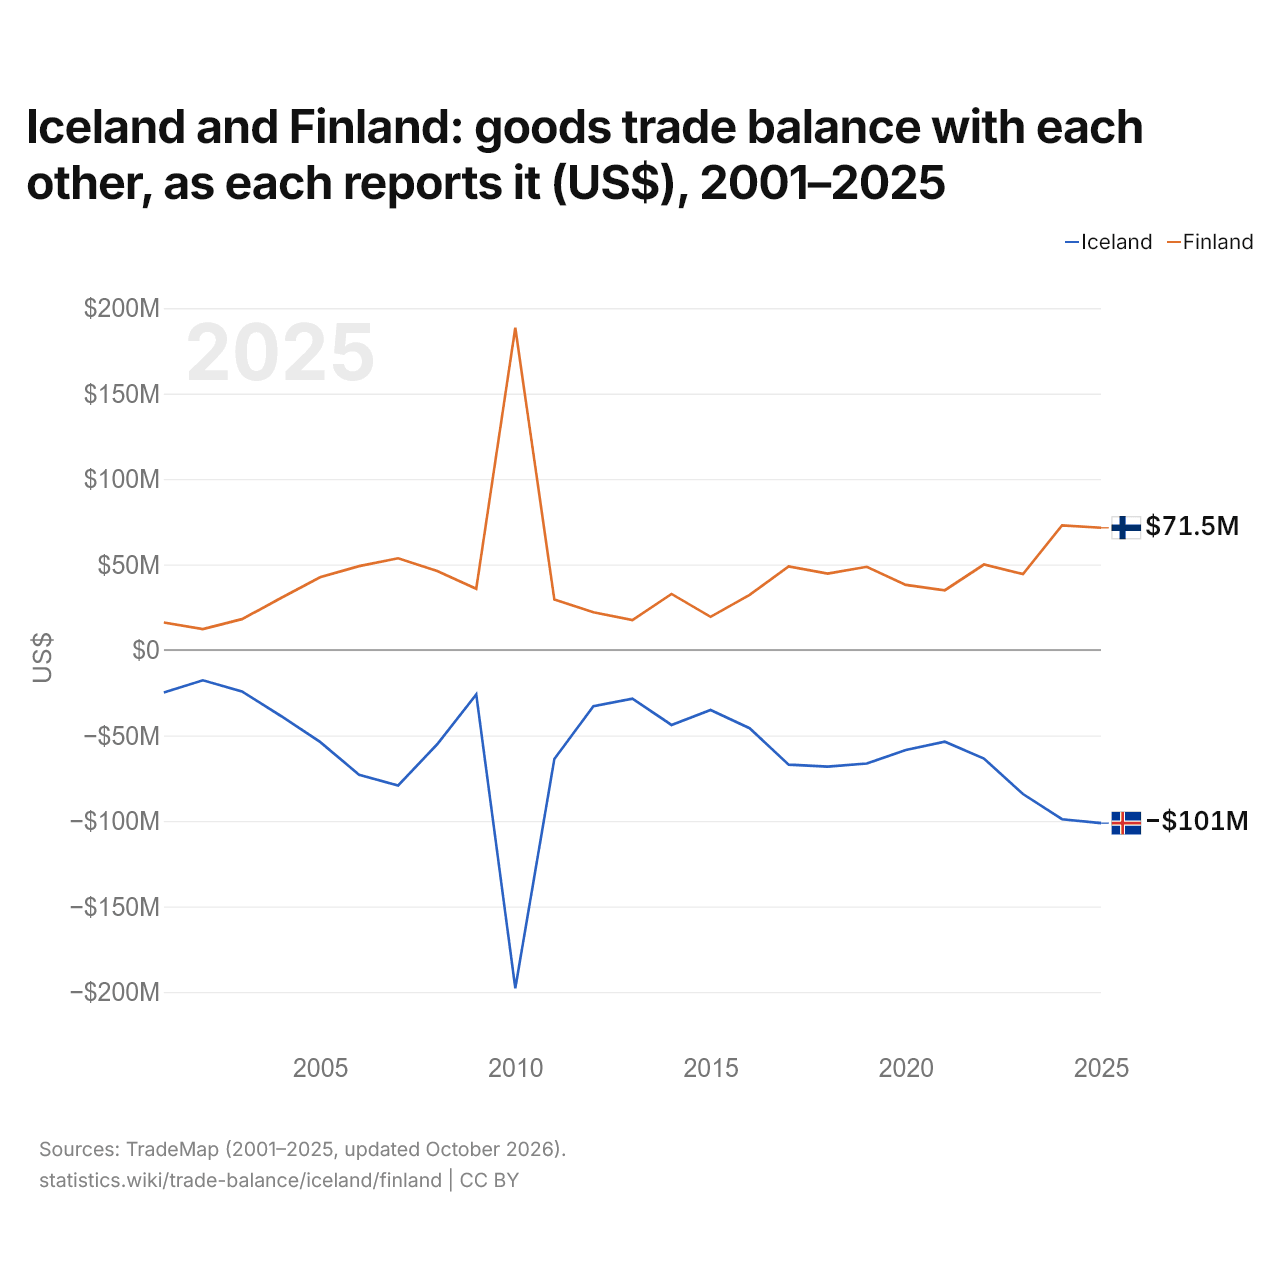
L'Islande et la Finlande : solde de leur commerce de biens bilatéral, selon chacun ($ US), 2001–2025
| Année | $ US | |
|---|---|---|
| Islande | Finlande | |
| 2025 | −101 238 000 $ US | 71 498 000 $ US |
| 2024 | −98 956 000 $ US | 72 887 000 $ US |
| 2023 | −84 208 000 $ US | 44 464 000 $ US |
| 2022 | −63 465 000 $ US | 50 012 000 $ US |
| 2021 | −53 630 000 $ US | 34 963 000 $ US |
| 2020 | −58 428 000 $ US | 38 111 000 $ US |
| 2019 | −66 385 000 $ US | 48 677 000 $ US |
| 2018 | −68 157 000 $ US | 44 707 000 $ US |
| 2017 | −67 028 000 $ US | 48 882 000 $ US |
| 2016 | −45 721 000 $ US | 32 253 000 $ US |
| 2015 | −35 089 000 $ US | 19 430 000 $ US |
| 2014 | −43 825 000 $ US | 32 803 000 $ US |
| 2013 | −28 434 000 $ US | 17 499 000 $ US |
| 2012 | −32 806 000 $ US | 22 111 000 $ US |
| 2011 | −63 717 000 $ US | 29 554 000 $ US |
| 2010 | −197 831 000 $ US | 188 508 000 $ US |
| 2009 | −25 945 000 $ US | 35 828 000 $ US |
| 2008 | −55 116 000 $ US | 46 251 000 $ US |
| 2007 | −79 200 000 $ US | 53 674 000 $ US |
| 2006 | −72 919 000 $ US | 49 043 000 $ US |
| 2005 | −53 708 000 $ US | 42 557 000 $ US |
| 2004 | −38 578 000 $ US | 30 403 000 $ US |
| 2003 | −24 210 000 $ US | 18 055 000 $ US |
| 2002 | −17 718 000 $ US | 12 278 000 $ US |
| 2001 | −24 809 000 $ US | 16 066 000 $ US |
En 2025, selon l'Islande, son commerce de biens avec la Finlande affichait un déficit de 101 millions de dollars ; selon la Finlande, son commerce de biens avec l'Islande affichait un excédent de 71,5 millions de dollars. En 2001, les chiffres étaient un déficit de 24,8 millions de dollars pour l'Islande et un excédent de 16,1 millions de dollars pour la Finlande.
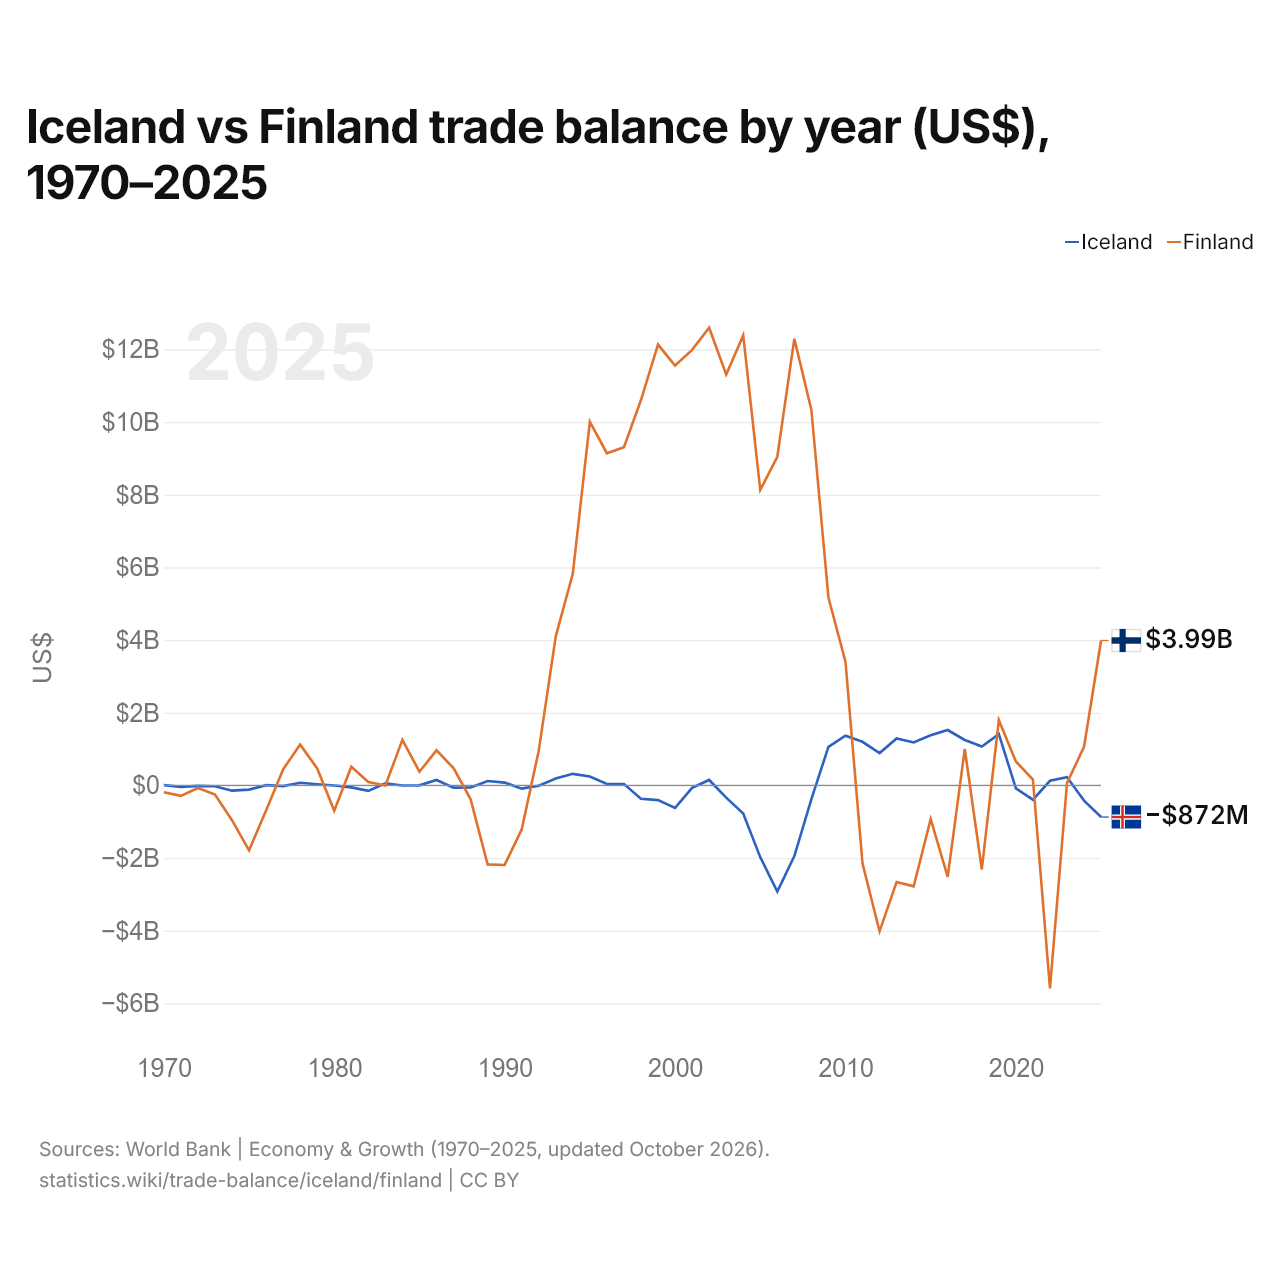
Islande vs Finlande : balance commerciale par année ($ US), 1970–2025
| Année | $ US | |
|---|---|---|
 Islande |
 Finlande |
|
| 2025 | −872 016 321 $ US | 3 986 580 508 $ US |
| 2024 | −420 498 993 $ US | 1 061 815 240 $ US |
| 2023 | 225 180 580 $ US | 67 038 655 $ US |
| 2022 | 126 733 534 $ US | −5 585 369 977 $ US |
| 2021 | −394 000 859 $ US | 159 669 942 $ US |
| 2020 | −83 193 816 $ US | 659 047 155 $ US |
| 2019 | 1 408 033 063 $ US | 1 795 637 114 $ US |
| 2018 | 1 069 463 818 $ US | −2 314 670 839 $ US |
| 2017 | 1 248 905 003 $ US | 999 767 841 $ US |
| 2016 | 1 521 828 666 $ US | −2 520 418 388 $ US |
| 2015 | 1 377 229 956 $ US | −929 771 802 $ US |
| 2014 | 1 180 519 221 $ US | −2 777 895 140 $ US |
| 2013 | 1 291 452 110 $ US | −2 661 548 551 $ US |
| 2012 | 887 039 309 $ US | −4 017 534 177 $ US |
| 2011 | 1 197 874 497 $ US | −2 149 178 911 $ US |
| 2010 | 1 365 562 866 $ US | 3 404 440 400 $ US |
| 2009 | 1 058 255 121 $ US | 5 167 668 873 $ US |
| 2008 | −377 257 490 $ US | 10 330 586 413 $ US |
| 2007 | −1 946 714 168 $ US | 12 291 817 534 $ US |
| 2006 | −2 921 079 638 $ US | 9 041 567 128 $ US |
| 2005 | −1 977 500 020 $ US | 8 128 885 840 $ US |
| 2004 | −775 868 258 $ US | 12 383 047 562 $ US |
| 2003 | −337 728 298 $ US | 11 304 816 959 $ US |
| 2002 | 148 944 194 $ US | 12 595 042 024 $ US |
| 2001 | −70 246 016 $ US | 11 983 523 079 $ US |
| 2000 | −620 892 783 $ US | 11 552 545 763 $ US |
| 1999 | −405 640 151 $ US | 12 131 733 306 $ US |
| 1998 | −369 640 831 $ US | 10 603 026 257 $ US |
| 1997 | 35 032 290 $ US | 9 307 066 774 $ US |
| 1996 | 36 588 962 $ US | 9 139 269 997 $ US |
| 1995 | 245 753 381 $ US | 10 005 446 623 $ US |
| 1994 | 317 688 864 $ US | 5 829 254 411 $ US |
| 1993 | 187 567 083 $ US | 4 101 176 226 $ US |
| 1992 | −12 678 523 $ US | 953 013 008 $ US |
| 1991 | −91 449 786 $ US | −1 213 056 903 $ US |
| 1990 | 76 457 575 $ US | −2 190 950 086 $ US |
| 1989 | 120 210 530 $ US | −2 175 419 149 $ US |
| 1988 | −60 101 060 $ US | −378 109 453 $ US |
| 1987 | −62 673 384 $ US | 474 773 434 $ US |
| 1986 | 147 128 152 $ US | 964 109 782 $ US |
| 1985 | 1 327 248 $ US | 374 136 608 $ US |
| 1984 | −4 574 442 $ US | 1 254 451 919 $ US |
| 1983 | 55 700 324 $ US | −5 337 319 $ US |
| 1982 | −152 694 895 $ US | 91 279 141 $ US |
| 1981 | −54 508 458 $ US | 512 537 889 $ US |
| 1980 | −3 478 406 $ US | −698 119 222 $ US |
| 1979 | 29 433 919 $ US | 464 051 290 $ US |
| 1978 | 70 782 708 $ US | 1 122 021 661 $ US |
| 1977 | −19 131 091 $ US | 439 722 591 $ US |
| 1976 | 4 439 809 $ US | −692 414 218 $ US |
| 1975 | −117 630 449 $ US | −1 787 619 202 $ US |
| 1974 | −146 748 374 $ US | −957 450 764 $ US |
| 1973 | −24 512 371 $ US | −252 992 065 $ US |
| 1972 | −15 764 786 $ US | −71 366 504 $ US |
| 1971 | −43 385 227 $ US | −288 914 464 $ US |
| 1970 | 8 209 091 $ US | −190 948 471 $ US |
En 2025, la balance commerciale de l'Islande affichait un déficit de 872 millions de dollars et celle de la Finlande un excédent de 3,99 milliards de dollars. En 1970, la balance commerciale de l'Islande affichait un excédent de 8,21 millions de dollars et celle de la Finlande un déficit de 191 millions de dollars.
De 1970 à 2025, la balance commerciale de l'Islande a été excédentaire pendant 28 des 56 années, et celle de la Finlande pendant 35. Les balances commerciales de l'Islande et de la Finlande ont été déficitaires en même temps pendant 8 de ces années, la dernière fois en 1991.
Islande vs Finlande : chiffres de la balance commerciale
|
Islande
|
Finlande
|
|
|---|---|---|
| Biens et services, $ US | −872 M $US (2025) | +3,99 Md $US (2025) |
| % du PIB | −2,3 % (2025) | +1,3 % (2025) |
| Années d'excédent depuis 2000 | 14 sur 26 | 18 sur 26 |
| Solde des biens entre les deux, chiffres propres | −101 M $US (2025) | +71,5 M $US (2025) |
| Premier excédent en biens avec | Pays-Bas (+1,92 Md $US, 2025) | États-Unis (+4,08 Md $US, 2025) |
| Premier déficit en biens avec | Chine (−1,10 Md $US, 2025) | Chine (−4,38 Md $US, 2025) |
Comparer la balance commerciale de 2 pays au choix
Sources :
- Banque mondiale | Économie et croissance (1970–2025, mis à jour en octobre 2026)
- TradeMap (2001–2025, mis à jour en octobre 2026)
Creative Commons Attribution (CC BY) : vous pouvez copier, partager, adapter et réutiliser ce contenu, y compris à des fins commerciales, à condition de citer statistics.wiki et d’indiquer les modifications apportées. Les sources citées ci-dessus peuvent avoir leurs propres conditions de licence.