
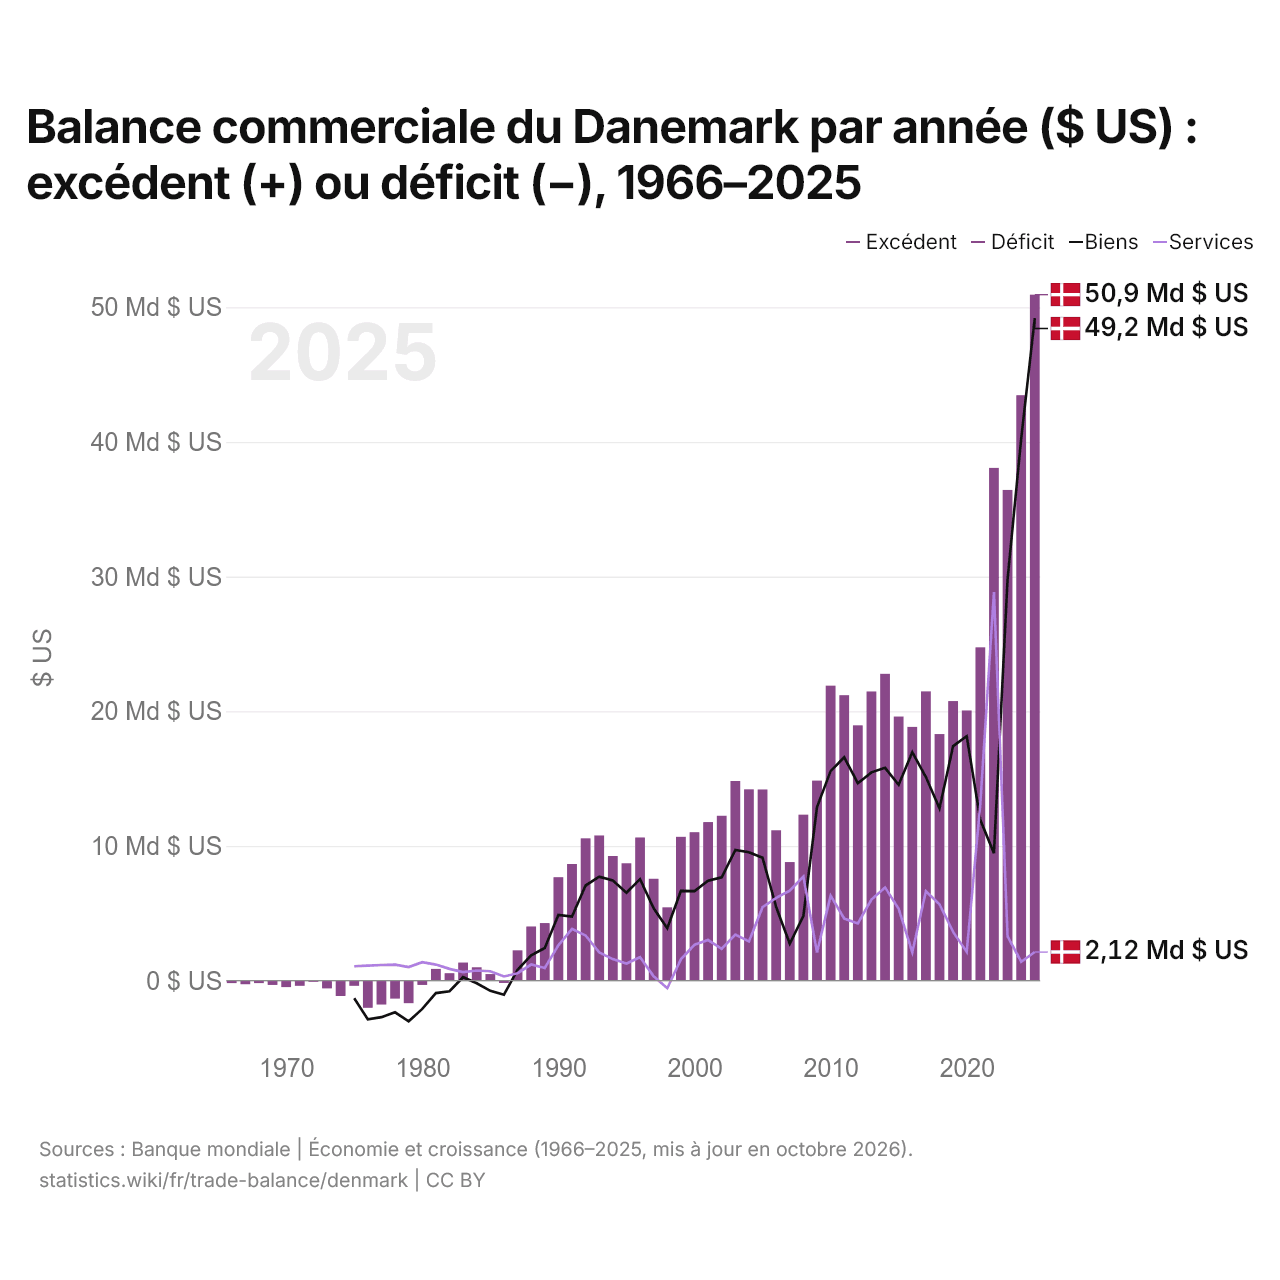
Balance commerciale du Danemark par année ($ US) : excédent (+) ou déficit (−), 1966–2025
| Année | $ US | ||
|---|---|---|---|
| Biens et services | Biens | Services | |
| 2025 | 50 932 699 332 $ US | 49 190 015 701 $ US | 2 122 132 775 $ US |
| 2024 | 43 467 066 903 $ US | 40 222 472 535 $ US | 1 400 532 817 $ US |
| 2023 | 36 432 357 837 $ US | 29 796 332 517 $ US | 3 288 011 133 $ US |
| 2022 | 38 069 295 181 $ US | 9 464 373 803 $ US | 28 842 224 711 $ US |
| 2021 | 24 745 197 988 $ US | 11 918 241 789 $ US | 13 141 222 659 $ US |
| 2020 | 20 058 876 942 $ US | 18 146 206 898 $ US | 2 130 088 550 $ US |
| 2019 | 20 757 733 136 $ US | 17 414 185 917 $ US | 3 613 564 560 $ US |
| 2018 | 18 307 383 851 $ US | 12 792 724 293 $ US | 5 670 863 643 $ US |
| 2017 | 21 475 852 176 $ US | 15 115 589 441 $ US | 6 635 285 436 $ US |
| 2016 | 18 840 555 435 $ US | 16 959 387 149 $ US | 2 105 370 869 $ US |
| 2015 | 19 609 141 789 $ US | 14 540 684 110 $ US | 5 325 691 165 $ US |
| 2014 | 22 778 690 297 $ US | 15 802 238 989 $ US | 6 921 437 480 $ US |
| 2013 | 21 467 084 047 $ US | 15 463 813 956 $ US | 6 016 150 449 $ US |
| 2012 | 18 952 023 931 $ US | 14 655 555 269 $ US | 4 244 567 192 $ US |
| 2011 | 21 190 297 384 $ US | 16 581 073 391 $ US | 4 606 806 699 $ US |
| 2010 | 21 899 620 827 $ US | 15 552 915 844 $ US | 6 311 613 802 $ US |
| 2009 | 14 850 039 732 $ US | 12 887 642 730 $ US | 2 094 218 629 $ US |
| 2008 | 12 323 209 235 $ US | 4 800 867 627 $ US | 7 723 998 212 $ US |
| 2007 | 8 797 215 681 $ US | 2 728 636 257 $ US | 6 671 822 735 $ US |
| 2006 | 11 162 216 318 $ US | 5 460 638 693 $ US | 6 139 321 575 $ US |
| 2005 | 14 189 367 006 $ US | 9 118 138 923 $ US | 5 445 456 682 $ US |
| 2004 | 14 200 323 981 $ US | 9 526 626 747 $ US | 2 903 271 173 $ US |
| 2003 | 14 819 865 203 $ US | 9 697 339 029 $ US | 3 418 225 993 $ US |
| 2002 | 12 240 052 060 $ US | 7 662 256 435 $ US | 2 361 462 192 $ US |
| 2001 | 11 766 787 980 $ US | 7 417 912 528 $ US | 3 013 441 019 $ US |
| 2000 | 11 016 003 637 $ US | 6 641 091 066 $ US | 2 658 610 407 $ US |
| 1999 | 10 677 333 649 $ US | 6 658 239 752 $ US | 1 580 009 332 $ US |
| 1998 | 5 440 736 927 $ US | 3 886 364 988 $ US | −567 403 290 $ US |
| 1997 | 7 561 486 865 $ US | 5 368 625 431 $ US | 316 857 666 $ US |
| 1996 | 10 626 560 608 $ US | 7 532 134 259 $ US | 1 731 356 046 $ US |
| 1995 | 8 712 549 443 $ US | 6 527 696 652 $ US | 1 266 838 451 $ US |
| 1994 | 9 249 913 530 $ US | 7 441 280 660 $ US | 1 594 161 037 $ US |
| 1993 | 10 779 047 024 $ US | 7 719 024 401 $ US | 2 096 965 481 $ US |
| 1992 | 10 561 574 030 $ US | 7 057 702 438 $ US | 3 347 184 247 $ US |
| 1991 | 8 657 585 867 $ US | 4 747 887 892 $ US | 3 844 110 704 $ US |
| 1990 | 7 681 178 619 $ US | 4 874 814 870 $ US | 2 611 968 304 $ US |
| 1989 | 4 265 975 486 $ US | 2 424 571 081 $ US | 931 733 673 $ US |
| 1988 | 4 016 785 709 $ US | 1 882 882 683 $ US | 1 195 179 425 $ US |
| 1987 | 2 248 163 385 $ US | 794 922 270 $ US | 546 790 893 $ US |
| 1986 | −175 304 289 $ US | −1 049 633 472 $ US | 306 340 976 $ US |
| 1985 | 485 594 919 $ US | −763 979 700 $ US | 692 785 248 $ US |
| 1984 | 991 092 154 $ US | −195 099 749 $ US | 747 921 592 $ US |
| 1983 | 1 340 001 422 $ US | 251 744 360 $ US | 629 954 707 $ US |
| 1982 | 548 925 400 $ US | −794 268 391 $ US | 872 361 095 $ US |
| 1981 | 870 459 331 $ US | −927 332 645 $ US | 1 189 396 579 $ US |
| 1980 | −320 246 811 $ US | −2 103 581 763 $ US | 1 369 311 614 $ US |
| 1979 | −1 676 045 809 $ US | −3 025 659 260 $ US | 1 006 966 947 $ US |
| 1978 | −1 337 915 352 $ US | −2 356 088 159 $ US | 1 189 568 692 $ US |
| 1977 | −1 775 971 982 $ US | −2 714 869 280 $ US | 1 155 859 175 $ US |
| 1976 | −2 020 047 974 $ US | −2 877 829 877 $ US | 1 106 790 417 $ US |
| 1975 | −388 447 496 $ US | −1 304 097 568 $ US | 1 063 967 321 $ US |
| 1974 | −1 143 884 067 $ US | - | - |
| 1973 | −581 911 563 $ US | - | - |
| 1972 | −94 879 916 $ US | - | - |
| 1971 | −386 545 655 $ US | - | - |
| 1970 | −483 691 867 $ US | - | - |
| 1969 | −319 982 800 $ US | - | - |
| 1968 | −186 974 933 $ US | - | - |
| 1967 | −270 556 118 $ US | - | - |
| 1966 | −187 645 110 $ US | - | - |
En 2025, la balance commerciale du Danemark affichait un excédent de 50,9 milliards de dollars, contre un déficit de 188 millions de dollars en 1966. Le plus grand déficit a été de 2,02 milliards de dollars, en 1976. La balance commerciale du Danemark est excédentaire chaque année depuis 1987. Le commerce de biens affichait un excédent de 49,2 milliards de dollars et celui de services un excédent de 2,12 milliards de dollars.
En 2025, le solde commercial du Danemark était le 8e plus élevé de 41 pays situés en Europe, où les soldes allaient d'un déficit de 56,8 milliards de dollars en Ukraine à un excédent de 290 milliards de dollars en Irlande. De 2016 à 2025, les soldes commerciaux du Danemark ont totalisé un excédent de 293 milliards de dollars, contre un excédent de 173 milliards de dollars de 2006 à 2015. En 2025, les transactions courantes du Danemark affichaient un excédent de 12,6 % du PIB.
Commerce de biens du Danemark avec ses 10 principaux partenaires commerciaux, selon le Danemark, 2025
| Pays | Exportations vers | Importations depuis | Solde | |
|---|---|---|---|---|
 Allemagne |
19,2 Md $US | 26,3 Md $US | −7,11 Md $US | |
 Suède |
11,7 Md $US | 15,7 Md $US | −4,00 Md $US | vs Suède |
 Pays-Bas |
8,01 Md $US | 12,0 Md $US | −3,94 Md $US | vs Pays-Bas |
 Norvège |
7,85 Md $US | 6,47 Md $US | +1,39 Md $US | vs Norvège |
 États-Unis |
8,16 Md $US | 5,77 Md $US | +2,39 Md $US | vs USA |
 Chine |
3,45 Md $US | 9,81 Md $US | −6,36 Md $US | |
 Pologne |
6,52 Md $US | 6,59 Md $US | −62,2 M $US | vs Pologne |
 Royaume-Uni |
6,01 Md $US | 3,45 Md $US | +2,56 Md $US | vs R.-U. |
 France |
4,42 Md $US | 4,49 Md $US | −63,4 M $US | vs France |
 Italie |
3,11 Md $US | 4,97 Md $US | −1,86 Md $US | vs Italie |
Balance commerciale du Danemark : excédent (+) ou déficit (−)
| Biens et services, $ US, 2025 | +50,9 Md $US |
|---|---|
| % du PIB, 2025 | +11,0 % |
| Années d'excédent, 2000–2025 | 26 |
| Biens, $ US, 2025 | +49,2 Md $US |
| Services, $ US, 2025 | +2,12 Md $US |
| Premier excédent en biens, 2025 | Royaume-Uni +2,56 Md $US |
| Premier déficit en biens, 2025 | Allemagne −7,11 Md $US |
Comparer la balance commerciale du Danemark avec celle d'autres pays
Sources :
- TradeMap (2025, mis à jour en octobre 2026)
- Banque mondiale | Économie et croissance (1966–2025, mis à jour en octobre 2026)
Creative Commons Attribution (CC BY) : vous pouvez copier, partager, adapter et réutiliser ce contenu, y compris à des fins commerciales, à condition de citer statistics.wiki et d’indiquer les modifications apportées. Les sources citées ci-dessus peuvent avoir leurs propres conditions de licence.