
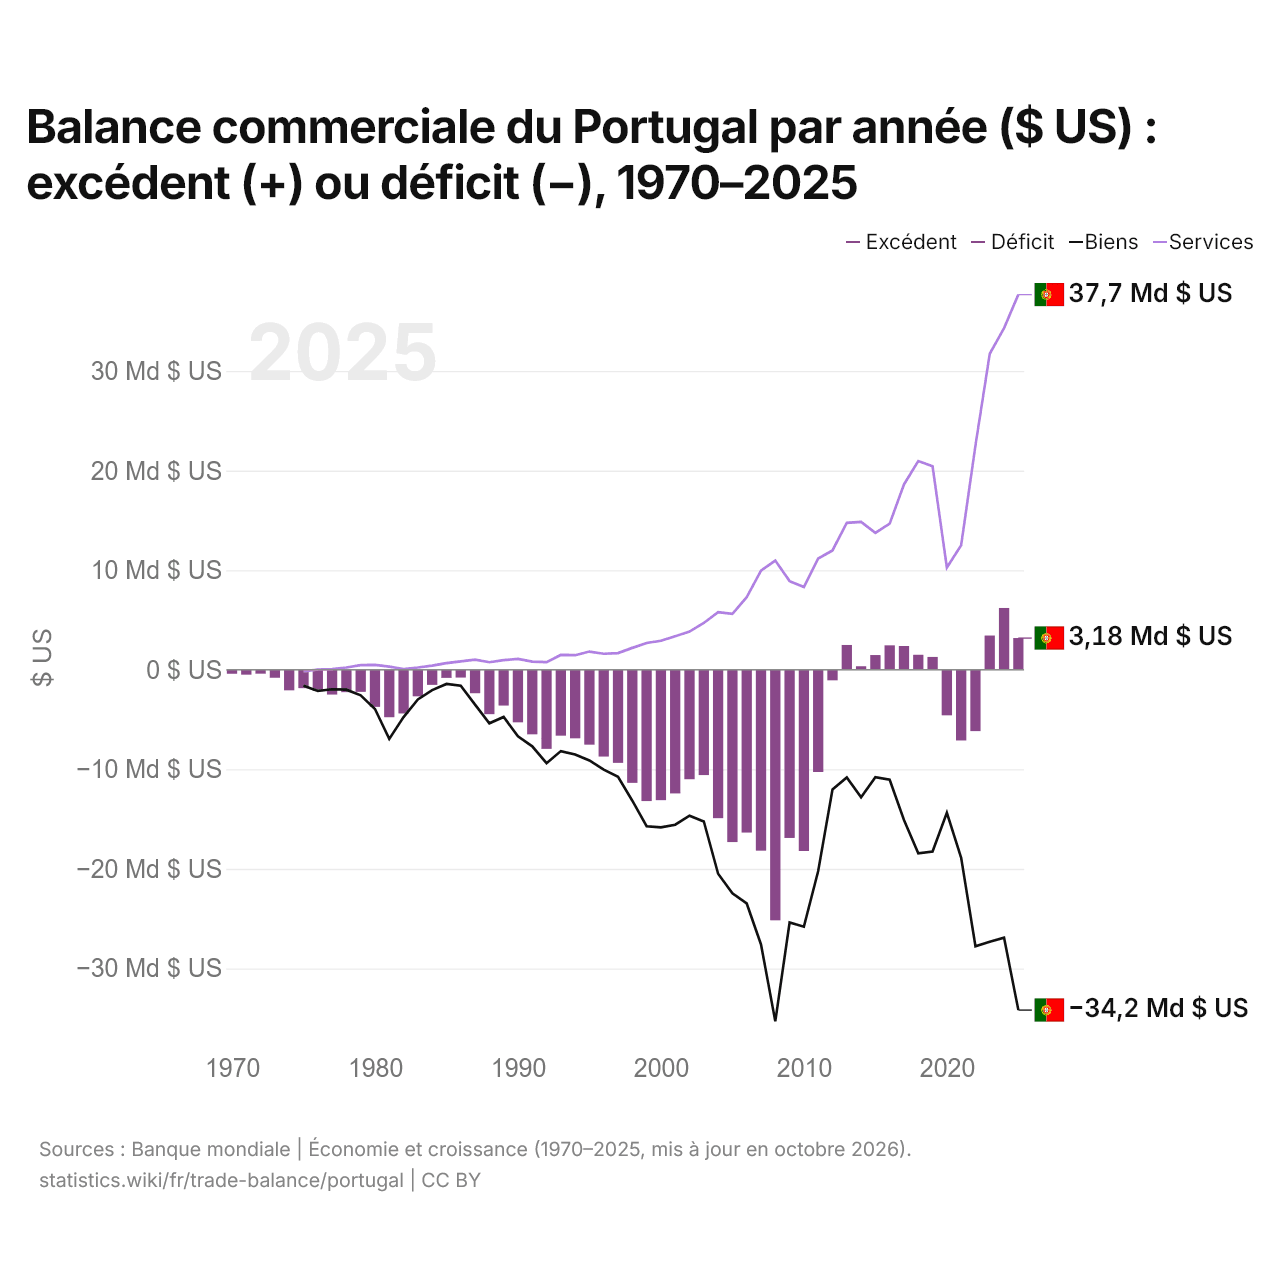
Balance commerciale du Portugal par année ($ US) : excédent (+) ou déficit (−), 1970–2025
| Année | $ US | ||
|---|---|---|---|
| Biens et services | Biens | Services | |
| 2025 | 3 179 729 609 $ US | −34 180 219 526 $ US | 37 664 812 271 $ US |
| 2024 | 6 203 529 441 $ US | −26 903 431 068 $ US | 34 300 932 567 $ US |
| 2023 | 3 435 097 440 $ US | −27 318 590 420 $ US | 31 727 486 806 $ US |
| 2022 | −6 167 577 402 $ US | −27 769 920 326 $ US | 22 529 949 907 $ US |
| 2021 | −7 109 880 156 $ US | −18 879 307 775 $ US | 12 493 651 735 $ US |
| 2020 | −4 584 592 430 $ US | −14 363 688 585 $ US | 10 258 936 184 $ US |
| 2019 | 1 285 251 893 $ US | −18 261 900 848 $ US | 20 431 154 122 $ US |
| 2018 | 1 499 682 322 $ US | −18 440 526 042 $ US | 20 953 306 638 $ US |
| 2017 | 2 379 942 262 $ US | −15 090 025 833 $ US | 18 603 501 348 $ US |
| 2016 | 2 450 560 626 $ US | −11 050 223 777 $ US | 14 673 830 501 $ US |
| 2015 | 1 474 193 135 $ US | −10 802 485 226 $ US | 13 752 053 109 $ US |
| 2014 | 343 995 351 $ US | −12 805 869 252 $ US | 14 850 713 059 $ US |
| 2013 | 2 487 546 494 $ US | −10 815 866 020 $ US | 14 751 146 575 $ US |
| 2012 | −1 069 897 488 $ US | −12 018 221 040 $ US | 11 978 942 423 $ US |
| 2011 | −10 270 004 539 $ US | −20 219 068 227 $ US | 11 170 440 309 $ US |
| 2010 | −18 202 971 435 $ US | −25 804 850 248 $ US | 8 307 923 555 $ US |
| 2009 | −16 894 818 154 $ US | −25 385 355 969 $ US | 8 895 309 645 $ US |
| 2008 | −25 165 708 546 $ US | −35 311 664 808 $ US | 10 959 344 066 $ US |
| 2007 | −18 176 093 820 $ US | −27 589 229 717 $ US | 9 957 512 267 $ US |
| 2006 | −16 350 314 966 $ US | −23 475 681 591 $ US | 7 284 461 725 $ US |
| 2005 | −17 311 334 503 $ US | −22 449 508 546 $ US | 5 613 706 797 $ US |
| 2004 | −14 905 302 070 $ US | −20 490 688 177 $ US | 5 781 562 320 $ US |
| 2003 | −10 582 015 649 $ US | −15 234 549 430 $ US | 4 692 863 398 $ US |
| 2002 | −11 001 387 196 $ US | −14 655 054 582 $ US | 3 832 876 084 $ US |
| 2001 | −12 424 660 029 $ US | −15 567 803 390 $ US | 3 352 324 330 $ US |
| 2000 | −13 098 469 052 $ US | −15 830 283 293 $ US | 2 903 968 078 $ US |
| 1999 | −13 193 669 762 $ US | −15 716 533 833 $ US | 2 688 568 721 $ US |
| 1998 | −11 362 958 593 $ US | −13 153 024 196 $ US | 2 193 499 407 $ US |
| 1997 | −9 357 416 810 $ US | −10 742 978 342 $ US | 1 672 751 719 $ US |
| 1996 | −8 722 525 344 $ US | −10 041 102 004 $ US | 1 600 309 466 $ US |
| 1995 | −7 530 287 913 $ US | −9 107 658 127 $ US | 1 822 676 974 $ US |
| 1994 | −6 888 712 560 $ US | −8 510 619 636 $ US | 1 458 686 797 $ US |
| 1993 | −6 626 869 468 $ US | −8 170 847 300 $ US | 1 485 486 579 $ US |
| 1992 | −7 950 987 526 $ US | −9 386 998 253 $ US | 765 678 534 $ US |
| 1991 | −6 488 605 522 $ US | −7 688 428 020 $ US | 811 632 129 $ US |
| 1990 | −5 287 396 991 $ US | −6 683 543 554 $ US | 1 091 072 937 $ US |
| 1989 | −3 598 389 356 $ US | −4 742 460 062 $ US | 958 480 916 $ US |
| 1988 | −4 466 105 850 $ US | −5 376 934 965 $ US | 749 754 036 $ US |
| 1987 | −2 360 348 655 $ US | −3 512 678 629 $ US | 1 008 021 756 $ US |
| 1986 | −786 655 944 $ US | −1 611 179 849 $ US | 839 104 416 $ US |
| 1985 | −822 089 658 $ US | −1 429 708 231 $ US | 662 008 029 $ US |
| 1984 | −1 526 440 701 $ US | −2 050 733 216 $ US | 412 554 163 $ US |
| 1983 | −2 676 254 072 $ US | −2 985 078 596 $ US | 224 269 787 $ US |
| 1982 | −4 394 442 482 $ US | −4 759 310 072 $ US | 74 017 630 $ US |
| 1981 | −4 769 358 306 $ US | −6 947 527 687 $ US | 307 516 044 $ US |
| 1980 | −3 725 442 531 $ US | −3 943 308 887 $ US | 481 265 898 $ US |
| 1979 | −2 220 319 672 $ US | −2 574 776 838 $ US | 464 293 072 $ US |
| 1978 | −2 256 546 533 $ US | −2 001 130 728 $ US | 226 827 444 $ US |
| 1977 | −2 499 565 217 $ US | −1 963 748 961 $ US | 54 828 408 $ US |
| 1976 | −2 113 779 841 $ US | −2 135 769 964 $ US | 25 898 414 $ US |
| 1975 | −1 851 043 137 $ US | −1 602 775 628 $ US | −168 848 209 $ US |
| 1974 | −2 073 433 307 $ US | - | - |
| 1973 | −808 299 264 $ US | - | - |
| 1972 | −399 770 200 $ US | - | - |
| 1971 | −494 459 364 $ US | - | - |
| 1970 | −404 839 609 $ US | - | - |
En 2025, la balance commerciale du Portugal affichait un excédent de 3,18 milliards de dollars, contre un déficit de 405 millions de dollars en 1970. Le plus grand déficit a été de 25,2 milliards de dollars, en 2008, et le plus grand excédent de 6,2 milliards de dollars, en 2024. La balance commerciale du Portugal est excédentaire chaque année depuis 2023.
En 2025, le solde commercial du Portugal était le 20e plus élevé de 41 pays situés en Europe, où les soldes allaient d'un déficit de 56,8 milliards de dollars en Ukraine à un excédent de 290 milliards de dollars en Irlande. De 2016 à 2025, les soldes commerciaux du Portugal ont totalisé un excédent de 2,57 milliards de dollars, contre un déficit de 102 milliards de dollars de 2006 à 2015. En 2025, les transactions courantes du Portugal affichaient un excédent de 1,2 % du PIB.
Commerce de biens du Portugal avec ses 10 principaux partenaires commerciaux, selon le Portugal, 2025
| Pays | Exportations vers | Importations depuis | Solde | |
|---|---|---|---|---|
 Espagne |
23,3 Md $US | 41,4 Md $US | −18,1 Md $US | vs Espagne |
 Allemagne |
12,4 Md $US | 14,9 Md $US | −2,52 Md $US | |
 France |
10,7 Md $US | 9,18 Md $US | +1,57 Md $US | vs France |
 Pays-Bas |
2,96 Md $US | 7,53 Md $US | −4,58 Md $US | vs Pays-Bas |
 Italie |
4,00 Md $US | 6,35 Md $US | −2,35 Md $US | vs Italie |
 États-Unis |
5,18 Md $US | 2,71 Md $US | +2,48 Md $US | |
 Chine |
711 M $US | 6,62 Md $US | −5,91 Md $US | |
 Belgique |
2,30 Md $US | 4,18 Md $US | −1,88 Md $US | vs Belgique |
 Royaume-Uni |
4,04 Md $US | 1,32 Md $US | +2,72 Md $US | vs R.-U. |
 Brésil |
1,20 Md $US | 3,04 Md $US | −1,83 Md $US | vs Brésil |
Balance commerciale du Portugal : excédent (+) ou déficit (−)
| Biens et services, $ US, 2025 | +3,18 Md $US |
|---|---|
| % du PIB, 2025 | +0,9 % |
| Années d'excédent, 2000–2025 | 10 |
| Biens, $ US, 2025 | −34,2 Md $US |
| Services, $ US, 2025 | +37,7 Md $US |
| Premier excédent en biens, 2025 | Royaume-Uni +2,72 Md $US |
| Premier déficit en biens, 2025 | Espagne −18,1 Md $US |
Comparer la balance commerciale du Portugal avec celle d'autres pays
Sources :
- TradeMap (2025, mis à jour en octobre 2026)
- Banque mondiale | Économie et croissance (1970–2025, mis à jour en octobre 2026)
Creative Commons Attribution (CC BY) : vous pouvez copier, partager, adapter et réutiliser ce contenu, y compris à des fins commerciales, à condition de citer statistics.wiki et d’indiquer les modifications apportées. Les sources citées ci-dessus peuvent avoir leurs propres conditions de licence.