
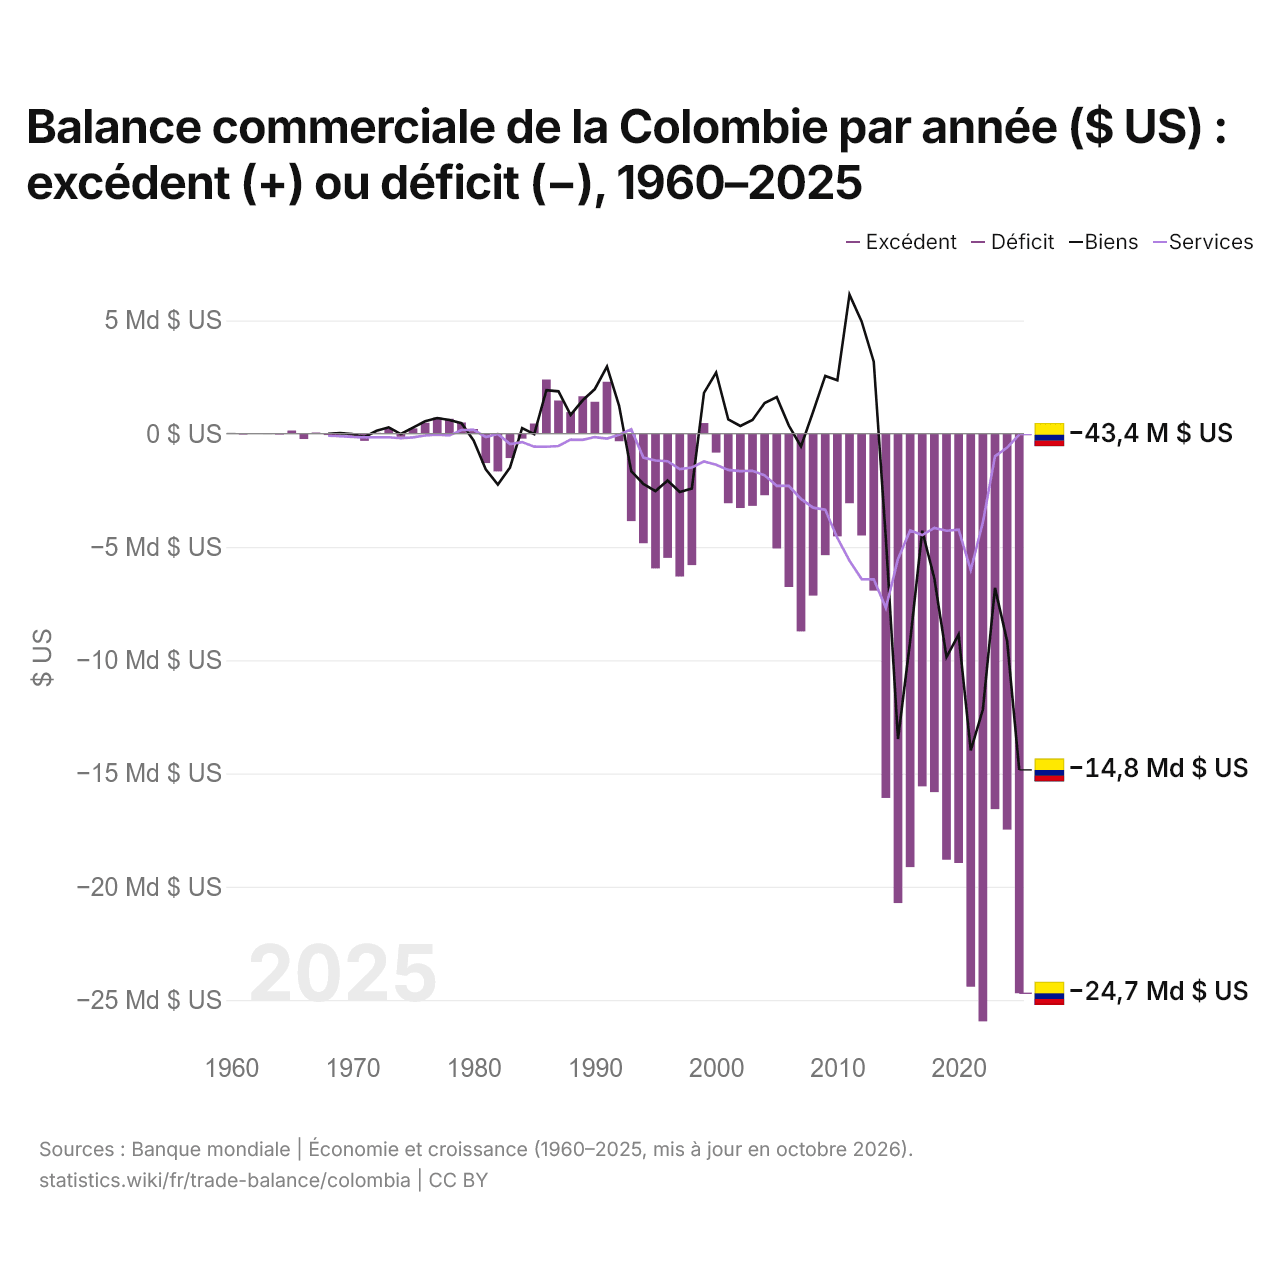
Balance commerciale de la Colombie par année ($ US) : excédent (+) ou déficit (−), 1960–2025
| Année | $ US | ||
|---|---|---|---|
| Biens et services | Biens | Services | |
| 2025 | −24 704 082 006 $ US | −14 842 660 707 $ US | −43 447 490 $ US |
| 2024 | −17 480 709 488 $ US | −9 155 769 854 $ US | −614 528 306 $ US |
| 2023 | −16 575 761 884 $ US | −6 807 557 955 $ US | −998 049 740 $ US |
| 2022 | −25 942 895 382 $ US | −12 178 248 980 $ US | −3 917 872 218 $ US |
| 2021 | −24 415 341 501 $ US | −13 983 641 290 $ US | −6 017 037 869 $ US |
| 2020 | −18 954 175 958 $ US | −8 869 788 062 $ US | −4 234 963 092 $ US |
| 2019 | −18 808 380 841 $ US | −9 862 769 301 $ US | −4 285 393 143 $ US |
| 2018 | −15 825 333 144 $ US | −6 393 954 919 $ US | −4 162 237 067 $ US |
| 2017 | −15 569 440 552 $ US | −4 284 562 802 $ US | −4 476 946 125 $ US |
| 2016 | −19 135 554 970 $ US | −9 175 715 828 $ US | −4 275 413 481 $ US |
| 2015 | −20 721 562 437 $ US | −13 478 638 990 $ US | −5 525 742 519 $ US |
| 2014 | −16 080 615 460 $ US | −4 640 595 462 $ US | −7 691 681 014 $ US |
| 2013 | −6 930 298 385 $ US | 3 179 224 324 $ US | −6 429 722 182 $ US |
| 2012 | −4 495 521 441 $ US | 4 955 574 180 $ US | −6 420 566 549 $ US |
| 2011 | −3 073 024 233 $ US | 6 136 645 906 $ US | −5 609 072 536 $ US |
| 2010 | −4 535 024 401 $ US | 2 356 082 726 $ US | −4 602 232 940 $ US |
| 2009 | −5 363 370 848 $ US | 2 549 259 679 $ US | −3 354 987 406 $ US |
| 2008 | −7 150 135 805 $ US | 964 580 574 $ US | −3 266 978 118 $ US |
| 2007 | −8 728 898 041 $ US | −560 519 605 $ US | −2 880 952 412 $ US |
| 2006 | −6 769 709 371 $ US | 356 227 892 $ US | −2 307 772 363 $ US |
| 2005 | −5 067 786 618 $ US | 1 614 296 443 $ US | −2 304 910 890 $ US |
| 2004 | −2 718 797 023 $ US | 1 356 442 846 $ US | −1 839 576 532 $ US |
| 2003 | −3 185 356 027 $ US | 602 819 355 $ US | −1 635 550 586 $ US |
| 2002 | −3 282 653 778 $ US | 342 589 385 $ US | −1 656 217 913 $ US |
| 2001 | −3 070 577 187 $ US | 630 741 235 $ US | −1 601 279 606 $ US |
| 2000 | −835 760 658 $ US | 2 702 195 629 $ US | −1 373 528 715 $ US |
| 1999 | 468 747 717 $ US | 1 800 049 007 $ US | −1 228 472 895 $ US |
| 1998 | −5 802 491 966 $ US | −2 418 093 033 $ US | −1 493 231 439 $ US |
| 1997 | −6 307 822 629 $ US | −2 578 100 549 $ US | −1 559 982 954 $ US |
| 1996 | −5 484 866 733 $ US | −2 068 231 473 $ US | −1 216 458 028 $ US |
| 1995 | −5 947 981 745 $ US | −2 535 577 465 $ US | −1 182 945 728 $ US |
| 1994 | −4 837 512 138 $ US | −2 222 771 378 $ US | −1 054 701 167 $ US |
| 1993 | −3 859 549 948 $ US | −1 657 200 000 $ US | 199 200 000 $ US |
| 1992 | −335 606 528 $ US | 1 234 100 000 $ US | −45 400 000 $ US |
| 1991 | 2 291 168 154 $ US | 2 959 000 000 $ US | −219 000 000 $ US |
| 1990 | 1 410 217 815 $ US | 1 971 000 000 $ US | −150 000 000 $ US |
| 1989 | 1 654 161 222 $ US | 1 474 000 000 $ US | −274 000 000 $ US |
| 1988 | 952 681 941 $ US | 827 000 000 $ US | −262 000 000 $ US |
| 1987 | 1 467 222 463 $ US | 1 868 000 000 $ US | −543 000 000 $ US |
| 1986 | 2 391 414 017 $ US | 1 922 000 000 $ US | −576 000 000 $ US |
| 1985 | 447 503 614 $ US | −23 000 000 $ US | −572 000 000 $ US |
| 1984 | −221 548 838 $ US | 246 000 000 $ US | −371 000 000 $ US |
| 1983 | −1 076 993 311 $ US | −1 494 000 000 $ US | −458 000 000 $ US |
| 1982 | −1 667 093 178 $ US | −2 243 789 480 $ US | −10 974 940 $ US |
| 1981 | −1 297 945 281 $ US | −1 572 367 360 $ US | −146 693 240 $ US |
| 1980 | 207 410 165 $ US | −297 110 710 $ US | 171 514 870 $ US |
| 1979 | 494 919 891 $ US | 463 216 000 $ US | 164 048 000 $ US |
| 1978 | 657 756 746 $ US | 603 240 000 $ US | −77 284 000 $ US |
| 1977 | 713 978 822 $ US | 690 305 760 $ US | −43 288 960 $ US |
| 1976 | 483 441 418 $ US | 547 877 720 $ US | −79 545 200 $ US |
| 1975 | 236 520 896 $ US | 268 242 100 $ US | −166 063 150 $ US |
| 1974 | −134 872 245 $ US | −16 854 800 $ US | −200 369 600 $ US |
| 1973 | 233 160 951 $ US | 279 840 370 $ US | −158 365 780 $ US |
| 1972 | 39 603 598 $ US | 128 999 400 $ US | −157 342 390 $ US |
| 1971 | −316 756 383 $ US | −148 345 680 $ US | −164 378 460 $ US |
| 1970 | −92 440 984 $ US | −14 000 000 $ US | −142 000 000 $ US |
| 1969 | −30 308 803 $ US | 24 000 000 $ US | −105 000 000 $ US |
| 1968 | −61 871 996 $ US | −10 000 000 $ US | −85 000 000 $ US |
| 1967 | 50 735 178 $ US | - | - |
| 1966 | −236 962 963 $ US | - | - |
| 1965 | 139 714 286 $ US | - | - |
| 1964 | −41 462 556 $ US | - | - |
| 1963 | −17 774 811 $ US | - | - |
| 1962 | −188 605 $ US | - | - |
| 1961 | −38 069 179 $ US | - | - |
| 1960 | 37 777 800 $ US | - | - |
En 2025, la balance commerciale de la Colombie affichait un déficit de 24,7 milliards de dollars, contre un excédent de 37,8 millions de dollars en 1960. Le plus grand déficit a été de 25,9 milliards de dollars, en 2022, et le plus grand excédent de 2,39 milliards de dollars, en 1986. La balance commerciale de la Colombie est déficitaire chaque année depuis 2000.
En 2025, le déficit commercial de la Colombie était le plus élevé de 26 pays situés en Amérique latine, devant le Guatemala (déficit de 19 milliards de dollars). De 2016 à 2025, les soldes commerciaux de la Colombie ont totalisé un déficit de 197 milliards de dollars, contre un déficit de 83,8 milliards de dollars de 2006 à 2015. En 2025, les transactions courantes de la Colombie affichaient un déficit de 2,4 % du PIB.
Commerce de biens de la Colombie avec ses 10 principaux partenaires commerciaux, selon la Colombie, 2025
| Pays | Exportations vers | Importations depuis | Solde | |
|---|---|---|---|---|
 États-Unis |
15,4 Md $US | 16,4 Md $US | −959 M $US | vs USA |
 Chine |
1,65 Md $US | 19,4 Md $US | −17,7 Md $US | |
 Brésil |
1,90 Md $US | 3,52 Md $US | −1,62 Md $US | vs Brésil |
 Mexique |
1,59 Md $US | 3,54 Md $US | −1,94 Md $US | vs Mexique |
 Inde |
2,17 Md $US | 1,75 Md $US | +428 M $US | |
 Panama |
3,68 Md $US | 31,5 M $US | +3,65 Md $US | |
 Allemagne |
869 M $US | 2,32 Md $US | −1,45 Md $US | |
 Équateur |
1,85 Md $US | 858 M $US | +989 M $US | vs Équateur |
 Pérou |
1,56 Md $US | 1,11 Md $US | +457 M $US | vs Pérou |
 Canada |
1,64 Md $US | 1,00 Md $US | +641 M $US | vs Canada |
Balance commerciale de la Colombie : excédent (+) ou déficit (−)
Comparer la balance commerciale de la Colombie avec celle d'autres pays
Sources :
- TradeMap (2025, mis à jour en octobre 2026)
- Banque mondiale | Économie et croissance (1960–2025, mis à jour en octobre 2026)
Creative Commons Attribution (CC BY) : vous pouvez copier, partager, adapter et réutiliser ce contenu, y compris à des fins commerciales, à condition de citer statistics.wiki et d’indiquer les modifications apportées. Les sources citées ci-dessus peuvent avoir leurs propres conditions de licence.