
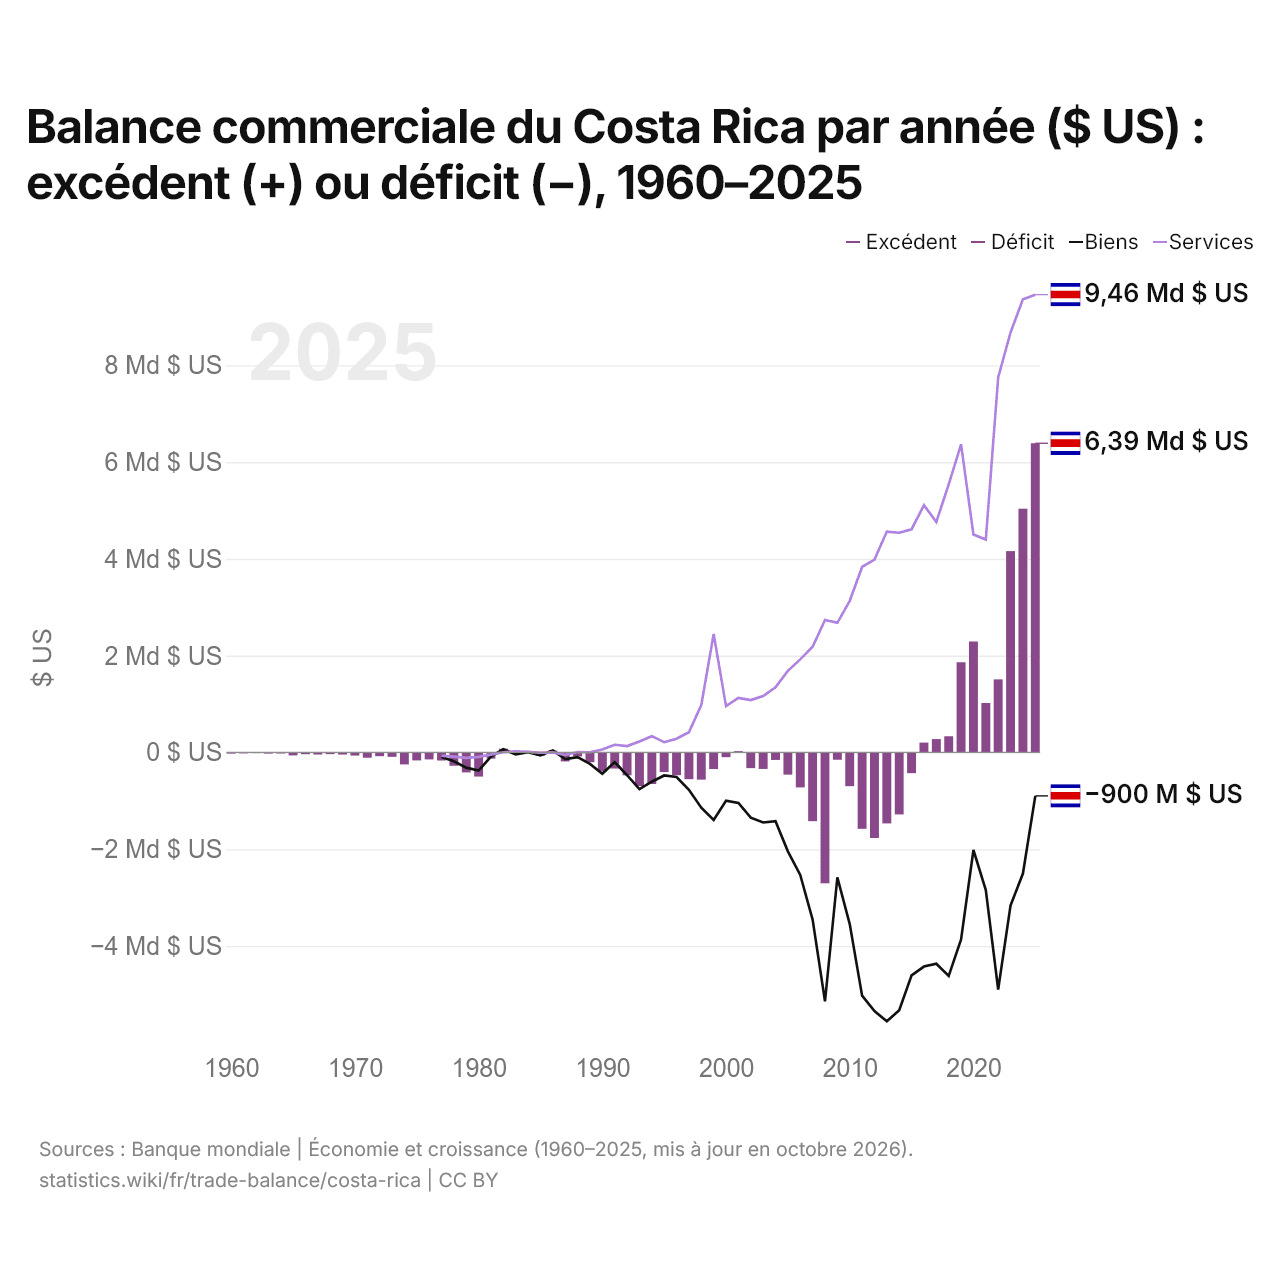
Balance commerciale du Costa Rica par année ($ US) : excédent (+) ou déficit (−), 1960–2025
| Année | $ US | ||
|---|---|---|---|
| Biens et services | Biens | Services | |
| 2025 | 6 388 241 982 $ US | −900 035 788 $ US | 9 459 647 181 $ US |
| 2024 | 5 035 307 503 $ US | −2 504 689 937 $ US | 9 364 510 532 $ US |
| 2023 | 4 159 883 783 $ US | −3 162 710 478 $ US | 8 678 095 921 $ US |
| 2022 | 1 508 939 813 $ US | −4 900 646 981 $ US | 7 748 517 794 $ US |
| 2021 | 1 020 579 727 $ US | −2 844 465 646 $ US | 4 399 442 352 $ US |
| 2020 | 2 291 858 848 $ US | −2 018 318 132 $ US | 4 501 683 896 $ US |
| 2019 | 1 861 743 506 $ US | −3 868 481 623 $ US | 6 366 512 131 $ US |
| 2018 | 331 875 262 $ US | −4 619 866 055 $ US | 5 538 872 947 $ US |
| 2017 | 274 387 327 $ US | −4 367 046 881 $ US | 4 760 375 217 $ US |
| 2016 | 201 088 459 $ US | −4 426 065 625 $ US | 5 109 843 130 $ US |
| 2015 | −430 226 387 $ US | −4 607 090 132 $ US | 4 608 648 756 $ US |
| 2014 | −1 282 418 430 $ US | −5 328 762 130 $ US | 4 539 334 159 $ US |
| 2013 | −1 468 936 015 $ US | −5 558 816 831 $ US | 4 563 607 495 $ US |
| 2012 | −1 769 252 761 $ US | −5 347 973 288 $ US | 3 984 304 221 $ US |
| 2011 | −1 579 738 366 $ US | −5 027 329 796 $ US | 3 832 785 012 $ US |
| 2010 | −697 914 668 $ US | −3 547 874 028 $ US | 3 132 124 020 $ US |
| 2009 | −152 101 398 $ US | −2 581 921 426 $ US | 2 677 621 601 $ US |
| 2008 | −2 707 039 847 $ US | −5 145 159 854 $ US | 2 737 609 055 $ US |
| 2007 | −1 422 824 731 $ US | −3 455 241 307 $ US | 2 183 753 514 $ US |
| 2006 | −723 827 090 $ US | −2 532 540 001 $ US | 1 921 525 238 $ US |
| 2005 | −459 655 981 $ US | −2 046 085 270 $ US | 1 685 429 271 $ US |
| 2004 | −156 546 480 $ US | −1 422 036 935 $ US | 1 344 931 791 $ US |
| 2003 | −342 720 363 $ US | −1 448 498 488 $ US | 1 164 960 623 $ US |
| 2002 | −325 752 876 $ US | −1 350 055 394 $ US | 1 082 189 965 $ US |
| 2001 | 26 262 657 $ US | −1 045 688 560 $ US | 1 124 569 790 $ US |
| 2000 | −99 732 308 $ US | −1 001 068 046 $ US | 955 398 334 $ US |
| 1999 | −345 378 745 $ US | −1 395 111 553 $ US | 2 446 322 963 $ US |
| 1998 | −562 742 719 $ US | −1 142 700 000 $ US | 977 250 000 $ US |
| 1997 | −554 419 175 $ US | −772 660 000 $ US | 415 244 000 $ US |
| 1996 | −471 011 506 $ US | −509 770 000 $ US | 280 860 000 $ US |
| 1995 | −407 096 810 $ US | −476 700 000 $ US | 210 158 000 $ US |
| 1994 | −653 309 769 $ US | −605 800 000 $ US | 334 900 000 $ US |
| 1993 | −696 116 962 $ US | −760 800 000 $ US | 222 900 000 $ US |
| 1992 | −474 694 622 $ US | −471 800 000 $ US | 130 700 000 $ US |
| 1991 | −333 904 177 $ US | −199 500 000 $ US | 156 600 000 $ US |
| 1990 | −394 370 767 $ US | −442 500 000 $ US | 59 300 000 $ US |
| 1989 | −203 773 887 $ US | −238 600 000 $ US | 1 900 000 $ US |
| 1988 | −82 456 788 $ US | −97 900 000 $ US | 6 600 000 $ US |
| 1987 | −187 400 032 $ US | −138 500 000 $ US | −54 000 000 $ US |
| 1986 | 37 374 552 $ US | 39 600 000 $ US | −600 000 $ US |
| 1985 | −68 700 990 $ US | −61 900 000 $ US | −7 000 000 $ US |
| 1984 | 15 024 920 $ US | 4 600 000 $ US | 11 200 000 $ US |
| 1983 | −23 463 184 $ US | −41 800 000 $ US | 21 800 000 $ US |
| 1982 | 76 088 041 $ US | 64 100 000 $ US | 1 900 000 $ US |
| 1981 | −128 771 636 $ US | −88 000 000 $ US | −46 200 000 $ US |
| 1980 | −499 626 604 $ US | −374 300 000 $ US | −92 000 000 $ US |
| 1979 | −414 469 078 $ US | −315 100 000 $ US | −112 000 000 $ US |
| 1978 | −276 581 097 $ US | −185 500 000 $ US | −86 800 000 $ US |
| 1977 | −167 934 656 $ US | −97 300 000 $ US | −69 100 000 $ US |
| 1976 | −144 795 799 $ US | - | - |
| 1975 | −166 394 399 $ US | - | - |
| 1974 | −249 609 079 $ US | - | - |
| 1973 | −92 857 300 $ US | - | - |
| 1972 | −78 975 132 $ US | - | - |
| 1971 | −111 065 280 $ US | - | - |
| 1970 | −66 415 094 $ US | - | - |
| 1969 | −45 720 755 $ US | - | - |
| 1968 | −36 286 792 $ US | - | - |
| 1967 | −44 332 075 $ US | - | - |
| 1966 | −38 792 453 $ US | - | - |
| 1965 | −63 003 774 $ US | - | - |
| 1964 | −22 510 940 $ US | - | - |
| 1963 | −25 804 123 $ US | - | - |
| 1962 | −15 939 610 $ US | - | - |
| 1961 | −20 571 792 $ US | - | - |
| 1960 | −24 821 248 $ US | - | - |
En 2025, la balance commerciale du Costa Rica affichait un excédent de 6,39 milliards de dollars, contre un déficit de 24,8 millions de dollars en 1960. Le plus grand déficit a été de 2,71 milliards de dollars, en 2008. La balance commerciale du Costa Rica est excédentaire chaque année depuis 2016.
En 2025, le solde commercial du Costa Rica était le 4e plus élevé de 26 pays situés en Amérique latine, où les soldes allaient d'un déficit de 24,7 milliards de dollars en Colombie à un excédent de 27,2 milliards de dollars au Pérou. De 2016 à 2025, les soldes commerciaux du Costa Rica ont totalisé un excédent de 23,1 milliards de dollars, contre un déficit de 12,2 milliards de dollars de 2006 à 2015. En 2025, les transactions courantes du Costa Rica affichaient un déficit de 0,5 % du PIB.
Commerce de biens du Costa Rica avec ses 10 principaux partenaires commerciaux, selon le Costa Rica, 2025
| Pays | Exportations vers | Importations depuis | Solde | |
|---|---|---|---|---|
 États-Unis |
10,8 Md $US | 9,24 Md $US | +1,59 Md $US | |
 Chine |
449 M $US | 4,63 Md $US | −4,18 Md $US | |
 Pays-Bas |
2,21 Md $US | 245 M $US | +1,97 Md $US | |
 Mexique |
313 M $US | 1,52 Md $US | −1,21 Md $US | |
 Guatemala |
1,04 Md $US | 622 M $US | +418 M $US | |
 Belgique |
1,08 Md $US | 119 M $US | +965 M $US | |
 Nicaragua |
818 M $US | 214 M $US | +604 M $US | |
 Japon |
414 M $US | 534 M $US | −120 M $US | |
 Panama |
613 M $US | 327 M $US | +286 M $US | vs Panama |
 Honduras |
685 M $US | 190 M $US | +495 M $US |
Balance commerciale du Costa Rica : excédent (+) ou déficit (−)
Comparer la balance commerciale du Costa Rica avec celle d'autres pays
Sources :
- TradeMap (2025, mis à jour en octobre 2026)
- Banque mondiale | Économie et croissance (1960–2025, mis à jour en octobre 2026)
Creative Commons Attribution (CC BY) : vous pouvez copier, partager, adapter et réutiliser ce contenu, y compris à des fins commerciales, à condition de citer statistics.wiki et d’indiquer les modifications apportées. Les sources citées ci-dessus peuvent avoir leurs propres conditions de licence.