
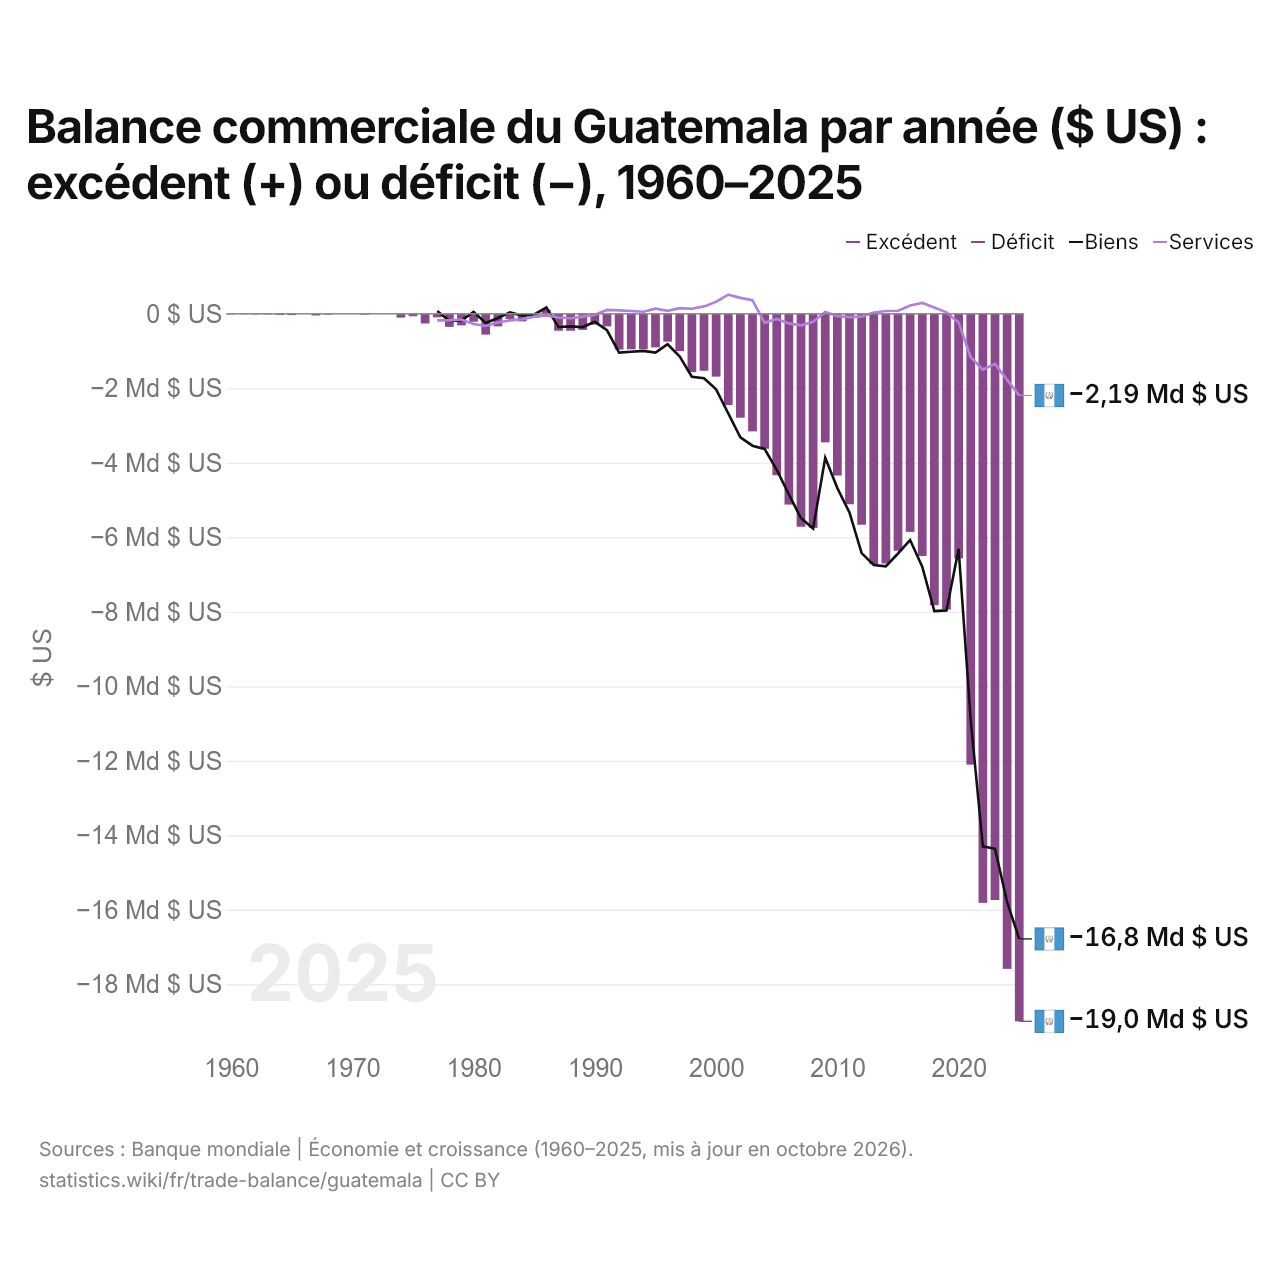
Balance commerciale du Guatemala par année ($ US) : excédent (+) ou déficit (−), 1960–2025
| Année | $ US | ||
|---|---|---|---|
| Biens et services | Biens | Services | |
| 2025 | −19 000 550 382 $ US | −16 787 650 830 $ US | −2 194 866 560 $ US |
| 2024 | −17 591 856 739 $ US | −15 798 702 390 $ US | −1 775 557 030 $ US |
| 2023 | −15 743 603 592 $ US | −14 367 701 980 $ US | −1 346 590 530 $ US |
| 2022 | −15 819 132 051 $ US | −14 303 756 920 $ US | −1 499 009 060 $ US |
| 2021 | −12 105 359 985 $ US | −10 927 593 400 $ US | −1 169 482 000 $ US |
| 2020 | −6 570 043 061 $ US | −6 314 179 850 $ US | −239 793 850 $ US |
| 2019 | −7 943 184 987 $ US | −7 966 906 040 $ US | 37 949 320 $ US |
| 2018 | −7 826 360 108 $ US | −7 984 768 160 $ US | 165 709 190 $ US |
| 2017 | −6 505 679 348 $ US | −6 791 459 130 $ US | 291 491 470 $ US |
| 2016 | −5 856 664 075 $ US | −6 077 063 670 $ US | 222 228 620 $ US |
| 2015 | −6 363 896 711 $ US | −6 439 153 300 $ US | 80 709 200 $ US |
| 2014 | −6 707 698 798 $ US | −6 782 069 190 $ US | 74 137 860 $ US |
| 2013 | −6 724 671 222 $ US | −6 749 027 780 $ US | 34 172 620 $ US |
| 2012 | −5 666 222 525 $ US | −6 428 200 740 $ US | −76 776 200 $ US |
| 2011 | −5 114 940 803 $ US | −5 339 951 130 $ US | −92 825 160 $ US |
| 2010 | −4 341 925 329 $ US | −4 682 567 520 $ US | −64 050 340 $ US |
| 2009 | −3 454 600 723 $ US | −3 865 367 360 $ US | 48 875 390 $ US |
| 2008 | −5 748 620 323 $ US | −5 765 141 270 $ US | −218 624 600 $ US |
| 2007 | −5 720 072 253 $ US | −5 487 000 000 $ US | −310 000 000 $ US |
| 2006 | −5 125 605 018 $ US | −4 852 300 000 $ US | −259 500 000 $ US |
| 2005 | −4 337 274 363 $ US | −4 190 600 000 $ US | −141 800 000 $ US |
| 2004 | −3 625 257 837 $ US | −3 631 900 000 $ US | −243 900 000 $ US |
| 2003 | −3 158 808 057 $ US | −3 543 984 301 $ US | 360 806 350 $ US |
| 2002 | −2 791 095 734 $ US | −3 317 851 355 $ US | 425 093 091 $ US |
| 2001 | −2 455 612 818 $ US | −2 677 232 267 $ US | 511 973 796 $ US |
| 2000 | −1 688 845 868 $ US | −2 029 000 000 $ US | 323 700 000 $ US |
| 1999 | −1 529 708 069 $ US | −1 732 800 000 $ US | 196 500 000 $ US |
| 1998 | −1 567 257 913 $ US | −1 693 800 000 $ US | 133 100 000 $ US |
| 1997 | −1 003 310 355 $ US | −1 152 000 000 $ US | 150 500 000 $ US |
| 1996 | −748 115 757 $ US | −819 000 000 $ US | 75 400 000 $ US |
| 1995 | −904 435 170 $ US | −1 041 600 000 $ US | 137 400 000 $ US |
| 1994 | −951 801 198 $ US | −996 500 000 $ US | 52 600 000 $ US |
| 1993 | −954 508 166 $ US | −1 020 800 000 $ US | 74 300 000 $ US |
| 1992 | −963 712 352 $ US | −1 044 100 000 $ US | 88 700 000 $ US |
| 1991 | −340 035 952 $ US | −443 000 000 $ US | 102 400 000 $ US |
| 1990 | −291 812 443 $ US | −216 600 000 $ US | −27 600 000 $ US |
| 1989 | −434 552 557 $ US | −358 300 000 $ US | −79 200 000 $ US |
| 1988 | −457 366 450 $ US | −339 900 000 $ US | −122 100 000 $ US |
| 1987 | −456 599 960 $ US | −355 300 000 $ US | −101 200 000 $ US |
| 1986 | 105 570 776 $ US | 168 100 000 $ US | −46 400 000 $ US |
| 1985 | −100 695 565 $ US | −17 000 000 $ US | −78 900 000 $ US |
| 1984 | −203 500 000 $ US | −50 000 000 $ US | −149 500 000 $ US |
| 1983 | −140 999 900 $ US | 35 700 000 $ US | −177 500 000 $ US |
| 1982 | −340 000 000 $ US | −113 900 000 $ US | −234 300 000 $ US |
| 1981 | −560 499 900 $ US | −248 700 000 $ US | −329 200 000 $ US |
| 1980 | −215 300 000 $ US | 47 200 000 $ US | −276 200 000 $ US |
| 1979 | −310 800 000 $ US | −180 300 000 $ US | −154 600 000 $ US |
| 1978 | −351 300 100 $ US | −191 400 000 $ US | −177 200 000 $ US |
| 1977 | −98 700 100 $ US | 73 200 000 $ US | −178 000 000 $ US |
| 1976 | −262 400 000 $ US | - | - |
| 1975 | −66 000 000 $ US | - | - |
| 1974 | −103 000 000 $ US | - | - |
| 1973 | 17 400 000 $ US | - | - |
| 1972 | 7 800 000 $ US | - | - |
| 1971 | −28 000 000 $ US | - | - |
| 1970 | 15 100 000 $ US | - | - |
| 1969 | 6 400 000 $ US | - | - |
| 1968 | −27 100 000 $ US | - | - |
| 1967 | −48 000 000 $ US | - | - |
| 1966 | −2 700 000 $ US | - | - |
| 1965 | −37 600 000 $ US | - | - |
| 1964 | −35 100 000 $ US | - | - |
| 1963 | −20 800 000 $ US | - | - |
| 1962 | −18 700 000 $ US | - | - |
| 1961 | −16 600 000 $ US | - | - |
| 1960 | −19 800 000 $ US | - | - |
En 2025, la balance commerciale du Guatemala affichait un déficit de 19 milliards de dollars, contre un déficit de 19,8 millions de dollars en 1960. Le plus grand excédent a été de 106 millions de dollars, en 1986. La balance commerciale du Guatemala est déficitaire chaque année depuis 1987. Le commerce de biens affichait un déficit de 16,8 milliards de dollars et celui de services un déficit de 2,19 milliards de dollars.
En 2025, le solde commercial du Guatemala était le 25e plus élevé de 26 pays situés en Amérique latine, où les soldes allaient d'un déficit de 24,7 milliards de dollars en Colombie à un excédent de 27,2 milliards de dollars au Pérou. De 2016 à 2025, les soldes commerciaux du Guatemala ont totalisé un déficit de 115 milliards de dollars, contre un déficit de 55 milliards de dollars de 2006 à 2015. En 2025, les transactions courantes du Guatemala affichaient un excédent de 4,7 % du PIB.
Commerce de biens du Guatemala avec ses 10 principaux partenaires commerciaux, selon le Guatemala, 2025
| Pays | Exportations vers | Importations depuis | Solde | |
|---|---|---|---|---|
 États-Unis |
4,81 Md $US | 10,9 Md $US | −6,09 Md $US | |
 Chine |
46,7 M $US | 5,50 Md $US | −5,46 Md $US | |
 Mexique |
688 M $US | 3,43 Md $US | −2,74 Md $US | vs Mexique |
 Salvador |
2,14 Md $US | 1,62 Md $US | +513 M $US | vs Salvador |
 Honduras |
1,78 Md $US | 954 M $US | +829 M $US | vs Honduras |
 Costa Rica |
667 M $US | 1,19 Md $US | −527 M $US | |
 Panama |
306 M $US | 1,28 Md $US | −970 M $US | |
 Nicaragua |
1,09 Md $US | 178 M $US | +911 M $US | |
 Canada |
291 M $US | 525 M $US | −233 M $US | |
 Inde |
34,2 M $US | 766 M $US | −732 M $US |
Balance commerciale du Guatemala : excédent (+) ou déficit (−)
| Biens et services, $ US, 2025 | −19,0 Md $US |
|---|---|
| % du PIB, 2025 | −15,4 % |
| Années d'excédent, 2000–2025 | 0 |
| Biens, $ US, 2025 | −16,8 Md $US |
| Services, $ US, 2025 | −2,19 Md $US |
| Premier excédent en biens, 2025 | Nicaragua +911 M $US |
| Premier déficit en biens, 2025 | États-Unis −6,09 Md $US |
Comparer la balance commerciale du Guatemala avec celle d'autres pays
Sources :
- TradeMap (2025, mis à jour en octobre 2026)
- Banque mondiale | Économie et croissance (1960–2025, mis à jour en octobre 2026)
Creative Commons Attribution (CC BY) : vous pouvez copier, partager, adapter et réutiliser ce contenu, y compris à des fins commerciales, à condition de citer statistics.wiki et d’indiquer les modifications apportées. Les sources citées ci-dessus peuvent avoir leurs propres conditions de licence.