
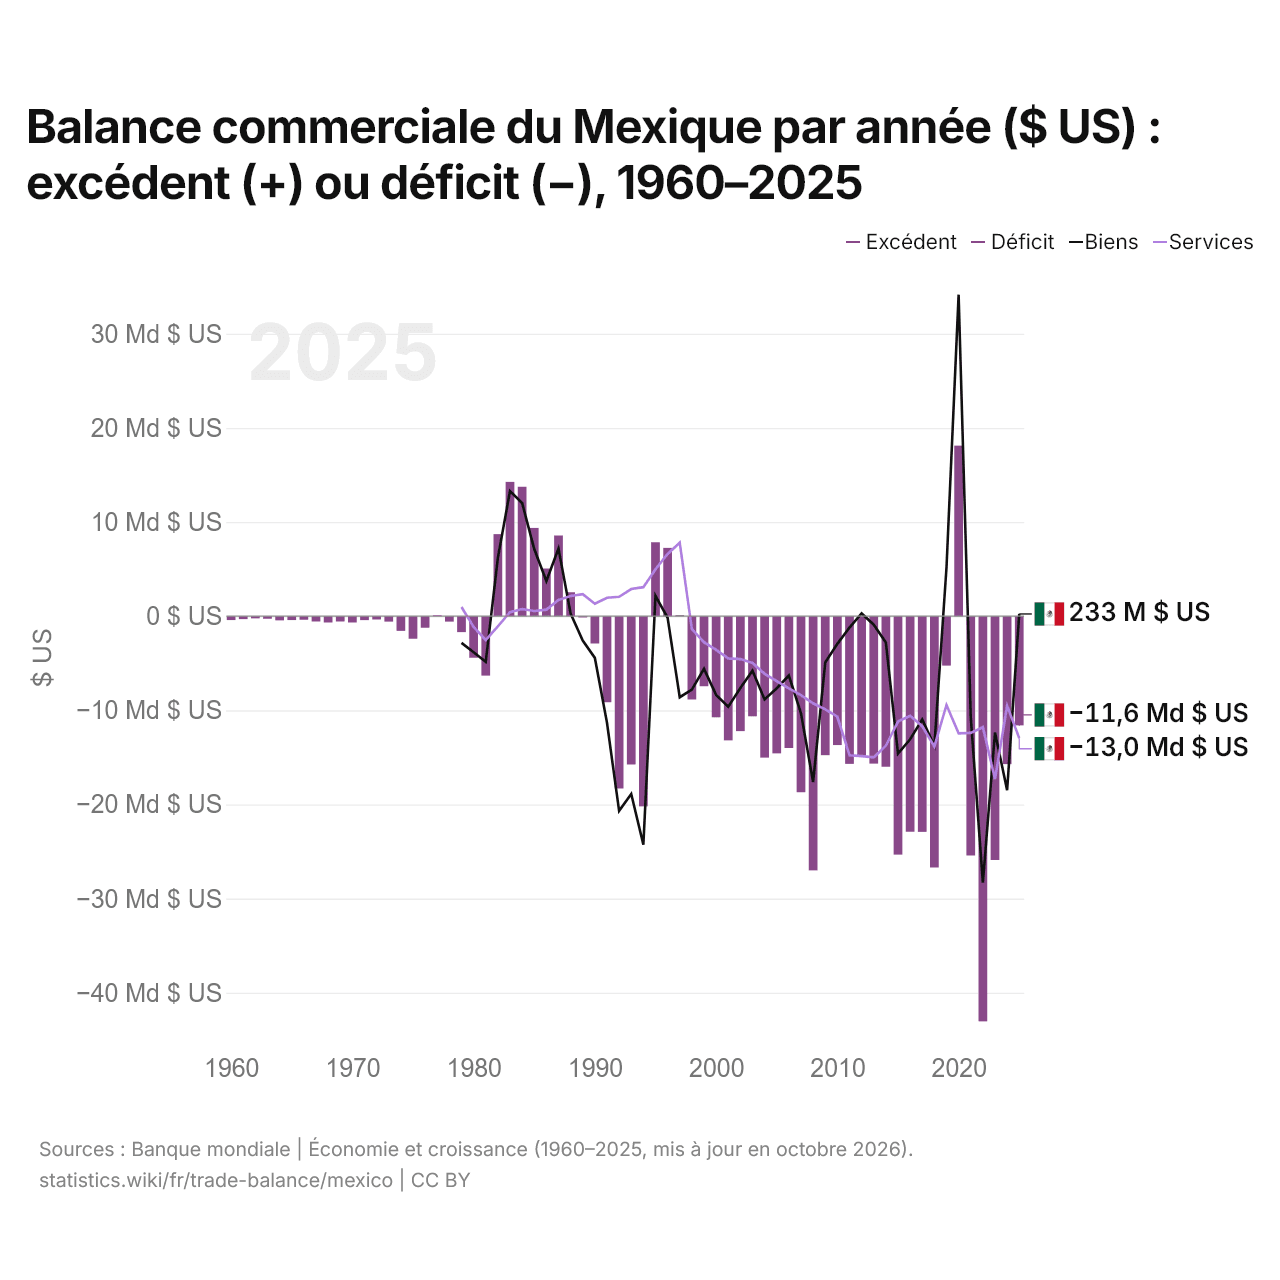
Balance commerciale du Mexique par année ($ US) : excédent (+) ou déficit (−), 1960–2025
| Année | $ US | ||
|---|---|---|---|
| Biens et services | Biens | Services | |
| 2025 | −11 605 622 880 $ US | 233 163 493 $ US | −12 966 855 876 $ US |
| 2024 | −15 717 845 722 $ US | −18 480 943 693 $ US | −9 515 280 652 $ US |
| 2023 | −25 897 057 372 $ US | −12 357 435 306 $ US | −17 307 603 419 $ US |
| 2022 | −43 038 473 570 $ US | −28 307 064 880 $ US | −11 795 073 132 $ US |
| 2021 | −25 421 787 732 $ US | −10 730 385 023 $ US | −12 397 814 831 $ US |
| 2020 | 18 118 519 569 $ US | 34 150 596 491 $ US | −12 438 923 015 $ US |
| 2019 | −5 251 253 229 $ US | 5 167 508 164 $ US | −9 433 159 179 $ US |
| 2018 | −26 693 875 997 $ US | −13 767 630 490 $ US | −13 843 184 005 $ US |
| 2017 | −22 908 871 558 $ US | −10 982 784 713 $ US | −11 686 006 707 $ US |
| 2016 | −22 900 319 427 $ US | −13 081 502 436 $ US | −10 585 753 032 $ US |
| 2015 | −25 326 664 234 $ US | −14 612 424 631 $ US | −11 195 339 369 $ US |
| 2014 | −15 997 824 630 $ US | −2 795 222 249 $ US | −13 768 242 527 $ US |
| 2013 | −15 664 725 283 $ US | −909 240 030 $ US | −14 998 307 898 $ US |
| 2012 | −14 798 142 338 $ US | 291 242 135 $ US | −14 872 344 737 $ US |
| 2011 | −15 687 804 674 $ US | −1 205 086 680 $ US | −14 775 495 234 $ US |
| 2010 | −13 690 284 542 $ US | −2 942 859 541 $ US | −10 680 731 596 $ US |
| 2009 | −14 766 707 749 $ US | −4 925 550 154 $ US | −9 894 767 565 $ US |
| 2008 | −27 007 969 655 $ US | −17 614 987 767 $ US | −9 254 559 000 $ US |
| 2007 | −18 700 378 800 $ US | −10 311 379 580 $ US | −8 384 441 935 $ US |
| 2006 | −14 004 359 661 $ US | −6 312 234 374 $ US | −7 678 772 570 $ US |
| 2005 | −14 575 601 318 $ US | −7 662 509 188 $ US | −6 903 276 225 $ US |
| 2004 | −15 028 128 471 $ US | −8 843 319 319 $ US | −6 124 822 493 $ US |
| 2003 | −10 635 248 765 $ US | −5 791 816 342 $ US | −4 978 769 679 $ US |
| 2002 | −12 211 107 588 $ US | −7 634 960 309 $ US | −4 559 329 300 $ US |
| 2001 | −13 196 271 984 $ US | −9 625 924 180 $ US | −4 483 522 305 $ US |
| 2000 | −10 745 509 995 $ US | −8 365 282 330 $ US | −3 576 484 711 $ US |
| 1999 | −7 439 469 884 $ US | −5 591 070 394 $ US | −2 759 250 606 $ US |
| 1998 | −8 854 630 484 $ US | −7 800 613 122 $ US | −1 380 089 878 $ US |
| 1997 | 100 862 036 $ US | −8 612 400 000 $ US | 7 805 204 000 $ US |
| 1996 | 7 253 513 413 $ US | −175 800 000 $ US | 6 611 685 000 $ US |
| 1995 | 7 854 137 403 $ US | 2 164 090 000 $ US | 4 988 620 000 $ US |
| 1994 | −20 203 083 923 $ US | −24 266 840 000 $ US | 3 081 700 000 $ US |
| 1993 | −15 751 893 766 $ US | −18 893 000 000 $ US | 2 883 000 000 $ US |
| 1992 | −18 303 180 266 $ US | −20 677 000 000 $ US | 2 059 000 000 $ US |
| 1991 | −9 142 911 050 $ US | −11 329 000 000 $ US | 1 960 000 000 $ US |
| 1990 | −2 901 886 476 $ US | −4 433 000 000 $ US | 1 323 000 000 $ US |
| 1989 | −144 468 779 $ US | −2 596 000 000 $ US | 2 329 000 000 $ US |
| 1988 | 2 545 780 331 $ US | 274 000 000 $ US | 2 140 000 000 $ US |
| 1987 | 8 573 422 397 $ US | 7 189 000 000 $ US | 1 724 000 000 $ US |
| 1986 | 5 056 800 480 $ US | 3 725 000 000 $ US | 691 000 000 $ US |
| 1985 | 9 374 182 472 $ US | 7 130 000 000 $ US | 553 000 000 $ US |
| 1984 | 13 747 056 510 $ US | 12 029 000 000 $ US | 761 000 000 $ US |
| 1983 | 14 264 243 010 $ US | 13 287 000 000 $ US | 428 000 000 $ US |
| 1982 | 8 712 722 953 $ US | 6 195 000 000 $ US | −1 078 000 000 $ US |
| 1981 | −6 315 684 275 $ US | −4 854 000 000 $ US | −2 529 000 000 $ US |
| 1980 | −4 418 630 996 $ US | −3 829 000 000 $ US | −1 150 000 000 $ US |
| 1979 | −1 697 513 703 $ US | −2 830 000 000 $ US | 979 000 000 $ US |
| 1978 | −583 862 608 $ US | - | - |
| 1977 | 79 369 158 $ US | - | - |
| 1976 | −1 224 186 438 $ US | - | - |
| 1975 | −2 398 560 000 $ US | - | - |
| 1974 | −1 557 920 000 $ US | - | - |
| 1973 | −581 984 000 $ US | - | - |
| 1972 | −347 920 000 $ US | - | - |
| 1971 | −422 920 000 $ US | - | - |
| 1970 | −675 968 000 $ US | - | - |
| 1969 | −560 120 000 $ US | - | - |
| 1968 | −679 896 000 $ US | - | - |
| 1967 | −568 840 000 $ US | - | - |
| 1966 | −375 216 000 $ US | - | - |
| 1965 | −412 432 000 $ US | - | - |
| 1964 | −445 848 000 $ US | - | - |
| 1963 | −277 032 000 $ US | - | - |
| 1962 | −234 024 000 $ US | - | - |
| 1961 | −311 912 000 $ US | - | - |
| 1960 | −411 824 000 $ US | - | - |
En 2025, la balance commerciale du Mexique affichait un déficit de 11,6 milliards de dollars, contre un déficit de 412 millions de dollars en 1960. Le plus grand déficit a été de 43 milliards de dollars, en 2022, et le plus grand excédent de 18,1 milliards de dollars, en 2020. La balance commerciale du Mexique est déficitaire chaque année depuis 2021.
En 2025, le solde commercial du Mexique était le 24e plus élevé de 26 pays situés en Amérique latine, où les soldes allaient d'un déficit de 24,7 milliards de dollars en Colombie à un excédent de 27,2 milliards de dollars au Pérou. De 2016 à 2025, les soldes commerciaux du Mexique ont totalisé un déficit de 181 milliards de dollars, contre un déficit de 176 milliards de dollars de 2006 à 2015. En 2025, les transactions courantes du Mexique affichaient un déficit de 0,5 % du PIB.
Commerce de biens du Mexique avec ses 10 principaux partenaires commerciaux, selon le Mexique, 2025
| Pays | Exportations vers | Importations depuis | Solde | |
|---|---|---|---|---|
 États-Unis |
545 Md $US | 250 Md $US | +295 Md $US | vs USA |
 Chine |
9,92 Md $US | 133 Md $US | −123 Md $US | vs Chine |
 Canada |
21,9 Md $US | 12,5 Md $US | +9,42 Md $US | vs Canada |
 Corée du Sud |
5,30 Md $US | 23,1 Md $US | −17,8 Md $US | vs Corée du Sud |
 Allemagne |
7,72 Md $US | 19,6 Md $US | −11,8 Md $US | |
 Vietnam |
426 M $US | 22,4 Md $US | −21,9 Md $US | |
 Japon |
4,03 Md $US | 18,6 Md $US | −14,5 Md $US | vs Japon |
 Malaisie |
785 M $US | 15,6 Md $US | −14,8 Md $US | |
 Brésil |
4,45 Md $US | 11,2 Md $US | −6,76 Md $US | vs Brésil |
 Thaïlande |
438 M $US | 13,1 Md $US | −12,7 Md $US | vs Thaïlande |
Balance commerciale du Mexique : excédent (+) ou déficit (−)
| Biens et services, $ US, 2025 | −11,6 Md $US |
|---|---|
| % du PIB, 2025 | −0,6 % |
| Années d'excédent, 2000–2025 | 1 |
| Biens, $ US, 2025 | +233 M $US |
| Services, $ US, 2025 | −13,0 Md $US |
| Premier excédent en biens, 2025 | États-Unis +295 Md $US |
| Premier déficit en biens, 2025 | Chine −123 Md $US |
Comparer la balance commerciale du Mexique avec celle d'autres pays
Sources :
- TradeMap (2025, mis à jour en octobre 2026)
- Banque mondiale | Économie et croissance (1960–2025, mis à jour en octobre 2026)
Creative Commons Attribution (CC BY) : vous pouvez copier, partager, adapter et réutiliser ce contenu, y compris à des fins commerciales, à condition de citer statistics.wiki et d’indiquer les modifications apportées. Les sources citées ci-dessus peuvent avoir leurs propres conditions de licence.