
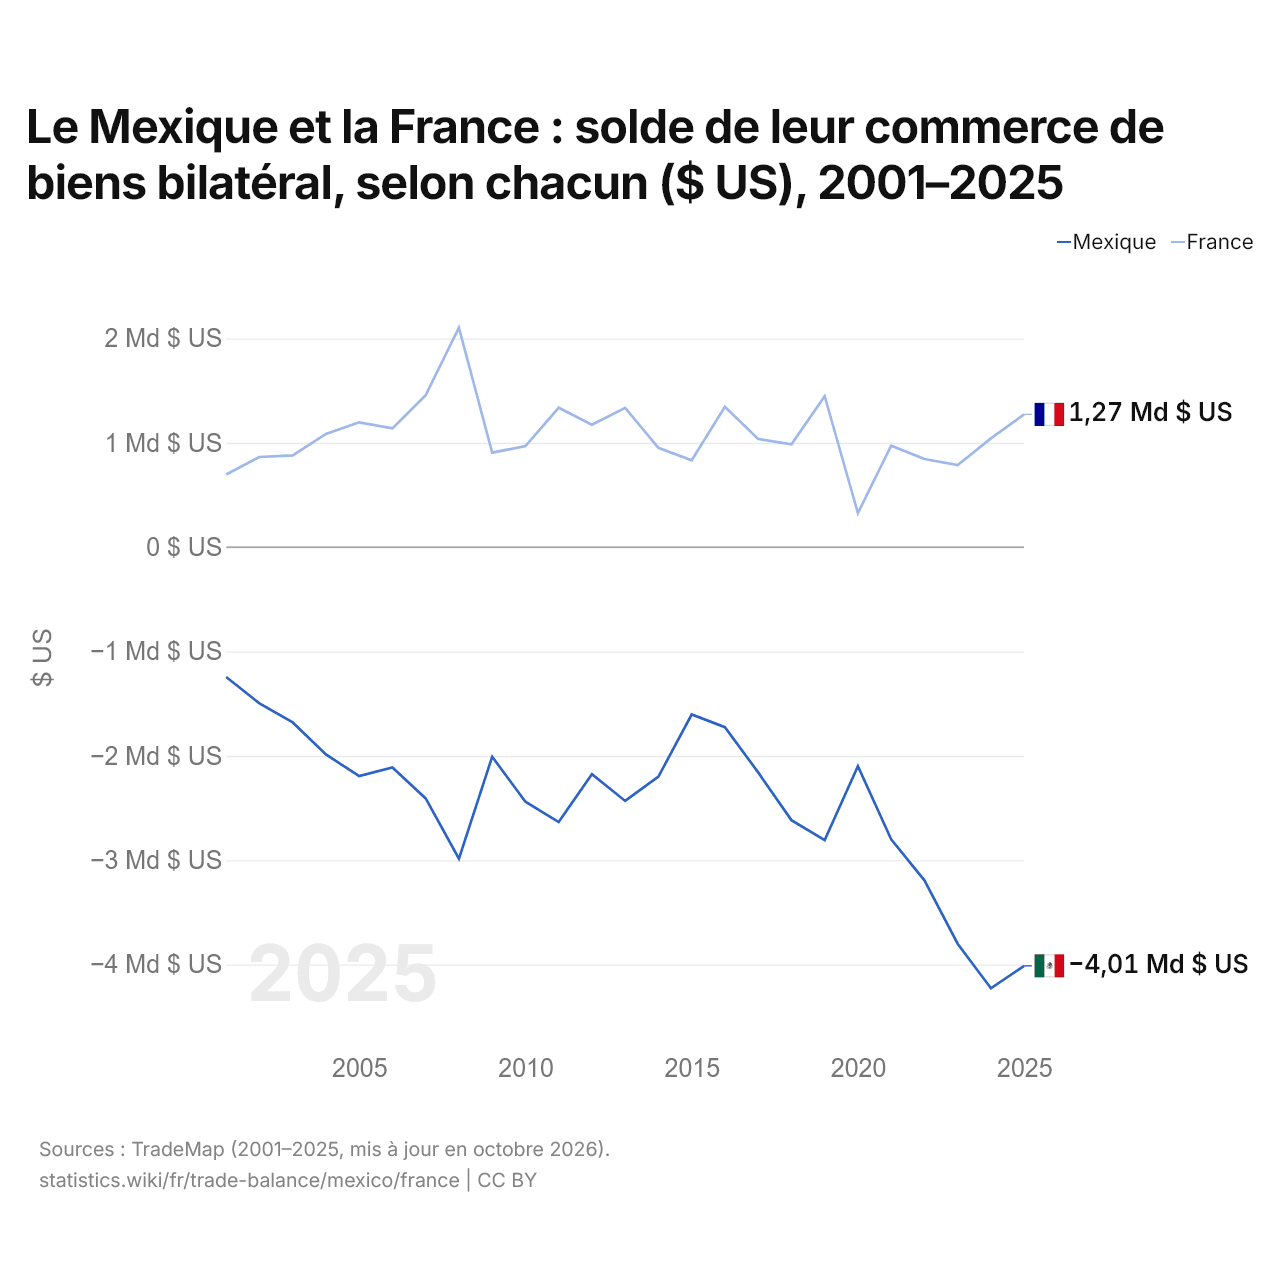
Le Mexique et la France : solde de leur commerce de biens bilatéral, selon chacun ($ US), 2001–2025
| Année | $ US | |
|---|---|---|
| Mexique | France | |
| 2025 | −4 012 831 000 $ US | 1 272 871 000 $ US |
| 2024 | −4 228 062 000 $ US | 1 042 686 000 $ US |
| 2023 | −3 800 718 000 $ US | 787 262 000 $ US |
| 2022 | −3 193 119 000 $ US | 844 905 000 $ US |
| 2021 | −2 799 454 000 $ US | 972 501 000 $ US |
| 2020 | −2 098 328 000 $ US | 326 353 000 $ US |
| 2019 | −2 807 380 000 $ US | 1 447 441 000 $ US |
| 2018 | −2 616 558 000 $ US | 986 257 000 $ US |
| 2017 | −2 158 854 000 $ US | 1 037 062 000 $ US |
| 2016 | −1 724 945 000 $ US | 1 345 259 000 $ US |
| 2015 | −1 603 858 000 $ US | 831 973 000 $ US |
| 2014 | −2 199 086 000 $ US | 952 404 000 $ US |
| 2013 | −2 432 485 000 $ US | 1 334 534 000 $ US |
| 2012 | −2 176 184 000 $ US | 1 172 823 000 $ US |
| 2011 | −2 634 508 000 $ US | 1 336 104 000 $ US |
| 2010 | −2 440 044 000 $ US | 968 371 000 $ US |
| 2009 | −2 008 425 000 $ US | 905 340 000 $ US |
| 2008 | −2 986 271 000 $ US | 2 103 163 000 $ US |
| 2007 | −2 408 151 000 $ US | 1 456 172 000 $ US |
| 2006 | −2 110 820 000 $ US | 1 137 835 000 $ US |
| 2005 | −2 194 827 000 $ US | 1 196 326 000 $ US |
| 2004 | −1 986 866 000 $ US | 1 084 479 000 $ US |
| 2003 | −1 679 868 000 $ US | 879 090 000 $ US |
| 2002 | −1 497 423 000 $ US | 864 209 000 $ US |
| 2001 | −1 244 226 000 $ US | 696 617 000 $ US |
En 2025, selon le Mexique, son commerce de biens avec la France affichait un déficit de 4,01 milliards de dollars ; selon la France, son commerce de biens avec le Mexique affichait un excédent de 1,27 milliard de dollars. En 2001, les chiffres étaient un déficit de 1,24 milliard de dollars pour le Mexique et un excédent de 697 millions de dollars pour la France.
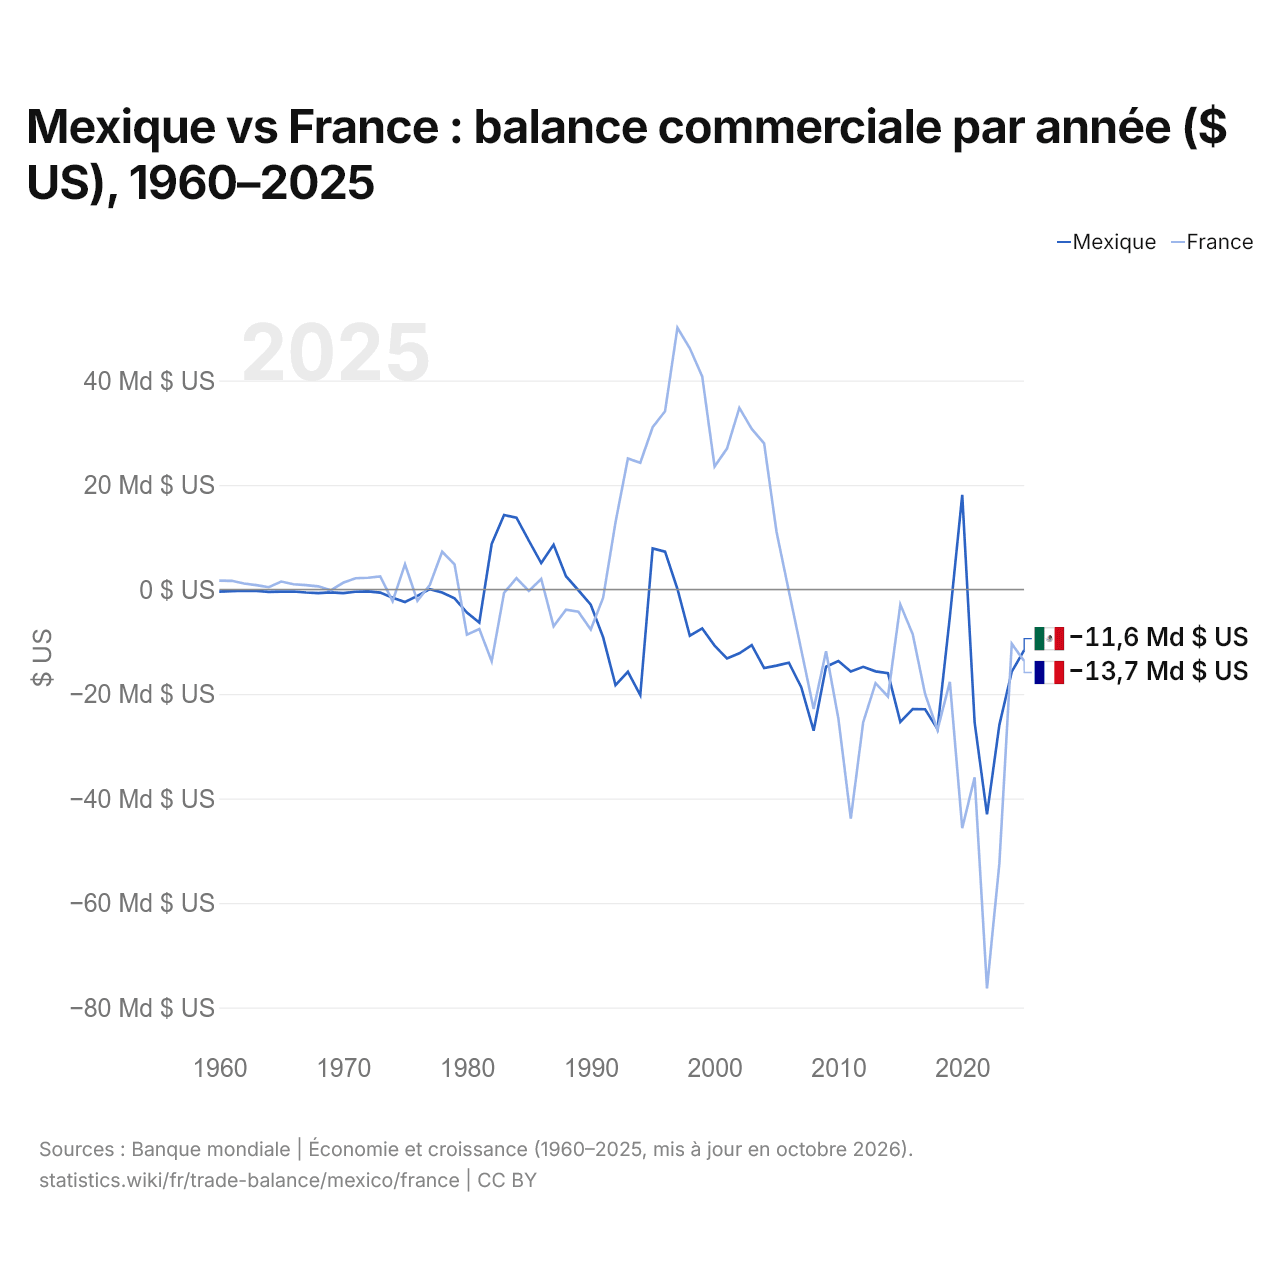
Mexique vs France : balance commerciale par année ($ US), 1960–2025
| Année | $ US | |
|---|---|---|
 Mexique |
 France |
|
| 2025 | −11 605 622 880 $ US | −13 691 892 676 $ US |
| 2024 | −15 717 845 722 $ US | −10 387 713 597 $ US |
| 2023 | −25 897 057 372 $ US | −52 372 867 874 $ US |
| 2022 | −43 038 473 570 $ US | −76 323 175 109 $ US |
| 2021 | −25 421 787 732 $ US | −35 964 530 801 $ US |
| 2020 | 18 118 519 569 $ US | −45 662 030 726 $ US |
| 2019 | −5 251 253 229 $ US | −17 694 749 944 $ US |
| 2018 | −26 693 875 997 $ US | −26 878 288 452 $ US |
| 2017 | −22 908 871 558 $ US | −19 990 725 131 $ US |
| 2016 | −22 900 319 427 $ US | −8 555 918 301 $ US |
| 2015 | −25 326 664 234 $ US | −2 874 747 900 $ US |
| 2014 | −15 997 824 630 $ US | −20 476 182 589 $ US |
| 2013 | −15 664 725 283 $ US | −17 928 929 470 $ US |
| 2012 | −14 798 142 338 $ US | −25 424 169 112 $ US |
| 2011 | −15 687 804 674 $ US | −43 858 143 696 $ US |
| 2010 | −13 690 284 542 $ US | −24 731 111 845 $ US |
| 2009 | −14 766 707 749 $ US | −11 805 159 462 $ US |
| 2008 | −27 007 969 655 $ US | −22 878 042 543 $ US |
| 2007 | −18 700 378 800 $ US | −11 565 875 316 $ US |
| 2006 | −14 004 359 661 $ US | −314 778 625 $ US |
| 2005 | −14 575 601 318 $ US | 11 054 488 524 $ US |
| 2004 | −15 028 128 471 $ US | 27 985 189 929 $ US |
| 2003 | −10 635 248 765 $ US | 30 738 831 193 $ US |
| 2002 | −12 211 107 588 $ US | 34 756 831 657 $ US |
| 2001 | −13 196 271 984 $ US | 26 968 658 956 $ US |
| 2000 | −10 745 509 995 $ US | 23 545 285 267 $ US |
| 1999 | −7 439 469 884 $ US | 40 790 461 990 $ US |
| 1998 | −8 854 630 484 $ US | 46 166 110 740 $ US |
| 1997 | 100 862 036 $ US | 50 108 338 953 $ US |
| 1996 | 7 253 513 413 $ US | 34 112 706 757 $ US |
| 1995 | 7 854 137 403 $ US | 31 069 260 087 $ US |
| 1994 | −20 203 083 923 $ US | 24 247 400 756 $ US |
| 1993 | −15 751 893 766 $ US | 25 065 323 141 $ US |
| 1992 | −18 303 180 266 $ US | 12 888 475 836 $ US |
| 1991 | −9 142 911 050 $ US | −1 575 747 006 $ US |
| 1990 | −2 901 886 476 $ US | −7 657 631 611 $ US |
| 1989 | −144 468 779 $ US | −4 238 741 518 $ US |
| 1988 | 2 545 780 331 $ US | −3 842 638 476 $ US |
| 1987 | 8 573 422 397 $ US | −7 038 415 366 $ US |
| 1986 | 5 056 800 480 $ US | 2 015 437 068 $ US |
| 1985 | 9 374 182 472 $ US | −286 173 164 $ US |
| 1984 | 13 747 056 510 $ US | 2 161 975 531 $ US |
| 1983 | 14 264 243 010 $ US | −632 756 692 $ US |
| 1982 | 8 712 722 953 $ US | −13 723 325 681 $ US |
| 1981 | −6 315 684 275 $ US | −7 579 843 090 $ US |
| 1980 | −4 418 630 996 $ US | −8 643 123 254 $ US |
| 1979 | −1 697 513 703 $ US | 4 816 373 728 $ US |
| 1978 | −583 862 608 $ US | 7 241 133 721 $ US |
| 1977 | 79 369 158 $ US | 868 280 289 $ US |
| 1976 | −1 224 186 438 $ US | −2 147 364 108 $ US |
| 1975 | −2 398 560 000 $ US | 4 812 605 171 $ US |
| 1974 | −1 557 920 000 $ US | −2 215 630 115 $ US |
| 1973 | −581 984 000 $ US | 2 527 401 296 $ US |
| 1972 | −347 920 000 $ US | 2 245 383 615 $ US |
| 1971 | −422 920 000 $ US | 2 159 464 899 $ US |
| 1970 | −675 968 000 $ US | 1 297 980 394 $ US |
| 1969 | −560 120 000 $ US | −146 618 606 $ US |
| 1968 | −679 896 000 $ US | 612 901 162 $ US |
| 1967 | −568 840 000 $ US | 840 231 291 $ US |
| 1966 | −375 216 000 $ US | 1 011 891 447 $ US |
| 1965 | −412 432 000 $ US | 1 521 823 088 $ US |
| 1964 | −445 848 000 $ US | 442 835 372 $ US |
| 1963 | −277 032 000 $ US | 841 559 930 $ US |
| 1962 | −234 024 000 $ US | 1 154 587 274 $ US |
| 1961 | −311 912 000 $ US | 1 666 644 737 $ US |
| 1960 | −411 824 000 $ US | 1 710 489 823 $ US |
En 2025, la balance commerciale du Mexique affichait un déficit de 11,6 milliards de dollars et celle de la France un déficit de 13,7 milliards de dollars ; le déficit de la France était plus grand de 18 %. En 1960, la balance commerciale du Mexique affichait un déficit de 412 millions de dollars et celle de la France un excédent de 1,71 milliard de dollars.
De 1960 à 2025, la balance commerciale du Mexique a été excédentaire pendant 12 des 66 années, et celle de la France pendant 33. Les balances commerciales du Mexique et de la France ont été déficitaires en même temps pendant 27 de ces années, la dernière fois en 2025.
Mexique vs France : chiffres de la balance commerciale
|
Mexique
|
France
|
|
|---|---|---|
| Biens et services, $ US | −11,6 Md $US (2025) | −13,7 Md $US (2025) |
| % du PIB | −0,6 % (2025) | −0,4 % (2025) |
| Années d'excédent depuis 2000 | 1 sur 26 | 6 sur 26 |
| Solde des biens entre les deux, chiffres propres | −4,01 Md $US (2025) | +1,27 Md $US (2025) |
| Premier excédent en biens avec | États-Unis (+295 Md $US, 2025) | Royaume-Uni (+15,2 Md $US, 2025) |
| Premier déficit en biens avec | Chine (−123 Md $US, 2025) | Chine (−56,4 Md $US, 2025) |
Comparer la balance commerciale de 2 pays au choix
Sources :
- Banque mondiale | Économie et croissance (1960–2025, mis à jour en octobre 2026)
- TradeMap (2001–2025, mis à jour en octobre 2026)
Creative Commons Attribution (CC BY) : vous pouvez copier, partager, adapter et réutiliser ce contenu, y compris à des fins commerciales, à condition de citer statistics.wiki et d’indiquer les modifications apportées. Les sources citées ci-dessus peuvent avoir leurs propres conditions de licence.