
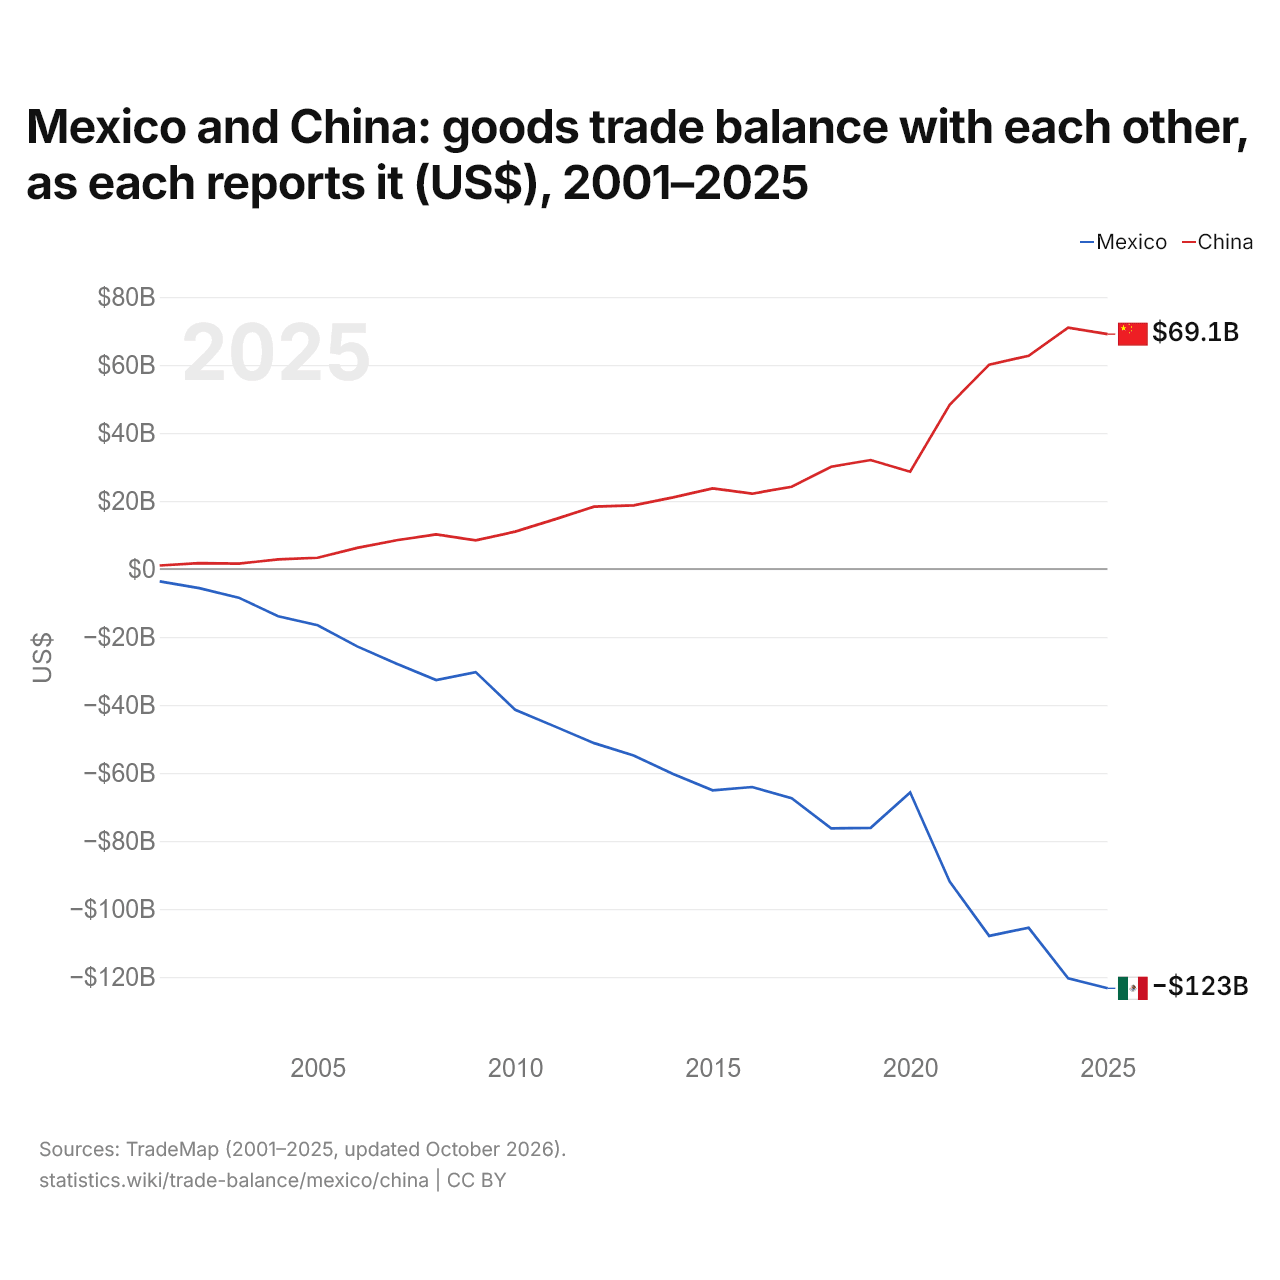
Le Mexique et la Chine : solde de leur commerce de biens bilatéral, selon chacun ($ US), 2001–2025
| Année | $ US | |
|---|---|---|
| Mexique | Chine | |
| 2025 | −123 326 692 000 $ US | 69 091 964 000 $ US |
| 2024 | −120 378 782 000 $ US | 70 978 966 000 $ US |
| 2023 | −105 526 209 000 $ US | 62 706 895 000 $ US |
| 2022 | −107 921 936 000 $ US | 60 105 364 000 $ US |
| 2021 | −91 940 363 000 $ US | 48 298 158 000 $ US |
| 2020 | −65 717 821 000 $ US | 28 610 280 000 $ US |
| 2019 | −76 119 522 000 $ US | 32 047 627 000 $ US |
| 2018 | −76 307 025 000 $ US | 30 075 148 000 $ US |
| 2017 | −67 433 583 000 $ US | 24 205 706 000 $ US |
| 2016 | −64 115 214 000 $ US | 22 153 628 000 $ US |
| 2015 | −65 106 529 000 $ US | 23 727 110 000 $ US |
| 2014 | −60 305 764 000 $ US | 21 081 968 000 $ US |
| 2013 | −54 852 889 000 $ US | 18 727 814 000 $ US |
| 2012 | −51 215 386 000 $ US | 18 356 938 000 $ US |
| 2011 | −46 283 759 000 $ US | 14 598 319 000 $ US |
| 2010 | −41 411 648 000 $ US | 10 997 465 000 $ US |
| 2009 | −30 321 179 000 $ US | 8 417 092 000 $ US |
| 2008 | −32 645 558 000 $ US | 10 176 233 000 $ US |
| 2007 | −27 848 641 000 $ US | 8 452 345 000 $ US |
| 2006 | −22 750 168 000 $ US | 6 216 451 000 $ US |
| 2005 | −16 560 794 000 $ US | 3 312 392 000 $ US |
| 2004 | −13 899 708 000 $ US | 2 832 914 000 $ US |
| 2003 | −8 425 905 000 $ US | 1 590 289 000 $ US |
| 2002 | −5 619 858 000 $ US | 1 748 698 000 $ US |
| 2001 | −3 642 041 000 $ US | 1 028 941 000 $ US |
En 2025, selon le Mexique, son commerce de biens avec la Chine affichait un déficit de 123 milliards de dollars ; selon la Chine, son commerce de biens avec le Mexique affichait un excédent de 69,1 milliards de dollars. En 2001, les chiffres étaient un déficit de 3,64 milliards de dollars pour le Mexique et un excédent de 1,03 milliard de dollars pour la Chine.
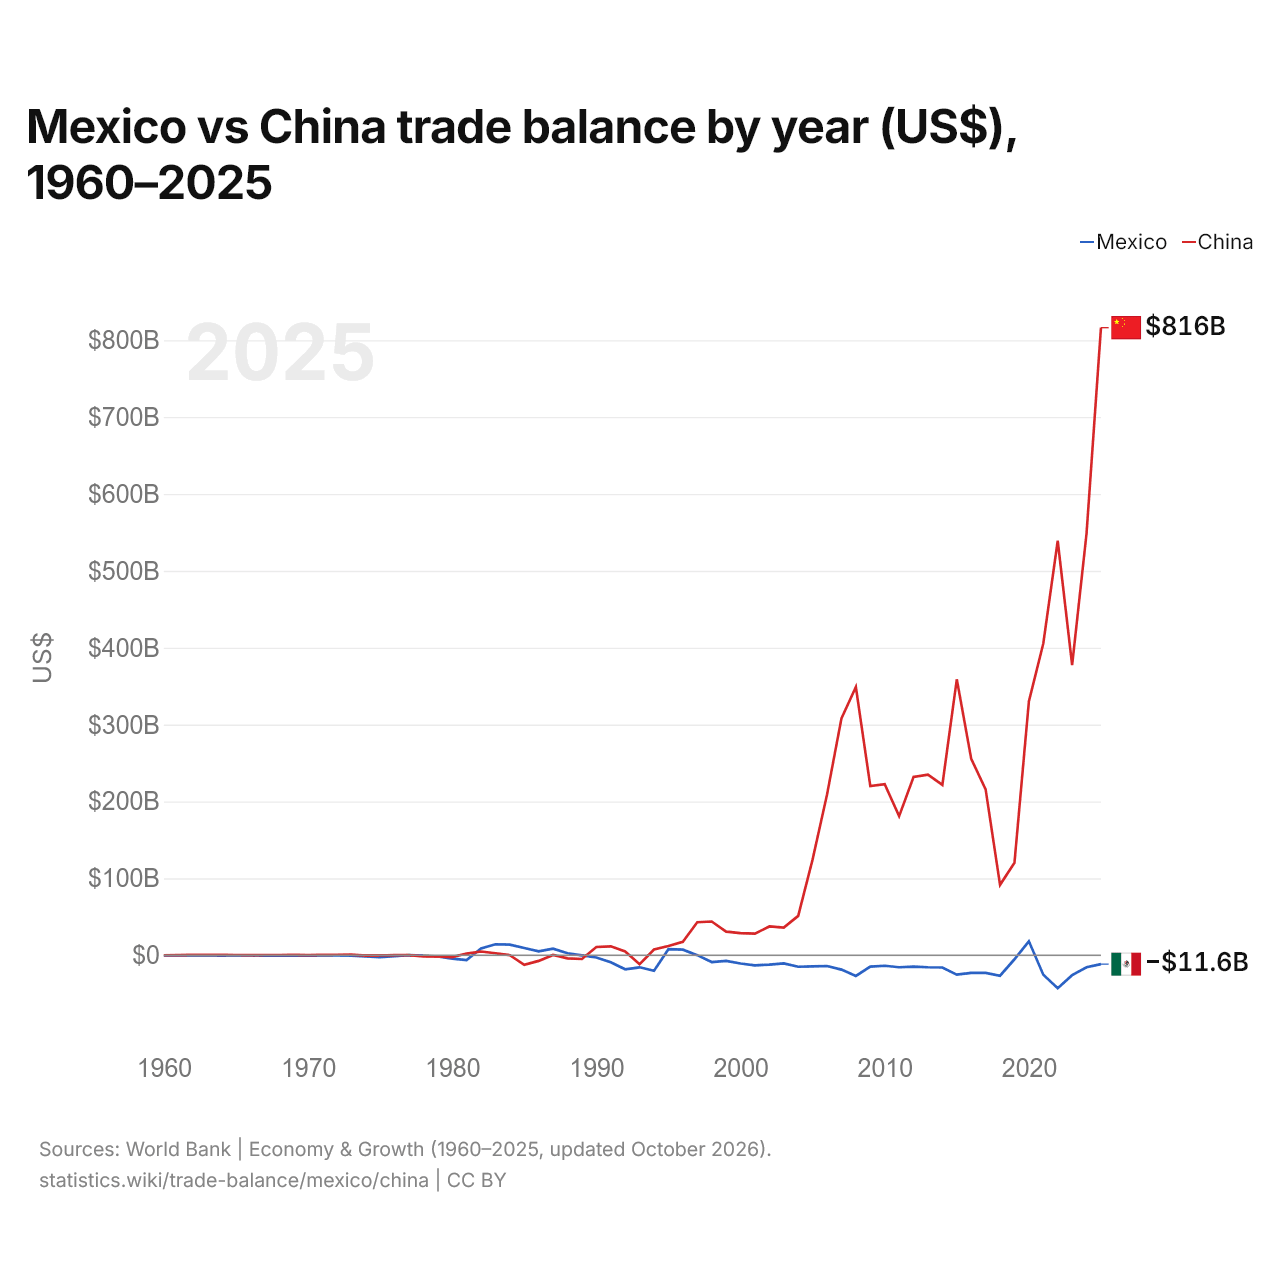
Mexique vs Chine : balance commerciale par année ($ US), 1960–2025
| Année | $ US | |
|---|---|---|
 Mexique |
 Chine |
|
| 2025 | −11 605 622 880 $ US | 816 189 653 994 $ US |
| 2024 | −15 717 845 722 $ US | 548 703 728 924 $ US |
| 2023 | −25 897 057 372 $ US | 377 368 486 355 $ US |
| 2022 | −43 038 473 570 $ US | 539 054 406 264 $ US |
| 2021 | −25 421 787 732 $ US | 405 394 120 058 $ US |
| 2020 | 18 118 519 569 $ US | 330 134 703 664 $ US |
| 2019 | −5 251 253 229 $ US | 120 151 888 640 $ US |
| 2018 | −26 693 875 997 $ US | 91 487 265 093 $ US |
| 2017 | −22 908 871 558 $ US | 215 697 133 466 $ US |
| 2016 | −22 900 319 427 $ US | 255 484 319 295 $ US |
| 2015 | −25 326 664 234 $ US | 358 836 357 206 $ US |
| 2014 | −15 997 824 630 $ US | 221 549 605 872 $ US |
| 2013 | −15 664 725 283 $ US | 234 872 118 182 $ US |
| 2012 | −14 798 142 338 $ US | 231 864 021 797 $ US |
| 2011 | −15 687 804 674 $ US | 180 895 321 770 $ US |
| 2010 | −13 690 284 542 $ US | 222 400 893 687 $ US |
| 2009 | −14 766 707 749 $ US | 220 130 401 367 $ US |
| 2008 | −27 007 969 655 $ US | 348 832 533 154 $ US |
| 2007 | −18 700 378 800 $ US | 308 036 028 783 $ US |
| 2006 | −14 004 359 661 $ US | 208 918 924 501 $ US |
| 2005 | −14 575 601 318 $ US | 124 626 797 517 $ US |
| 2004 | −15 028 128 471 $ US | 51 174 382 540 $ US |
| 2003 | −10 635 248 765 $ US | 35 821 129 066 $ US |
| 2002 | −12 211 107 588 $ US | 37 382 671 264 $ US |
| 2001 | −13 196 271 984 $ US | 28 086 220 298 $ US |
| 2000 | −10 745 509 995 $ US | 28 785 851 579 $ US |
| 1999 | −7 439 469 884 $ US | 30 640 955 367 $ US |
| 1998 | −8 854 630 484 $ US | 43 836 689 480 $ US |
| 1997 | 100 862 036 $ US | 42 823 220 000 $ US |
| 1996 | 7 253 513 413 $ US | 17 550 000 000 $ US |
| 1995 | 7 854 137 403 $ US | 11 958 000 000 $ US |
| 1994 | −20 203 083 923 $ US | 7 357 000 000 $ US |
| 1993 | −15 751 893 766 $ US | −11 792 000 000 $ US |
| 1992 | −18 303 180 266 $ US | 4 998 000 000 $ US |
| 1991 | −9 142 911 050 $ US | 11 601 000 000 $ US |
| 1990 | −2 901 886 476 $ US | 10 668 000 000 $ US |
| 1989 | −144 468 779 $ US | −4 928 000 000 $ US |
| 1988 | 2 545 780 331 $ US | −4 061 000 000 $ US |
| 1987 | 8 573 422 397 $ US | 291 000 000 $ US |
| 1986 | 5 056 800 480 $ US | −7 390 000 000 $ US |
| 1985 | 9 374 182 472 $ US | −12 501 000 000 $ US |
| 1984 | 13 747 056 510 $ US | 54 000 000 $ US |
| 1983 | 14 264 243 010 $ US | 2 571 000 000 $ US |
| 1982 | 8 712 722 953 $ US | 4 812 000 000 $ US |
| 1981 | −6 315 684 275 $ US | 2 150 220 000 $ US |
| 1980 | −4 418 630 996 $ US | −2 436 990 000 $ US |
| 1979 | −1 697 513 703 $ US | −1 572 643 000 $ US |
| 1978 | −583 862 608 $ US | −1 460 560 000 $ US |
| 1977 | 79 369 158 $ US | 210 672 000 $ US |
| 1976 | −1 224 186 438 $ US | 90 791 000 $ US |
| 1975 | −2 398 560 000 $ US | −380 480 000 $ US |
| 1974 | −1 557 920 000 $ US | −503 131 000 $ US |
| 1973 | −581 984 000 $ US | 701 488 000 $ US |
| 1972 | −347 920 000 $ US | 620 760 000 $ US |
| 1971 | −422 920 000 $ US | 477 289 000 $ US |
| 1970 | −675 968 000 $ US | 72 660 000 $ US |
| 1969 | −560 120 000 $ US | 483 200 000 $ US |
| 1968 | −679 896 000 $ US | 269 480 000 $ US |
| 1967 | −568 840 000 $ US | 236 020 000 $ US |
| 1966 | −375 216 000 $ US | 185 300 000 $ US |
| 1965 | −412 432 000 $ US | 330 180 000 $ US |
| 1964 | −445 848 000 $ US | 457 760 000 $ US |
| 1963 | −277 032 000 $ US | 455 680 000 $ US |
| 1962 | −234 024 000 $ US | 377 650 000 $ US |
| 1961 | −311 912 000 $ US | 97 520 000 $ US |
| 1960 | −411 824 000 $ US | −7 530 000 $ US |
En 2025, la balance commerciale du Mexique affichait un déficit de 11,6 milliards de dollars et celle de la Chine un excédent de 816 milliards de dollars. En 1960, la balance commerciale du Mexique affichait un déficit de 412 millions de dollars et celle de la Chine un déficit de 7,53 millions de dollars.
De 1960 à 2025, la balance commerciale du Mexique a été excédentaire pendant 12 des 66 années, et celle de la Chine pendant 55. Les balances commerciales du Mexique et de la Chine ont été déficitaires en même temps pendant 8 de ces années, la dernière fois en 1993.
Mexique vs Chine : chiffres de la balance commerciale
|
Mexique
|
Chine
|
|
|---|---|---|
| Biens et services, $ US | −11,6 Md $US (2025) | +816 Md $US (2025) |
| % du PIB | −0,6 % (2025) | +4,2 % (2025) |
| Années d'excédent depuis 2000 | 1 sur 26 | 26 sur 26 |
| Solde des biens entre les deux, chiffres propres | −123 Md $US (2025) | +69,1 Md $US (2025) |
| Premier excédent en biens avec | États-Unis (+295 Md $US, 2025) | États-Unis (+280 Md $US, 2025) |
| Premier déficit en biens avec | Chine (−123 Md $US, 2025) | Australie (−51,6 Md $US, 2025) |
Comparer la balance commerciale de 2 pays au choix
Sources :
- Banque mondiale | Économie et croissance (1960–2025, mis à jour en octobre 2026)
- TradeMap (2001–2025, mis à jour en octobre 2026)
Creative Commons Attribution (CC BY) : vous pouvez copier, partager, adapter et réutiliser ce contenu, y compris à des fins commerciales, à condition de citer statistics.wiki et d’indiquer les modifications apportées. Les sources citées ci-dessus peuvent avoir leurs propres conditions de licence.