
L'Arabie saoudite et la Chine : solde de leur commerce de biens bilatéral, selon chacun ($ US), 2001–2025
| Année | $ US | |
|---|---|---|
| Arabie saoudite | Chine | |
| 2025 | −61 703 443 000 $ US | −1 188 028 000 $ US |
| 2024 | −8 859 212 000 $ US | −7 650 504 000 $ US |
| 2023 | 8 601 981 000 $ US | −21 326 800 000 $ US |
| 2022 | 26 846 380 000 $ US | −40 055 430 000 $ US |
| 2021 | 20 674 859 000 $ US | −26 640 050 000 $ US |
| 2020 | 5 396 265 000 $ US | −10 975 006 000 $ US |
| 2019 | 20 682 127 000 $ US | −30 319 431 000 $ US |
| 2018 | 17 301 829 000 $ US | −28 338 084 000 $ US |
| 2017 | 6 324 010 000 $ US | −13 430 592 000 $ US |
| 2016 | 1 653 573 000 $ US | −4 346 264 000 $ US |
| 2015 | −45 376 000 $ US | −8 467 046 000 $ US |
| 2014 | −15 852 132 000 $ US | −27 932 784 000 $ US |
| 2013 | −13 382 625 000 $ US | −34 710 897 000 $ US |
| 2012 | −13 286 827 000 $ US | −36 408 225 000 $ US |
| 2011 | −11 158 111 000 $ US | −34 617 813 000 $ US |
| 2010 | −8 732 039 000 $ US | −22 462 603 000 $ US |
| 2009 | −8 348 727 000 $ US | −14 642 392 000 $ US |
| 2008 | −10 283 172 000 $ US | −20 199 230 000 $ US |
| 2007 | −6 901 261 000 $ US | −9 720 517 000 $ US |
| 2006 | −4 437 605 000 $ US | −10 028 698 000 $ US |
| 2005 | −3 006 364 000 $ US | −8 421 300 000 $ US |
| 2004 | −2 072 744 000 $ US | −4 747 187 000 $ US |
| 2003 | −1 744 473 000 $ US | −3 025 519 000 $ US |
| 2002 | −1 206 398 000 $ US | −1 763 807 000 $ US |
| 2001 | −899 795 000 $ US | −1 361 780 000 $ US |
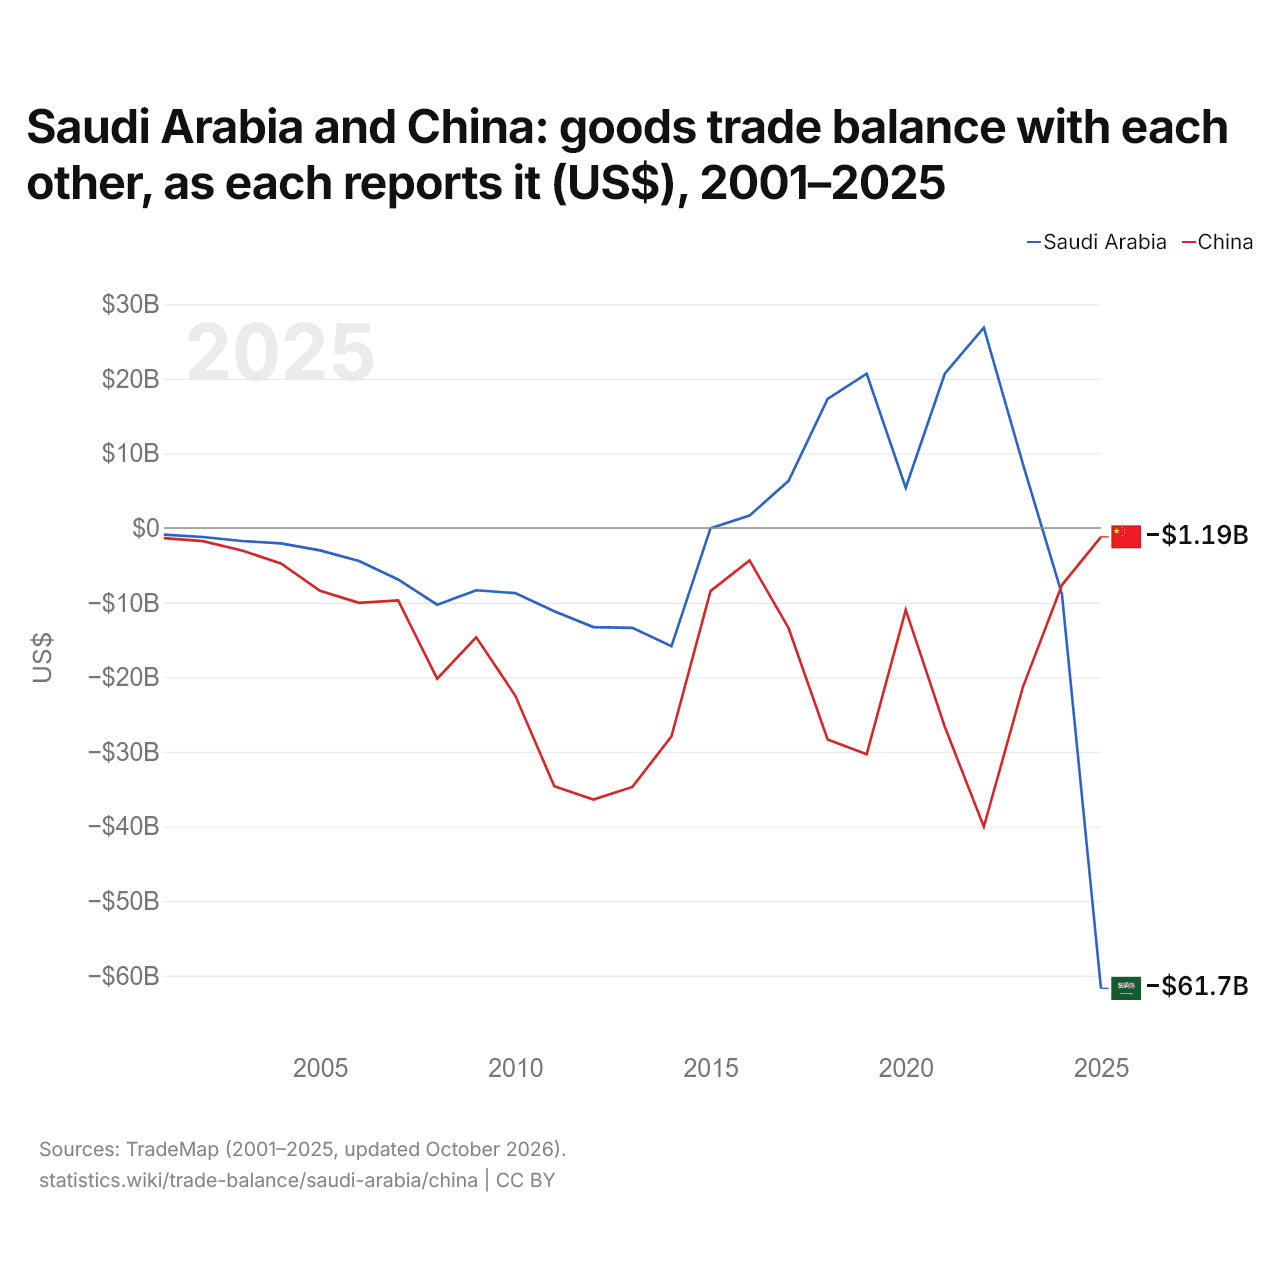
En 2025, selon l'Arabie saoudite, son commerce de biens avec la Chine affichait un déficit de 61,7 milliards de dollars ; selon la Chine, son commerce de biens avec l'Arabie saoudite affichait un déficit de 1,19 milliard de dollars. En 2001, les chiffres étaient un déficit de 900 millions de dollars pour l'Arabie saoudite et un déficit de 1,36 milliard de dollars pour la Chine.
Arabie saoudite vs Chine : balance commerciale par année ($ US), 1960–2025
| Année | $ US | |
|---|---|---|
 Arabie saoudite |
 Chine |
|
| 2025 | 20 067 466 667 $ US | 816 189 653 994 $ US |
| 2024 | 29 736 533 333 $ US | 548 703 728 924 $ US |
| 2023 | 69 635 466 667 $ US | 377 368 486 355 $ US |
| 2022 | 187 668 533 333 $ US | 539 054 406 264 $ US |
| 2021 | 72 986 133 333 $ US | 405 394 120 058 $ US |
| 2020 | 664 000 000 $ US | 330 134 703 664 $ US |
| 2019 | 66 885 333 333 $ US | 120 151 888 640 $ US |
| 2018 | 105 847 466 667 $ US | 91 487 265 093 $ US |
| 2017 | 38 494 666 667 $ US | 215 697 133 466 $ US |
| 2016 | 2 512 533 333 $ US | 255 484 319 295 $ US |
| 2015 | −29 296 800 000 $ US | 358 836 357 206 $ US |
| 2014 | 95 966 400 000 $ US | 221 549 605 872 $ US |
| 2013 | 157 750 133 333 $ US | 234 872 118 182 $ US |
| 2012 | 184 213 333 333 $ US | 231 864 021 797 $ US |
| 2011 | 178 246 400 000 $ US | 180 895 321 770 $ US |
| 2010 | 87 628 266 667 $ US | 222 400 893 687 $ US |
| 2009 | 39 987 200 000 $ US | 220 130 401 367 $ US |
| 2008 | 146 168 800 000 $ US | 348 832 533 154 $ US |
| 2007 | 104 039 226 151 $ US | 308 036 028 783 $ US |
| 2006 | 112 011 748 999 $ US | 208 918 924 501 $ US |
| 2005 | 105 591 257 239 $ US | 124 626 797 517 $ US |
| 2004 | 69 570 133 333 $ US | 51 174 382 540 $ US |
| 2003 | 47 212 533 333 $ US | 35 821 129 066 $ US |
| 2002 | 32 810 933 333 $ US | 37 382 671 264 $ US |
| 2001 | 28 922 133 333 $ US | 28 086 220 298 $ US |
| 2000 | 35 333 333 333 $ US | 28 785 851 579 $ US |
| 1999 | 18 576 266 667 $ US | 30 640 955 367 $ US |
| 1998 | 4 662 133 333 $ US | 43 836 689 480 $ US |
| 1997 | 21 789 586 115 $ US | 42 823 220 000 $ US |
| 1996 | 21 247 797 063 $ US | 17 550 000 000 $ US |
| 1995 | 13 809 612 817 $ US | 11 958 000 000 $ US |
| 1994 | 10 720 160 214 $ US | 7 357 000 000 $ US |
| 1993 | 1 194 926 569 $ US | −11 792 000 000 $ US |
| 1992 | 4 279 305 741 $ US | 4 998 000 000 $ US |
| 1991 | 2 535 380 507 $ US | 11 601 000 000 $ US |
| 1990 | 10 541 522 029 $ US | 10 668 000 000 $ US |
| 1989 | −4 130 040 053 $ US | −4 928 000 000 $ US |
| 1988 | −3 423 497 997 $ US | −4 061 000 000 $ US |
| 1987 | −5 373 831 776 $ US | 291 000 000 $ US |
| 1986 | −7 899 000 810 $ US | −7 390 000 000 $ US |
| 1985 | −6 827 443 401 $ US | −12 501 000 000 $ US |
| 1984 | −12 800 510 783 $ US | 54 000 000 $ US |
| 1983 | −11 894 066 570 $ US | 2 571 000 000 $ US |
| 1982 | 17 796 370 134 $ US | 4 812 000 000 $ US |
| 1981 | 60 310 278 645 $ US | 2 150 220 000 $ US |
| 1980 | 59 490 035 596 $ US | −2 436 990 000 $ US |
| 1979 | 23 056 756 397 $ US | −1 572 643 000 $ US |
| 1978 | 6 195 798 165 $ US | −1 460 560 000 $ US |
| 1977 | 18 443 064 170 $ US | 210 672 000 $ US |
| 1976 | 22 707 932 011 $ US | 90 791 000 $ US |
| 1975 | 24 135 407 771 $ US | −380 480 000 $ US |
| 1974 | 22 585 633 803 $ US | −503 131 000 $ US |
| 1973 | 11 776 865 468 $ US | 701 488 000 $ US |
| 1972 | 4 185 774 158 $ US | 620 760 000 $ US |
| 1971 | 2 591 362 408 $ US | 477 289 000 $ US |
| 1970 | 1 572 222 222 $ US | 72 660 000 $ US |
| 1969 | 1 042 836 022 $ US | 483 200 000 $ US |
| 1968 | 963 960 711 $ US | 269 480 000 $ US |
| 1967 | - | 236 020 000 $ US |
| 1966 | - | 185 300 000 $ US |
| 1965 | - | 330 180 000 $ US |
| 1964 | - | 457 760 000 $ US |
| 1963 | - | 455 680 000 $ US |
| 1962 | - | 377 650 000 $ US |
| 1961 | - | 97 520 000 $ US |
| 1960 | - | −7 530 000 $ US |
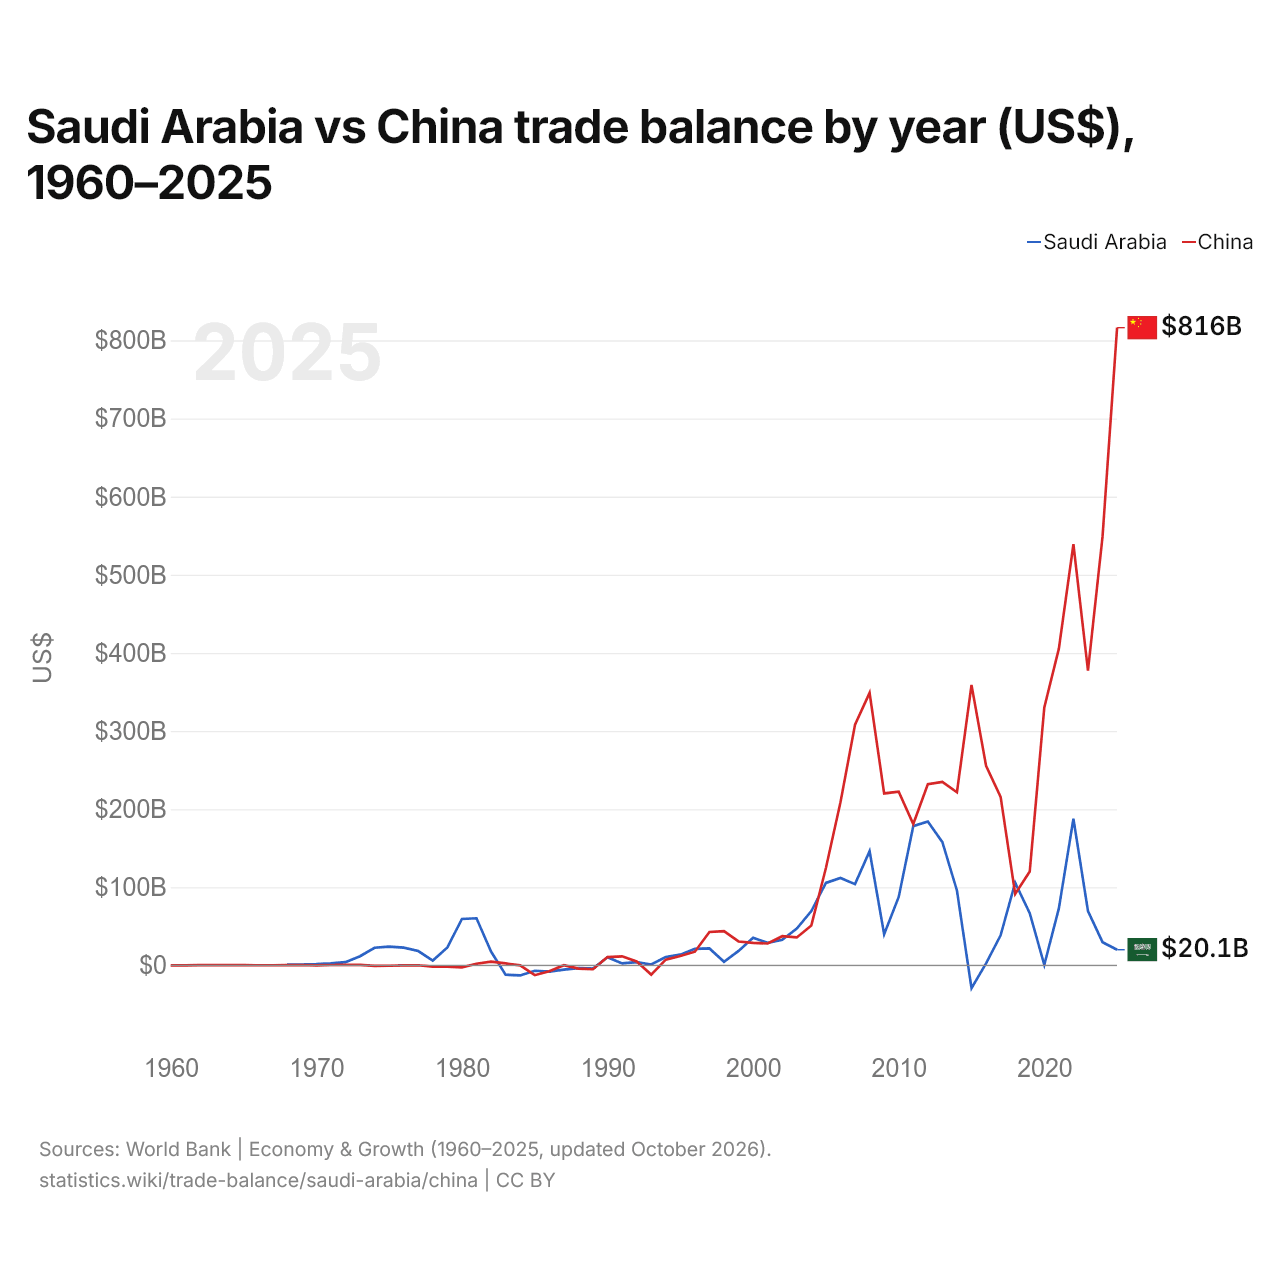
En 2025, la balance commerciale de l'Arabie saoudite affichait un excédent de 20,1 milliards de dollars et celle de la Chine un excédent de 816 milliards de dollars ; l'excédent de la Chine était 41 fois plus grand. En 1968, la balance commerciale de l'Arabie saoudite affichait un excédent de 964 millions de dollars et celle de la Chine un excédent de 269 millions de dollars.
De 1968 à 2025, la balance commerciale de l'Arabie saoudite a été excédentaire pendant 50 des 58 années, et celle de la Chine pendant 48. Les balances commerciales de l'Arabie saoudite et de la Chine ont été déficitaires en même temps pendant 4 de ces années, la dernière fois en 1989.
Arabie saoudite vs Chine : chiffres de la balance commerciale
|
Arabie saoudite
|
Chine
|
|
|---|---|---|
| Biens et services, $ US | +20,1 Md $US (2025) | +816 Md $US (2025) |
| % du PIB | +1,6 % (2025) | +4,2 % (2025) |
| Années d'excédent depuis 2000 | 25 sur 26 | 26 sur 26 |
| Solde des biens entre les deux, chiffres propres | −61,7 Md $US (2025) | −1,19 Md $US (2025) |
| Premier excédent en biens avec | Émirats arabes unis (+14,2 Md $US, 2025) | États-Unis (+280 Md $US, 2025) |
| Premier déficit en biens avec | Chine (−61,7 Md $US, 2025) | Australie (−51,6 Md $US, 2025) |
Comparer la balance commerciale de 2 pays au choix
Sources :
- Banque mondiale | Économie et croissance (1960–2025, mis à jour en octobre 2026)
- TradeMap (2001–2025, mis à jour en octobre 2026)
Creative Commons Attribution (CC BY) : vous pouvez copier, partager, adapter et réutiliser ce contenu, y compris à des fins commerciales, à condition de citer statistics.wiki et d’indiquer les modifications apportées. Les sources citées ci-dessus peuvent avoir leurs propres conditions de licence.