
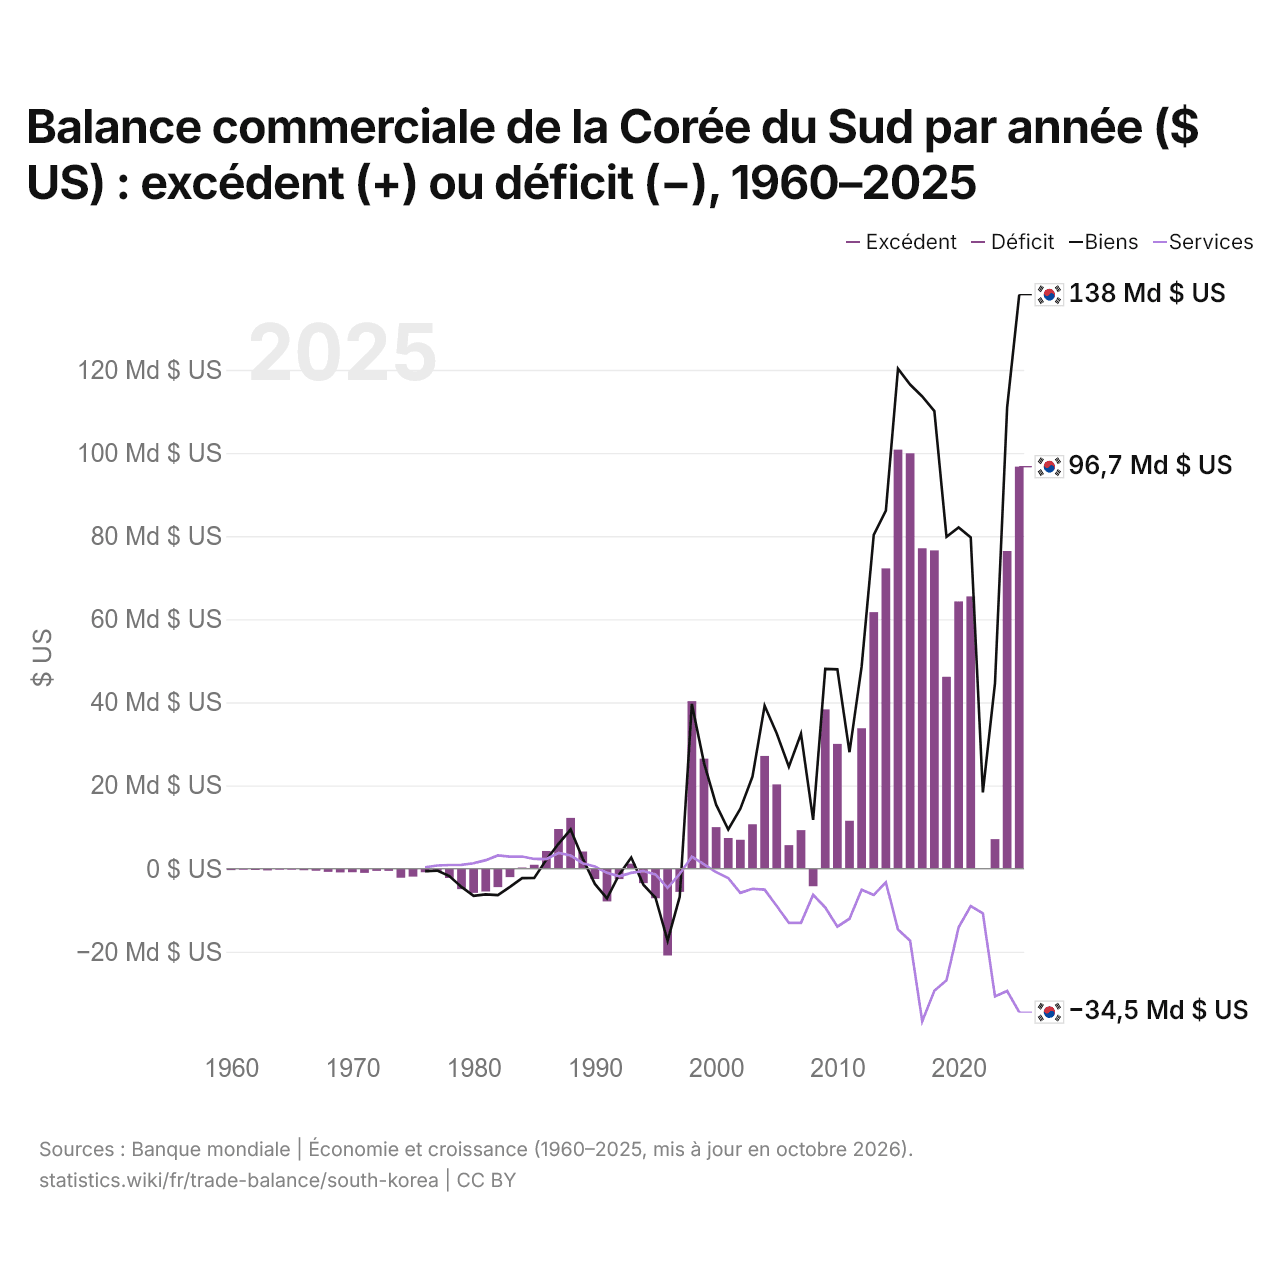
Balance commerciale de la Corée du Sud par année ($ US) : excédent (+) ou déficit (−), 1960–2025
| Année | $ US | ||
|---|---|---|---|
| Biens et services | Biens | Services | |
| 2025 | 96 698 362 989 $ US | 138 073 200 000 $ US | −34 519 400 000 $ US |
| 2024 | 76 402 970 569 $ US | 110 910 000 000 $ US | −29 428 400 000 $ US |
| 2023 | 7 101 605 507 $ US | 44 630 500 000 $ US | −30 742 500 000 $ US |
| 2022 | 82 310 794 $ US | 18 334 700 000 $ US | −10 750 700 000 $ US |
| 2021 | 65 481 873 055 $ US | 79 659 100 000 $ US | −8 994 400 000 $ US |
| 2020 | 64 276 707 840 $ US | 82 065 400 000 $ US | −14 117 300 000 $ US |
| 2019 | 46 150 387 327 $ US | 79 812 100 000 $ US | −26 845 300 000 $ US |
| 2018 | 76 567 178 709 $ US | 110 086 800 000 $ US | −29 369 400 000 $ US |
| 2017 | 77 055 294 744 $ US | 113 592 900 000 $ US | −36 734 100 000 $ US |
| 2016 | 99 901 056 844 $ US | 116 461 700 000 $ US | −17 338 400 000 $ US |
| 2015 | 100 788 936 759 $ US | 120 275 000 000 $ US | −14 625 800 000 $ US |
| 2014 | 72 225 409 369 $ US | 86 145 000 000 $ US | −3 290 100 000 $ US |
| 2013 | 61 693 588 710 $ US | 80 259 000 000 $ US | −6 328 800 000 $ US |
| 2012 | 33 781 393 029 $ US | 48 589 300 000 $ US | −5 057 500 000 $ US |
| 2011 | 11 528 980 405 $ US | 28 014 300 000 $ US | −12 056 500 000 $ US |
| 2010 | 30 009 857 669 $ US | 47 932 300 000 $ US | −13 972 800 000 $ US |
| 2009 | 38 306 406 772 $ US | 48 055 600 000 $ US | −9 337 700 000 $ US |
| 2008 | −4 246 825 475 $ US | 11 746 100 000 $ US | −6 310 700 000 $ US |
| 2007 | 9 266 970 515 $ US | 32 436 100 000 $ US | −13 039 500 000 $ US |
| 2006 | 5 656 424 106 $ US | 24 514 500 000 $ US | −13 040 200 000 $ US |
| 2005 | 20 259 605 180 $ US | 32 492 500 000 $ US | −8 984 200 000 $ US |
| 2004 | 27 107 988 760 $ US | 39 173 000 000 $ US | −5 050 400 000 $ US |
| 2003 | 10 674 260 176 $ US | 22 138 000 000 $ US | −4 845 100 000 $ US |
| 2002 | 6 950 508 609 $ US | 14 413 600 000 $ US | −5 826 300 000 $ US |
| 2001 | 7 367 033 139 $ US | 9 406 500 000 $ US | −2 266 300 000 $ US |
| 2000 | 9 976 767 474 $ US | 15 392 500 000 $ US | −845 700 000 $ US |
| 1999 | 26 453 531 482 $ US | 25 446 400 000 $ US | 1 042 100 000 $ US |
| 1998 | 40 304 995 581 $ US | 39 613 800 000 $ US | 2 881 300 000 $ US |
| 1997 | −5 592 515 925 $ US | −6 745 000 000 $ US | −1 244 200 000 $ US |
| 1996 | −20 902 145 594 $ US | −17 346 500 000 $ US | −4 631 800 000 $ US |
| 1995 | −7 123 544 922 $ US | −7 004 000 000 $ US | −1 394 700 000 $ US |
| 1994 | −3 487 727 486 $ US | −3 860 800 000 $ US | −572 300 000 $ US |
| 1993 | 1 200 616 741 $ US | 2 682 700 000 $ US | −1 019 000 000 $ US |
| 1992 | −2 510 725 666 $ US | −1 440 400 000 $ US | −1 832 000 000 $ US |
| 1991 | −7 889 921 543 $ US | −7 153 400 000 $ US | −1 013 300 000 $ US |
| 1990 | −2 491 931 635 $ US | −3 689 400 000 $ US | 501 000 000 $ US |
| 1989 | 4 124 024 247 $ US | 2 410 400 000 $ US | 1 313 700 000 $ US |
| 1988 | 12 204 630 057 $ US | 9 415 400 000 $ US | 3 159 900 000 $ US |
| 1987 | 9 528 458 151 $ US | 5 977 900 000 $ US | 3 767 400 000 $ US |
| 1986 | 4 246 165 030 $ US | 2 132 200 000 $ US | 2 305 700 000 $ US |
| 1985 | 938 369 233 $ US | −2 253 600 000 $ US | 2 329 800 000 $ US |
| 1984 | 268 494 414 $ US | −2 285 500 000 $ US | 2 914 700 000 $ US |
| 1983 | −2 043 704 124 $ US | −4 381 600 000 $ US | 2 870 700 000 $ US |
| 1982 | −4 452 291 542 $ US | −6 363 800 000 $ US | 3 184 700 000 $ US |
| 1981 | −5 494 485 325 $ US | −6 201 600 000 $ US | 2 037 300 000 $ US |
| 1980 | −5 840 155 079 $ US | −6 563 400 000 $ US | 1 286 300 000 $ US |
| 1979 | −4 939 669 421 $ US | −4 395 000 000 $ US | 889 000 000 $ US |
| 1978 | −2 256 404 959 $ US | −1 780 000 000 $ US | 864 000 000 $ US |
| 1977 | −752 066 116 $ US | −477 000 000 $ US | 759 000 000 $ US |
| 1976 | −875 619 835 $ US | −590 000 000 $ US | 336 000 000 $ US |
| 1975 | −1 919 834 711 $ US | - | - |
| 1974 | −2 187 046 091 $ US | - | - |
| 1973 | −530 224 690 $ US | - | - |
| 1972 | −535 004 080 $ US | - | - |
| 1971 | −1 029 245 494 $ US | - | - |
| 1970 | −875 849 042 $ US | - | - |
| 1969 | −909 214 577 $ US | - | - |
| 1968 | −764 517 703 $ US | - | - |
| 1967 | −513 092 168 $ US | - | - |
| 1966 | −384 023 587 $ US | - | - |
| 1965 | −224 473 800 $ US | - | - |
| 1964 | −256 725 963 $ US | - | - |
| 1963 | −426 923 077 $ US | - | - |
| 1962 | −330 000 000 $ US | - | - |
| 1961 | −239 599 268 $ US | - | - |
| 1960 | −369 108 911 $ US | - | - |
En 2025, la balance commerciale de la Corée du Sud affichait un excédent de 96,7 milliards de dollars, contre un déficit de 369 millions de dollars en 1960. Le plus grand déficit a été de 20,9 milliards de dollars, en 1996, et le plus grand excédent de 101 milliards de dollars, en 2015. La balance commerciale de la Corée du Sud est excédentaire chaque année depuis 2009.
En 2025, le solde commercial de la Corée du Sud était le 4e plus élevé de 44 pays situés en Asie, où les soldes allaient d'un déficit de 68,9 milliards de dollars en Inde à un excédent de 816 milliards de dollars en Chine. De 2016 à 2025, les soldes commerciaux de la Corée du Sud ont totalisé un excédent de 610 milliards de dollars, contre un excédent de 359 milliards de dollars de 2006 à 2015. En 2025, les transactions courantes de la Corée du Sud affichaient un excédent de 6,6 % du PIB.
Commerce de biens de la Corée du Sud avec ses 10 principaux partenaires commerciaux, selon la Corée du Sud, 2025
| Pays | Exportations vers | Importations depuis | Solde | |
|---|---|---|---|---|
 Chine |
131 Md $US | 142 Md $US | −11,3 Md $US | vs Chine |
 États-Unis |
123 Md $US | 73,7 Md $US | +49,5 Md $US | |
 Vietnam |
62,8 Md $US | 31,8 Md $US | +31,0 Md $US | vs Vietnam |
 Japon |
28,3 Md $US | 48,9 Md $US | −20,6 Md $US | vs Japon |
 Australie |
14,2 Md $US | 32,1 Md $US | −17,9 Md $US | vs Australie |
 Arabie saoudite |
4,86 Md $US | 27,4 Md $US | −22,5 Md $US | vs Arabie saoudite |
 Singapour |
19,6 Md $US | 11,4 Md $US | +8,19 Md $US | vs Singapour |
 Allemagne |
9,27 Md $US | 21,6 Md $US | −12,4 Md $US | vs Allemagne |
 Malaisie |
12,4 Md $US | 15,5 Md $US | −3,14 Md $US | vs Malaisie |
 Inde |
19,2 Md $US | 6,42 Md $US | +12,8 Md $US | vs Inde |
Balance commerciale de la Corée du Sud : excédent (+) ou déficit (−)
| Biens et services, $ US, 2025 | +96,7 Md $US |
|---|---|
| % du PIB, 2025 | +5,2 % |
| Années d'excédent, 2000–2025 | 25 |
| Biens, $ US, 2025 | +138 Md $US |
| Services, $ US, 2025 | −34,5 Md $US |
| Premier excédent en biens, 2025 | États-Unis +49,5 Md $US |
| Premier déficit en biens, 2025 | Arabie saoudite −22,5 Md $US |
Comparer la balance commerciale de la Corée du Sud avec celle d'autres pays
Sources :
- TradeMap (2025, mis à jour en octobre 2026)
- Banque mondiale | Économie et croissance (1960–2025, mis à jour en octobre 2026)
Creative Commons Attribution (CC BY) : vous pouvez copier, partager, adapter et réutiliser ce contenu, y compris à des fins commerciales, à condition de citer statistics.wiki et d’indiquer les modifications apportées. Les sources citées ci-dessus peuvent avoir leurs propres conditions de licence.