
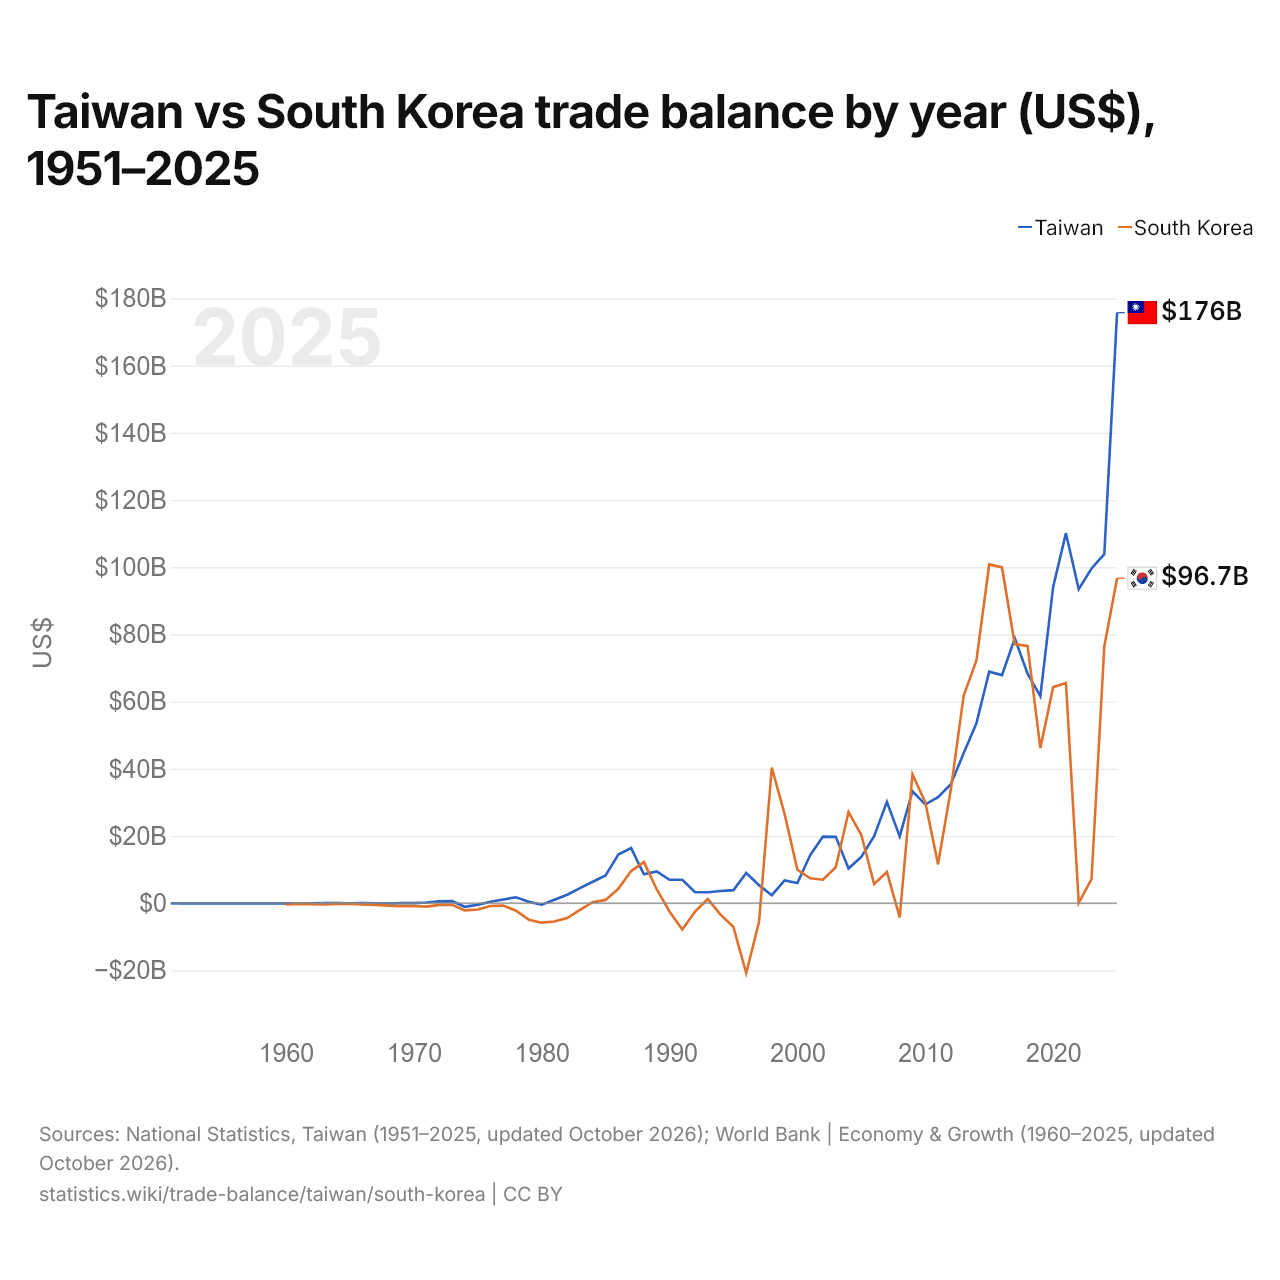
Taïwan vs Corée du Sud : balance commerciale par année ($ US), 1951–2025
| Année | $ US | |
|---|---|---|
 Taïwan |
 Corée du Sud |
|
| 2025 | 175 730 816 366 $ US | 96 698 362 989 $ US |
| 2024 | 103 868 298 391 $ US | 76 402 970 569 $ US |
| 2023 | 99 599 518 967 $ US | 7 101 605 507 $ US |
| 2022 | 93 419 145 167 $ US | 82 310 794 $ US |
| 2021 | 110 101 001 084 $ US | 65 481 873 055 $ US |
| 2020 | 94 112 135 102 $ US | 64 276 707 840 $ US |
| 2019 | 61 602 988 387 $ US | 46 150 387 327 $ US |
| 2018 | 68 289 323 756 $ US | 76 567 178 709 $ US |
| 2017 | 78 822 748 418 $ US | 77 055 294 744 $ US |
| 2016 | 67 843 592 121 $ US | 99 901 056 844 $ US |
| 2015 | 68 868 916 045 $ US | 100 788 936 759 $ US |
| 2014 | 53 534 889 165 $ US | 72 225 409 369 $ US |
| 2013 | 44 597 419 023 $ US | 61 693 588 710 $ US |
| 2012 | 35 346 921 251 $ US | 33 781 393 029 $ US |
| 2011 | 31 508 135 989 $ US | 11 528 980 405 $ US |
| 2010 | 29 390 983 001 $ US | 30 009 857 669 $ US |
| 2009 | 33 299 169 241 $ US | 38 306 406 772 $ US |
| 2008 | 19 856 679 259 $ US | −4 246 825 475 $ US |
| 2007 | 30 133 874 910 $ US | 9 266 970 515 $ US |
| 2006 | 19 902 056 091 $ US | 5 656 424 106 $ US |
| 2005 | 13 759 784 756 $ US | 20 259 605 180 $ US |
| 2004 | 10 294 009 209 $ US | 27 107 988 760 $ US |
| 2003 | 19 713 655 175 $ US | 10 674 260 176 $ US |
| 2002 | 19 796 152 635 $ US | 6 950 508 609 $ US |
| 2001 | 14 254 666 034 $ US | 7 367 033 139 $ US |
| 2000 | 5 967 270 867 $ US | 9 976 767 474 $ US |
| 1999 | 6 729 466 177 $ US | 26 453 531 482 $ US |
| 1998 | 2 346 260 930 $ US | 40 304 995 581 $ US |
| 1997 | 5 331 353 679 $ US | −5 592 515 925 $ US |
| 1996 | 8 954 373 984 $ US | −20 902 145 594 $ US |
| 1995 | 3 860 320 666 $ US | −7 123 544 922 $ US |
| 1994 | 3 583 749 045 $ US | −3 487 727 486 $ US |
| 1993 | 3 233 303 779 $ US | 1 200 616 741 $ US |
| 1992 | 3 255 558 306 $ US | −2 510 725 666 $ US |
| 1991 | 6 934 344 190 $ US | −7 889 921 543 $ US |
| 1990 | 6 937 400 638 $ US | −2 491 931 635 $ US |
| 1989 | 9 408 935 239 $ US | 4 124 024 247 $ US |
| 1988 | 8 553 507 565 $ US | 12 204 630 057 $ US |
| 1987 | 16 386 726 889 $ US | 9 528 458 151 $ US |
| 1986 | 14 458 795 432 $ US | 4 246 165 030 $ US |
| 1985 | 8 214 902 611 $ US | 938 369 233 $ US |
| 1984 | 6 327 452 175 $ US | 268 494 414 $ US |
| 1983 | 4 465 957 867 $ US | −2 043 704 124 $ US |
| 1982 | 2 460 201 845 $ US | −4 452 291 542 $ US |
| 1981 | 958 960 559 $ US | −5 494 485 325 $ US |
| 1980 | −493 172 173 $ US | −5 840 155 079 $ US |
| 1979 | 375 529 010 $ US | −4 939 669 421 $ US |
| 1978 | 1 730 897 279 $ US | −2 256 404 959 $ US |
| 1977 | 1 063 558 823 $ US | −752 066 116 $ US |
| 1976 | 401 639 929 $ US | −875 619 835 $ US |
| 1975 | −508 044 189 $ US | −1 919 834 711 $ US |
| 1974 | −1 120 599 261 $ US | −2 187 046 091 $ US |
| 1973 | 568 986 665 $ US | −530 224 690 $ US |
| 1972 | 493 599 487 $ US | −535 004 080 $ US |
| 1971 | 162 197 589 $ US | −1 029 245 494 $ US |
| 1970 | −2 850 037 $ US | −875 849 042 $ US |
| 1969 | −35 598 581 $ US | −909 214 577 $ US |
| 1968 | −120 794 414 $ US | −764 517 703 $ US |
| 1967 | −74 631 036 $ US | −513 092 168 $ US |
| 1966 | 8 725 544 $ US | −384 023 587 $ US |
| 1965 | −84 323 530 $ US | −224 473 800 $ US |
| 1964 | 19 377 804 $ US | −256 725 963 $ US |
| 1963 | −24 971 622 $ US | −426 923 077 $ US |
| 1962 | −102 918 436 $ US | −330 000 000 $ US |
| 1961 | −124 121 510 $ US | −239 599 268 $ US |
| 1960 | −129 280 153 $ US | −369 108 911 $ US |
| 1959 | −117 696 324 $ US | - |
| 1958 | −115 652 908 $ US | - |
| 1957 | −82 951 885 $ US | - |
| 1956 | −95 184 616 $ US | - |
| 1955 | −83 290 787 $ US | - |
| 1954 | −135 500 533 $ US | - |
| 1953 | −76 248 741 $ US | - |
| 1952 | −102 221 766 $ US | - |
| 1951 | −56 223 169 $ US | - |
En 2025, la balance commerciale de Taïwan affichait un excédent de 176 milliards de dollars et celle de la Corée du Sud un excédent de 96,7 milliards de dollars ; l'excédent de Taïwan était 1,8 fois plus grand. En 1960, la balance commerciale de Taïwan affichait un déficit de 129 millions de dollars et celle de la Corée du Sud un déficit de 369 millions de dollars.
De 1960 à 2025, la balance commerciale de Taïwan a été excédentaire pendant 54 des 66 années, et celle de la Corée du Sud pendant 34. Les balances commerciales de Taïwan et de la Corée du Sud ont été déficitaires en même temps pendant 12 de ces années, la dernière fois en 1980.
Taïwan vs Corée du Sud : chiffres de la balance commerciale
|
Taïwan
|
Corée du Sud
|
|
|---|---|---|
| Biens et services, $ US | +176 Md $US (2025) | +96,7 Md $US (2025) |
| % du PIB | +19,1 % (2025) | +5,2 % (2025) |
| Années d'excédent depuis 2000 | 26 sur 26 | 25 sur 26 |
| Solde des biens entre les deux, chiffres propres | n.d. | n.d. |
| Premier excédent en biens avec | n.d. | États-Unis (+49,5 Md $US, 2025) |
| Premier déficit en biens avec | n.d. | Arabie saoudite (−22,5 Md $US, 2025) |
Comparer la balance commerciale de 2 pays au choix
Sources :
- National Statistics, Taiwan (1951–2025, mis à jour en octobre 2026)
- Banque mondiale | Économie et croissance (1960–2025, mis à jour en octobre 2026)
- TradeMap (2025, mis à jour en octobre 2026)
Creative Commons Attribution (CC BY) : vous pouvez copier, partager, adapter et réutiliser ce contenu, y compris à des fins commerciales, à condition de citer statistics.wiki et d’indiquer les modifications apportées. Les sources citées ci-dessus peuvent avoir leurs propres conditions de licence.