
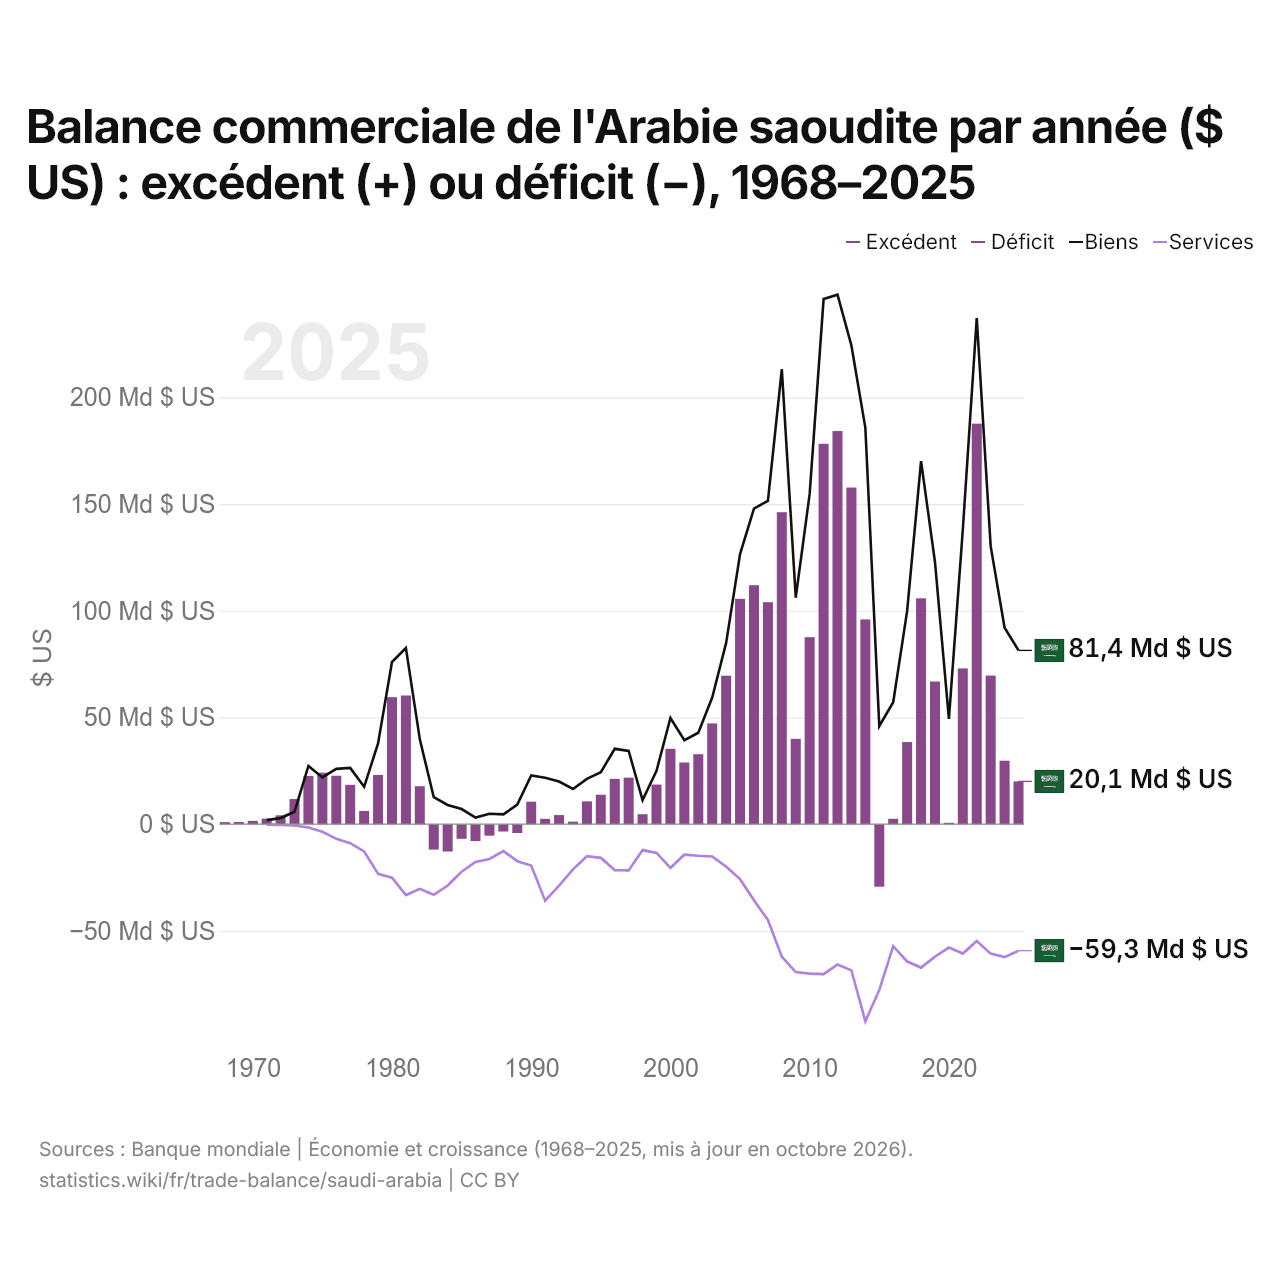
Balance commerciale de l'Arabie saoudite par année ($ US) : excédent (+) ou déficit (−), 1968–2025
| Année | $ US | ||
|---|---|---|---|
| Biens et services | Biens | Services | |
| 2025 | 20 067 466 667 $ US | 81 434 306 580 $ US | −59 271 356 131 $ US |
| 2024 | 29 736 533 333 $ US | 92 024 537 448 $ US | −62 287 555 438 $ US |
| 2023 | 69 635 466 667 $ US | 130 289 777 767 $ US | −60 654 331 033 $ US |
| 2022 | 187 668 533 333 $ US | 237 190 929 760 $ US | −54 697 131 531 $ US |
| 2021 | 72 986 133 333 $ US | 137 992 064 533 $ US | −60 634 362 013 $ US |
| 2020 | 664 000 000 $ US | 49 324 213 333 $ US | −57 800 447 490 $ US |
| 2019 | 66 885 333 333 $ US | 122 867 641 113 $ US | −62 034 968 877 $ US |
| 2018 | 105 847 466 667 $ US | 170 120 133 333 $ US | −67 199 444 371 $ US |
| 2017 | 38 494 666 667 $ US | 99 806 098 507 $ US | −64 353 250 615 $ US |
| 2016 | 2 512 533 333 $ US | 57 165 759 901 $ US | −57 168 400 628 $ US |
| 2015 | −29 296 800 000 $ US | 46 012 158 933 $ US | −77 713 201 531 $ US |
| 2014 | 95 966 400 000 $ US | 185 733 234 007 $ US | −92 375 895 782 $ US |
| 2013 | 157 750 133 333 $ US | 224 238 861 867 $ US | −68 496 765 853 $ US |
| 2012 | 184 213 333 333 $ US | 248 126 373 333 $ US | −65 774 507 550 $ US |
| 2011 | 178 246 400 000 $ US | 246 053 822 933 $ US | −70 243 797 208 $ US |
| 2010 | 87 628 266 667 $ US | 154 780 160 008 $ US | −70 035 205 901 $ US |
| 2009 | 39 987 200 000 $ US | 106 185 067 200 $ US | −69 281 295 018 $ US |
| 2008 | 146 168 800 000 $ US | 213 178 264 000 $ US | −62 085 773 817 $ US |
| 2007 | 104 039 226 151 $ US | 151 533 313 788 $ US | −44 854 851 090 $ US |
| 2006 | 112 011 748 999 $ US | 147 891 383 572 $ US | −35 682 827 193 $ US |
| 2005 | 105 591 257 239 $ US | 126 613 453 333 $ US | −25 751 464 948 $ US |
| 2004 | 69 570 133 333 $ US | 84 947 200 000 $ US | −19 843 946 667 $ US |
| 2003 | 47 212 533 333 $ US | 59 376 373 333 $ US | −15 144 613 333 $ US |
| 2002 | 32 810 933 333 $ US | 42 840 000 000 $ US | −14 802 800 000 $ US |
| 2001 | 28 922 133 333 $ US | 39 365 827 467 $ US | −14 273 081 333 $ US |
| 2000 | 35 333 333 333 $ US | 49 776 533 333 $ US | −20 449 066 667 $ US |
| 1999 | 18 576 266 667 $ US | 25 005 733 333 $ US | −13 457 173 333 $ US |
| 1998 | 4 662 133 333 $ US | 11 272 266 667 $ US | −12 135 066 667 $ US |
| 1997 | 21 789 586 115 $ US | 34 316 533 333 $ US | −21 678 000 000 $ US |
| 1996 | 21 247 797 063 $ US | 35 323 200 000 $ US | −21 494 266 667 $ US |
| 1995 | 13 809 612 817 $ US | 24 357 866 667 $ US | −15 782 000 000 $ US |
| 1994 | 10 720 160 214 $ US | 21 260 800 000 $ US | −15 026 266 667 $ US |
| 1993 | 1 194 926 569 $ US | 16 500 000 000 $ US | −21 153 066 667 $ US |
| 1992 | 4 279 305 741 $ US | 20 012 533 333 $ US | −28 777 333 333 $ US |
| 1991 | 2 535 380 507 $ US | 21 789 333 333 $ US | −35 848 000 000 $ US |
| 1990 | 10 541 522 029 $ US | 22 858 666 667 $ US | −19 357 333 333 $ US |
| 1989 | −4 130 040 053 $ US | 9 141 333 333 $ US | −17 341 333 333 $ US |
| 1988 | −3 423 497 997 $ US | 4 565 333 333 $ US | −12 624 000 000 $ US |
| 1987 | −5 373 831 776 $ US | 4 909 333 333 $ US | −16 293 333 333 $ US |
| 1986 | −7 899 000 810 $ US | 3 116 357 504 $ US | −17 716 020 236 $ US |
| 1985 | −6 827 443 401 $ US | 7 114 586 859 $ US | −22 260 346 854 $ US |
| 1984 | −12 800 510 783 $ US | 8 987 429 093 $ US | −28 744 448 780 $ US |
| 1983 | −11 894 066 570 $ US | 12 646 322 914 $ US | −33 107 951 817 $ US |
| 1982 | 17 796 370 134 $ US | 39 758 812 108 $ US | −30 287 288 783 $ US |
| 1981 | 60 310 278 645 $ US | 82 533 425 657 $ US | −33 214 995 782 $ US |
| 1980 | 59 490 035 596 $ US | 76 011 312 393 $ US | −25 039 515 650 $ US |
| 1979 | 23 056 756 397 $ US | 37 859 620 284 $ US | −23 238 261 115 $ US |
| 1978 | 6 195 798 165 $ US | 17 514 022 646 $ US | −12 769 293 300 $ US |
| 1977 | 18 443 064 170 $ US | 26 354 123 974 $ US | −8 865 084 760 $ US |
| 1976 | 22 707 932 011 $ US | 25 929 178 478 $ US | −6 861 189 804 $ US |
| 1975 | 24 135 407 771 $ US | 21 884 161 494 $ US | −3 533 646 757 $ US |
| 1974 | 22 585 633 803 $ US | 27 301 408 458 $ US | −1 518 309 860 $ US |
| 1973 | 11 776 865 468 $ US | 5 849 043 356 $ US | −598 933 406 $ US |
| 1972 | 4 185 774 158 $ US | 2 861 449 020 $ US | −291 935 355 $ US |
| 1971 | 2 591 362 408 $ US | 1 901 119 747 $ US | −220 645 785 $ US |
| 1970 | 1 572 222 222 $ US | - | - |
| 1969 | 1 042 836 022 $ US | - | - |
| 1968 | 963 960 711 $ US | - | - |
En 2025, la balance commerciale de l'Arabie saoudite affichait un excédent de 20,1 milliards de dollars, contre un excédent de 964 millions de dollars en 1968. Le plus grand déficit a été de 29,3 milliards de dollars, en 2015, et le plus grand excédent de 188 milliards de dollars, en 2022. La balance commerciale de l'Arabie saoudite est excédentaire chaque année depuis 2016.
En 2025, le solde commercial de l'Arabie saoudite était le 11e plus élevé de 44 pays situés en Asie, où les soldes allaient d'un déficit de 68,9 milliards de dollars en Inde à un excédent de 816 milliards de dollars en Chine. De 2016 à 2025, les soldes commerciaux de l'Arabie saoudite ont totalisé un excédent de 594 milliards de dollars, contre un excédent de 1,08 billion de dollars de 2006 à 2015. En 2025, les transactions courantes de l'Arabie saoudite affichaient un déficit de 2,6 % du PIB.
Commerce de biens de l'Arabie saoudite avec ses 10 principaux partenaires commerciaux, selon l'Arabie saoudite, 2025
| Pays | Exportations vers | Importations depuis | Solde | |
|---|---|---|---|---|
 Chine |
7,32 Md $US | 69,0 Md $US | −61,7 Md $US | vs Chine |
 EAU |
28,5 Md $US | 14,4 Md $US | +14,2 Md $US | vs EAU |
 États-Unis |
2,49 Md $US | 21,0 Md $US | −18,5 Md $US | vs USA |
 Inde |
8,81 Md $US | 12,1 Md $US | −3,28 Md $US | vs Inde |
 Allemagne |
529 M $US | 11,2 Md $US | −10,6 Md $US | vs Allemagne |
 Japon |
689 M $US | 10,2 Md $US | −9,50 Md $US | vs Japon |
 Égypte |
2,84 Md $US | 6,60 Md $US | −3,76 Md $US | vs Égypte |
 Italie |
907 M $US | 8,17 Md $US | −7,26 Md $US | |
 Suisse |
1,34 Md $US | 6,67 Md $US | −5,33 Md $US | vs Suisse |
 France |
983 M $US | 7,00 Md $US | −6,02 Md $US | vs France |
Balance commerciale de l'Arabie saoudite : excédent (+) ou déficit (−)
| Biens et services, $ US, 2025 | +20,1 Md $US |
|---|---|
| % du PIB, 2025 | +1,6 % |
| Années d'excédent, 2000–2025 | 25 |
| Biens, $ US, 2025 | +81,4 Md $US |
| Services, $ US, 2025 | −59,3 Md $US |
| Premier excédent en biens, 2025 | Émirats arabes unis +14,2 Md $US |
| Premier déficit en biens, 2025 | Chine −61,7 Md $US |
Comparer la balance commerciale de l'Arabie saoudite avec celle d'autres pays
Sources :
- TradeMap (2025, mis à jour en octobre 2026)
- Banque mondiale | Économie et croissance (1968–2025, mis à jour en octobre 2026)
Creative Commons Attribution (CC BY) : vous pouvez copier, partager, adapter et réutiliser ce contenu, y compris à des fins commerciales, à condition de citer statistics.wiki et d’indiquer les modifications apportées. Les sources citées ci-dessus peuvent avoir leurs propres conditions de licence.