
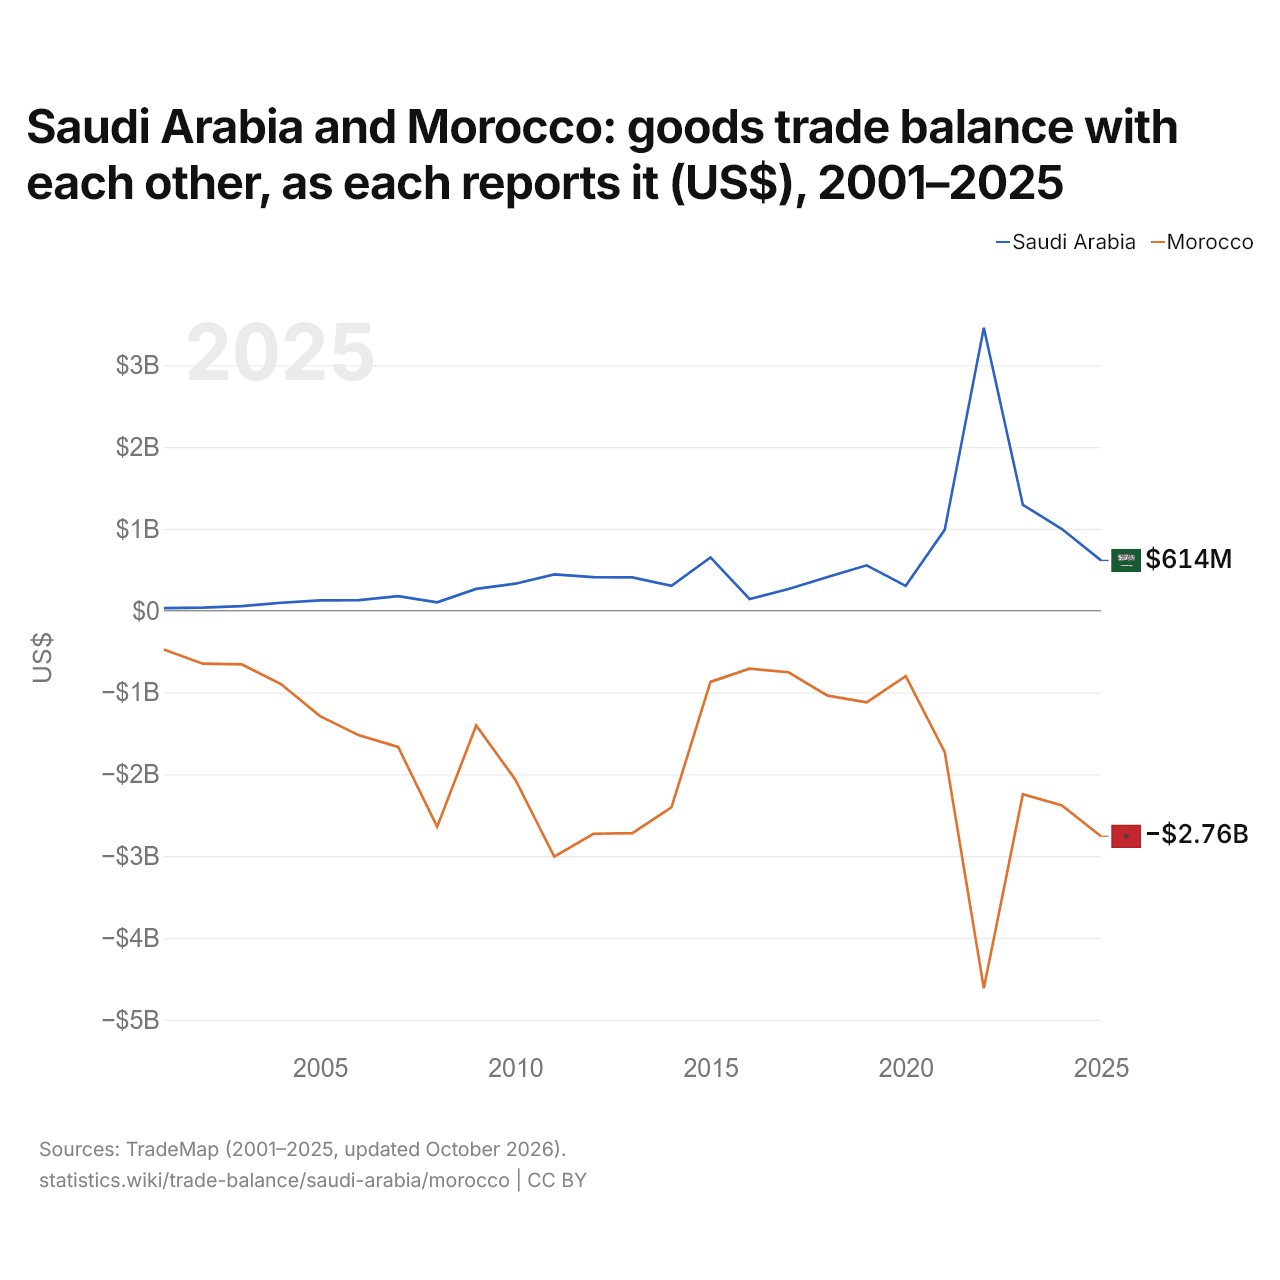
L'Arabie saoudite et le Maroc : solde de leur commerce de biens bilatéral, selon chacun ($ US), 2001–2025
| Année | $ US | |
|---|---|---|
| Arabie saoudite | Maroc | |
| 2025 | 613 969 000 $ US | −2 757 668 000 $ US |
| 2024 | 997 222 000 $ US | −2 382 059 000 $ US |
| 2023 | 1 293 608 000 $ US | −2 243 183 000 $ US |
| 2022 | 3 458 680 000 $ US | −4 616 352 000 $ US |
| 2021 | 990 396 000 $ US | −1 729 535 000 $ US |
| 2020 | 303 025 000 $ US | −800 461 000 $ US |
| 2019 | 554 071 000 $ US | −1 120 575 000 $ US |
| 2018 | 411 454 000 $ US | −1 039 339 000 $ US |
| 2017 | 264 914 000 $ US | −753 018 000 $ US |
| 2016 | 142 369 000 $ US | −708 966 000 $ US |
| 2015 | 651 183 000 $ US | −871 084 000 $ US |
| 2014 | 303 050 000 $ US | −2 404 925 000 $ US |
| 2013 | 406 641 000 $ US | −2 719 190 000 $ US |
| 2012 | 409 014 000 $ US | −2 726 736 000 $ US |
| 2011 | 442 833 000 $ US | −3 008 430 000 $ US |
| 2010 | 329 439 000 $ US | −2 063 625 000 $ US |
| 2009 | 266 084 000 $ US | −1 403 774 000 $ US |
| 2008 | 102 479 000 $ US | −2 641 480 000 $ US |
| 2007 | 177 300 000 $ US | −1 666 207 000 $ US |
| 2006 | 127 976 000 $ US | −1 524 392 000 $ US |
| 2005 | 126 145 000 $ US | −1 289 568 000 $ US |
| 2004 | 96 789 000 $ US | −896 813 000 $ US |
| 2003 | 54 635 000 $ US | −657 377 000 $ US |
| 2002 | 36 837 000 $ US | −648 090 000 $ US |
| 2001 | 31 705 000 $ US | −473 702 000 $ US |
En 2025, selon l'Arabie saoudite, son commerce de biens avec le Maroc affichait un excédent de 614 millions de dollars ; selon le Maroc, son commerce de biens avec l'Arabie saoudite affichait un déficit de 2,76 milliards de dollars. En 2001, les chiffres étaient un excédent de 31,7 millions de dollars pour l'Arabie saoudite et un déficit de 474 millions de dollars pour le Maroc.
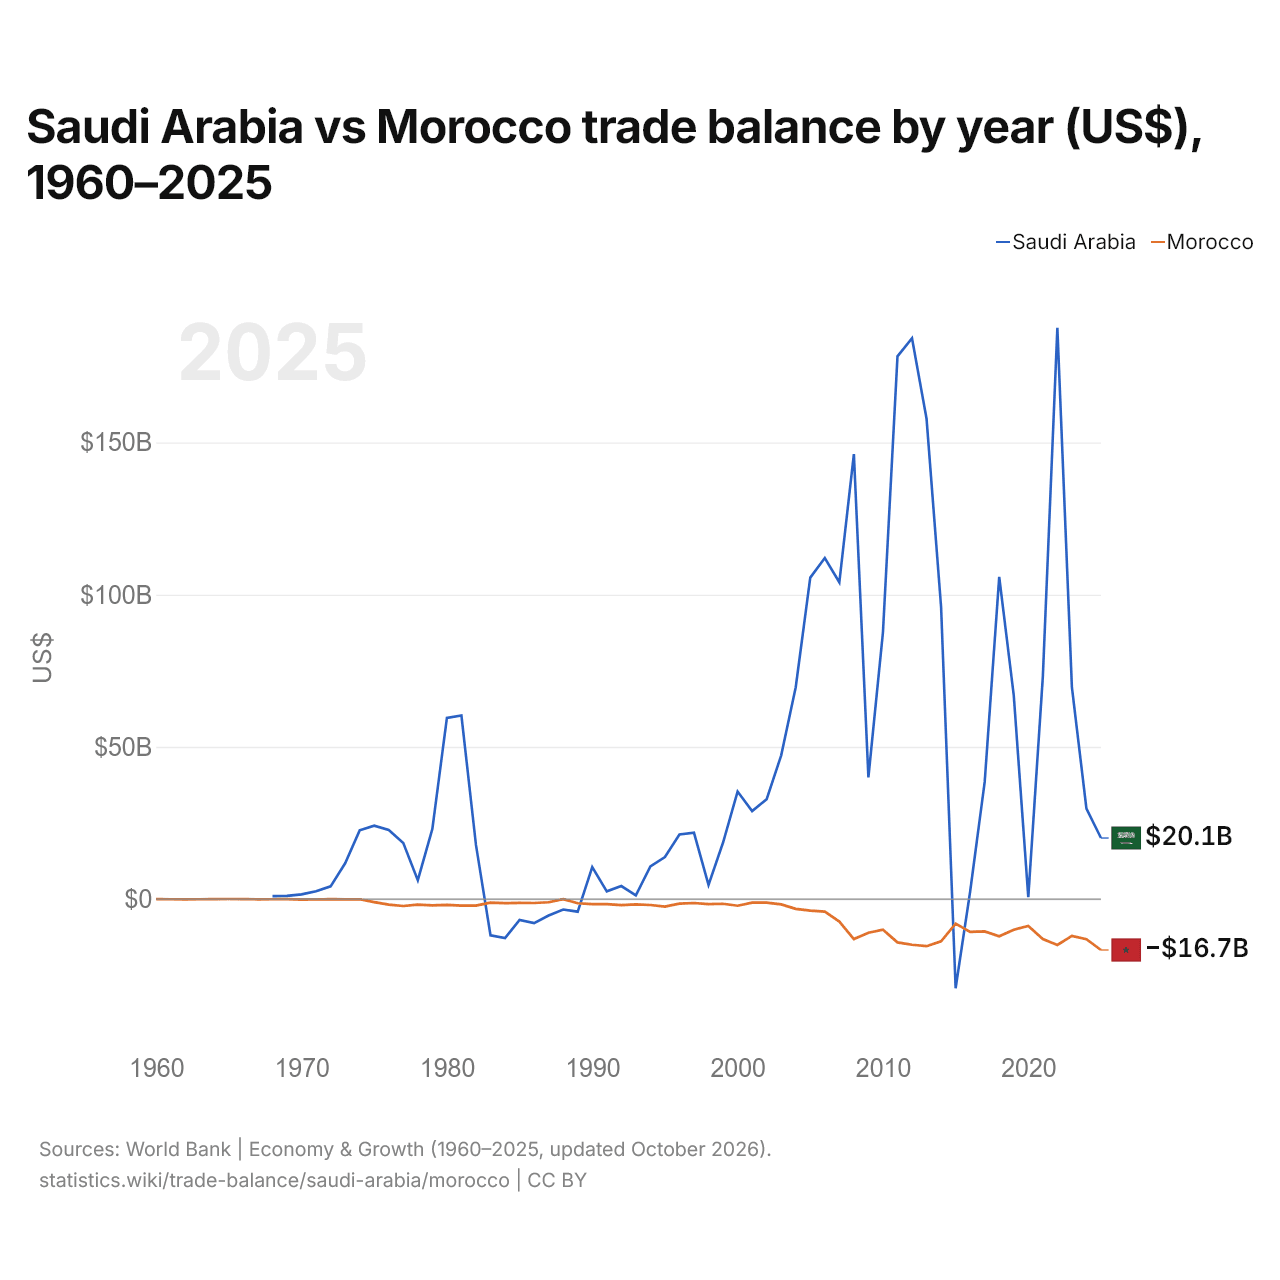
Arabie saoudite vs Maroc : balance commerciale par année ($ US), 1960–2025
| Année | $ US | |
|---|---|---|
 Arabie saoudite |
 Maroc |
|
| 2025 | 20 067 466 667 $ US | −16 711 370 159 $ US |
| 2024 | 29 736 533 333 $ US | −13 154 358 447 $ US |
| 2023 | 69 635 466 667 $ US | −12 095 698 963 $ US |
| 2022 | 187 668 533 333 $ US | −15 070 969 799 $ US |
| 2021 | 72 986 133 333 $ US | −13 138 811 840 $ US |
| 2020 | 664 000 000 $ US | −8 804 922 307 $ US |
| 2019 | 66 885 333 333 $ US | −10 071 252 426 $ US |
| 2018 | 105 847 466 667 $ US | −12 222 219 618 $ US |
| 2017 | 38 494 666 667 $ US | −10 621 752 089 $ US |
| 2016 | 2 512 533 333 $ US | −10 770 661 075 $ US |
| 2015 | −29 296 800 000 $ US | −8 056 861 554 $ US |
| 2014 | 95 966 400 000 $ US | −13 852 049 948 $ US |
| 2013 | 157 750 133 333 $ US | −15 452 612 955 $ US |
| 2012 | 184 213 333 333 $ US | −15 001 080 728 $ US |
| 2011 | 178 246 400 000 $ US | −14 219 008 328 $ US |
| 2010 | 87 628 266 667 $ US | −10 050 304 390 $ US |
| 2009 | 39 987 200 000 $ US | −11 062 913 455 $ US |
| 2008 | 146 168 800 000 $ US | −13 124 997 984 $ US |
| 2007 | 104 039 226 151 $ US | −7 385 441 974 $ US |
| 2006 | 112 011 748 999 $ US | −4 108 550 667 $ US |
| 2005 | 105 591 257 239 $ US | −3 788 292 814 $ US |
| 2004 | 69 570 133 333 $ US | −3 208 669 864 $ US |
| 2003 | 47 212 533 333 $ US | −1 728 628 059 $ US |
| 2002 | 32 810 933 333 $ US | −1 139 912 204 $ US |
| 2001 | 28 922 133 333 $ US | −1 183 660 488 $ US |
| 2000 | 35 333 333 333 $ US | −2 170 940 439 $ US |
| 1999 | 18 576 266 667 $ US | −1 531 205 001 $ US |
| 1998 | 4 662 133 333 $ US | −1 668 096 217 $ US |
| 1997 | 21 789 586 115 $ US | −1 292 630 083 $ US |
| 1996 | 21 247 797 063 $ US | −1 477 676 771 $ US |
| 1995 | 13 809 612 817 $ US | −2 485 677 026 $ US |
| 1994 | 10 720 160 214 $ US | −1 935 637 021 $ US |
| 1993 | 1 194 926 569 $ US | −1 755 914 442 $ US |
| 1992 | 4 279 305 741 $ US | −1 995 360 541 $ US |
| 1991 | 2 535 380 507 $ US | −1 660 046 700 $ US |
| 1990 | 10 541 522 029 $ US | −1 662 325 914 $ US |
| 1989 | −4 130 040 053 $ US | −1 379 125 300 $ US |
| 1988 | −3 423 497 997 $ US | −37 146 581 $ US |
| 1987 | −5 373 831 776 $ US | −1 021 875 832 $ US |
| 1986 | −7 899 000 810 $ US | −1 268 123 845 $ US |
| 1985 | −6 827 443 401 $ US | −1 242 570 804 $ US |
| 1984 | −12 800 510 783 $ US | −1 348 202 879 $ US |
| 1983 | −11 894 066 570 $ US | −1 154 613 565 $ US |
| 1982 | 17 796 370 134 $ US | −2 146 213 313 $ US |
| 1981 | 60 310 278 645 $ US | −2 151 238 058 $ US |
| 1980 | 59 490 035 596 $ US | −1 883 905 741 $ US |
| 1979 | 23 056 756 397 $ US | −2 045 402 902 $ US |
| 1978 | 6 195 798 165 $ US | −1 813 126 114 $ US |
| 1977 | 18 443 064 170 $ US | −2 256 944 059 $ US |
| 1976 | 22 707 932 011 $ US | −1 803 221 859 $ US |
| 1975 | 24 135 407 771 $ US | −976 930 956 $ US |
| 1974 | 22 585 633 803 $ US | −48 812 671 $ US |
| 1973 | 11 776 865 468 $ US | −79 232 106 $ US |
| 1972 | 4 185 774 158 $ US | −32 929 056 $ US |
| 1971 | 2 591 362 408 $ US | −120 793 060 $ US |
| 1970 | 1 572 222 222 $ US | −155 973 038 $ US |
| 1969 | 1 042 836 022 $ US | −16 599 183 $ US |
| 1968 | 963 960 711 $ US | −51 378 424 $ US |
| 1967 | - | −69 163 263 $ US |
| 1966 | - | −11 856 559 $ US |
| 1965 | - | 37 545 771 $ US |
| 1964 | - | 9 880 387 $ US |
| 1963 | - | −57 306 684 $ US |
| 1962 | - | −73 115 430 $ US |
| 1961 | - | −61 258 870 $ US |
| 1960 | - | 17 784 859 $ US |
En 2025, la balance commerciale de l'Arabie saoudite affichait un excédent de 20,1 milliards de dollars et celle du Maroc un déficit de 16,7 milliards de dollars. En 1968, la balance commerciale de l'Arabie saoudite affichait un excédent de 964 millions de dollars et celle du Maroc un déficit de 51,4 millions de dollars.
De 1968 à 2025, la balance commerciale de l'Arabie saoudite a été excédentaire pendant 50 des 58 années, et celle du Maroc pendant aucune. Les balances commerciales de l'Arabie saoudite et du Maroc ont été déficitaires en même temps pendant 8 de ces années, la dernière fois en 2015.
Arabie saoudite vs Maroc : chiffres de la balance commerciale
|
Arabie saoudite
|
Maroc
|
|
|---|---|---|
| Biens et services, $ US | +20,1 Md $US (2025) | −16,7 Md $US (2025) |
| % du PIB | +1,6 % (2025) | −9,2 % (2025) |
| Années d'excédent depuis 2000 | 25 sur 26 | 0 sur 26 |
| Solde des biens entre les deux, chiffres propres | +614 M $US (2025) | −2,76 Md $US (2025) |
| Premier excédent en biens avec | Émirats arabes unis (+14,2 Md $US, 2025) | France (+1,63 Md $US, 2025) |
| Premier déficit en biens avec | Chine (−61,7 Md $US, 2025) | Chine (−11,8 Md $US, 2025) |
Comparer la balance commerciale de 2 pays au choix
Sources :
- Banque mondiale | Économie et croissance (1960–2025, mis à jour en octobre 2026)
- TradeMap (2001–2025, mis à jour en octobre 2026)
Creative Commons Attribution (CC BY) : vous pouvez copier, partager, adapter et réutiliser ce contenu, y compris à des fins commerciales, à condition de citer statistics.wiki et d’indiquer les modifications apportées. Les sources citées ci-dessus peuvent avoir leurs propres conditions de licence.