
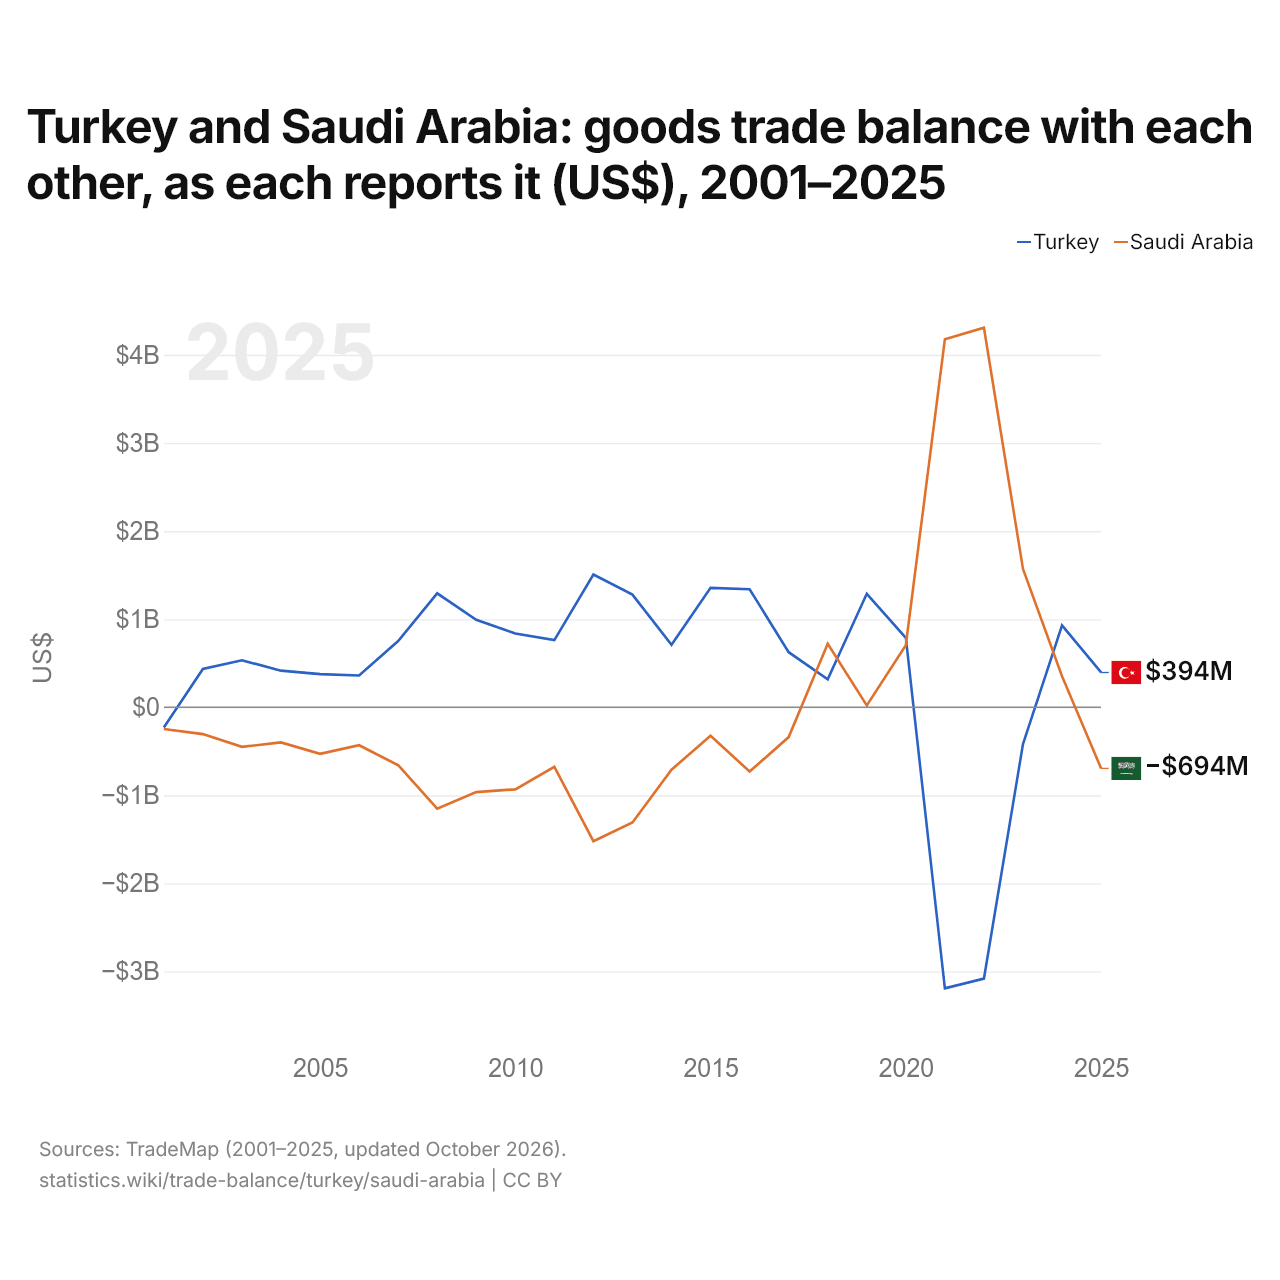
La Turquie et l'Arabie saoudite : solde de leur commerce de biens bilatéral, selon chacun ($ US), 2001–2025
| Année | $ US | |
|---|---|---|
| Turquie | Arabie saoudite | |
| 2025 | 394 377 000 $ US | −694 255 000 $ US |
| 2024 | 930 313 000 $ US | 351 345 000 $ US |
| 2023 | −417 757 000 $ US | 1 569 703 000 $ US |
| 2022 | −3 080 270 000 $ US | 4 308 525 000 $ US |
| 2021 | −3 191 015 000 $ US | 4 177 141 000 $ US |
| 2020 | 788 119 000 $ US | 704 258 000 $ US |
| 2019 | 1 287 840 000 $ US | 20 339 000 $ US |
| 2018 | 317 628 000 $ US | 720 696 000 $ US |
| 2017 | 624 361 000 $ US | −339 048 000 $ US |
| 2016 | 1 339 735 000 $ US | −730 495 000 $ US |
| 2015 | 1 355 414 000 $ US | −323 664 000 $ US |
| 2014 | 708 610 000 $ US | −709 188 000 $ US |
| 2013 | 1 278 017 000 $ US | −1 308 328 000 $ US |
| 2012 | 1 505 569 000 $ US | −1 521 109 000 $ US |
| 2011 | 761 947 000 $ US | −677 063 000 $ US |
| 2010 | 837 045 000 $ US | −932 088 000 $ US |
| 2009 | 992 432 000 $ US | −963 864 000 $ US |
| 2008 | 1 292 958 000 $ US | −1 151 664 000 $ US |
| 2007 | 751 216 000 $ US | −658 046 000 $ US |
| 2006 | 360 196 000 $ US | −431 566 000 $ US |
| 2005 | 374 960 000 $ US | −528 960 000 $ US |
| 2004 | 414 577 000 $ US | −399 848 000 $ US |
| 2003 | 532 954 000 $ US | −450 229 000 $ US |
| 2002 | 433 815 000 $ US | −305 141 000 $ US |
| 2001 | −229 003 000 $ US | −247 213 000 $ US |
En 2025, selon la Turquie, son commerce de biens avec l'Arabie saoudite affichait un excédent de 394 millions de dollars ; selon l'Arabie saoudite, son commerce de biens avec la Turquie affichait un déficit de 694 millions de dollars. En 2001, les chiffres étaient un déficit de 229 millions de dollars pour la Turquie et un déficit de 247 millions de dollars pour l'Arabie saoudite.
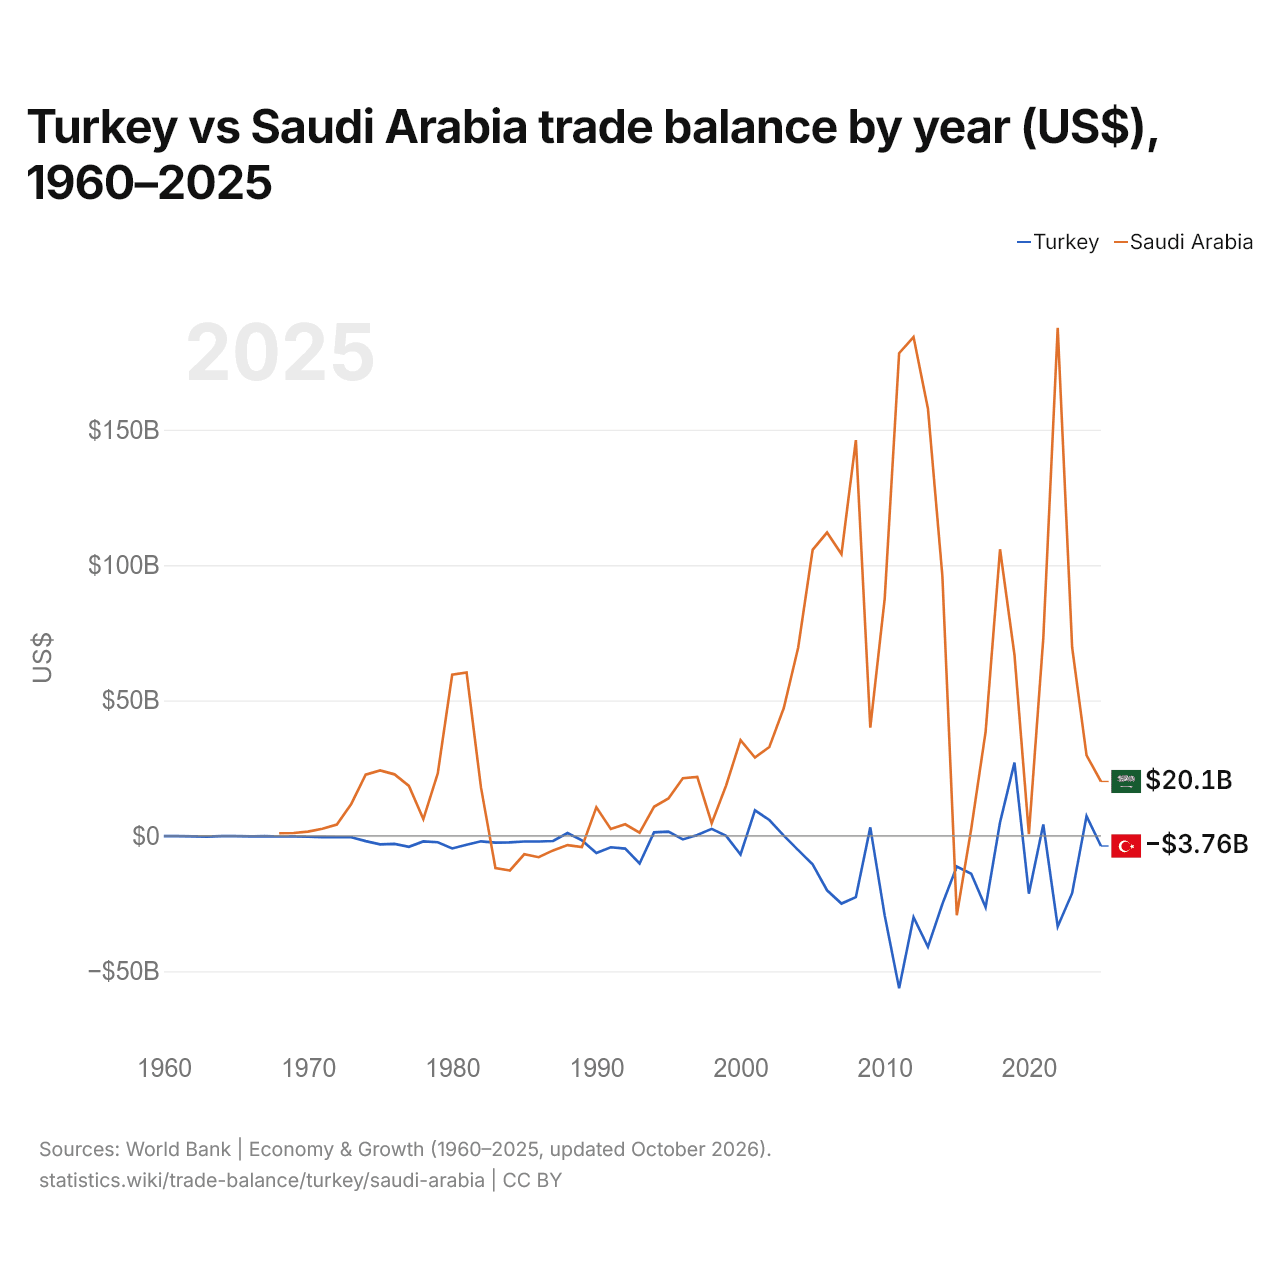
Turquie vs Arabie saoudite : balance commerciale par année ($ US), 1960–2025
| Année | $ US | |
|---|---|---|
 Turquie |
 Arabie saoudite |
|
| 2025 | −3 755 785 561 $ US | 20 067 466 667 $ US |
| 2024 | 7 307 197 101 $ US | 29 736 533 333 $ US |
| 2023 | −21 181 731 331 $ US | 69 635 466 667 $ US |
| 2022 | −33 486 302 440 $ US | 187 668 533 333 $ US |
| 2021 | 4 185 993 617 $ US | 72 986 133 333 $ US |
| 2020 | −21 347 440 639 $ US | 664 000 000 $ US |
| 2019 | 27 009 801 864 $ US | 66 885 333 333 $ US |
| 2018 | 4 971 181 455 $ US | 105 847 466 667 $ US |
| 2017 | −26 405 711 552 $ US | 38 494 666 667 $ US |
| 2016 | −13 983 412 331 $ US | 2 512 533 333 $ US |
| 2015 | −11 366 572 353 $ US | −29 296 800 000 $ US |
| 2014 | −25 180 591 325 $ US | 95 966 400 000 $ US |
| 2013 | −41 005 981 821 $ US | 157 750 133 333 $ US |
| 2012 | −30 066 833 315 $ US | 184 213 333 333 $ US |
| 2011 | −56 314 976 402 $ US | 178 246 400 000 $ US |
| 2010 | −29 450 676 482 $ US | 87 628 266 667 $ US |
| 2009 | 3 116 333 325 $ US | 39 987 200 000 $ US |
| 2008 | −22 630 468 482 $ US | 146 168 800 000 $ US |
| 2007 | −25 026 651 296 $ US | 104 039 226 151 $ US |
| 2006 | −20 116 184 782 $ US | 112 011 748 999 $ US |
| 2005 | −10 528 378 745 $ US | 105 591 257 239 $ US |
| 2004 | −5 268 792 743 $ US | 69 570 133 333 $ US |
| 2003 | 66 756 414 $ US | 47 212 533 333 $ US |
| 2002 | 5 845 228 386 $ US | 32 810 933 333 $ US |
| 2001 | 9 400 731 322 $ US | 28 922 133 333 $ US |
| 2000 | −6 890 257 814 $ US | 35 333 333 333 $ US |
| 1999 | −12 805 916 $ US | 18 576 266 667 $ US |
| 1998 | 2 572 582 501 $ US | 4 662 133 333 $ US |
| 1997 | 308 677 444 $ US | 21 789 586 115 $ US |
| 1996 | −1 330 688 533 $ US | 21 247 797 063 $ US |
| 1995 | 1 537 801 287 $ US | 13 809 612 817 $ US |
| 1994 | 1 278 297 139 $ US | 10 720 160 214 $ US |
| 1993 | −10 228 639 053 $ US | 1 194 926 569 $ US |
| 1992 | −4 698 195 576 $ US | 4 279 305 741 $ US |
| 1991 | −4 219 534 995 $ US | 2 535 380 507 $ US |
| 1990 | −6 346 799 540 $ US | 10 541 522 029 $ US |
| 1989 | −1 690 292 177 $ US | −4 130 040 053 $ US |
| 1988 | 1 000 632 911 $ US | −3 423 497 997 $ US |
| 1987 | −1 897 782 964 $ US | −5 373 831 776 $ US |
| 1986 | −2 110 962 963 $ US | −7 899 000 810 $ US |
| 1985 | −2 087 931 034 $ US | −6 827 443 401 $ US |
| 1984 | −2 437 602 180 $ US | −12 800 510 783 $ US |
| 1983 | −2 524 444 444 $ US | −11 894 066 570 $ US |
| 1982 | −2 029 447 853 $ US | 17 796 370 134 $ US |
| 1981 | −3 322 522 523 $ US | 60 310 278 645 $ US |
| 1980 | −4 656 578 947 $ US | 59 490 035 596 $ US |
| 1979 | −2 387 096 774 $ US | 23 056 756 397 $ US |
| 1978 | −2 070 833 333 $ US | 6 195 798 165 $ US |
| 1977 | −4 044 444 444 $ US | 18 443 064 170 $ US |
| 1976 | −2 987 500 000 $ US | 22 707 932 011 $ US |
| 1975 | −3 135 714 286 $ US | 24 135 407 771 $ US |
| 1974 | −1 964 285 714 $ US | 22 585 633 803 $ US |
| 1973 | −535 714 286 $ US | 11 776 865 468 $ US |
| 1972 | −521 428 571 $ US | 4 185 774 158 $ US |
| 1971 | −473 333 333 $ US | 2 591 362 408 $ US |
| 1970 | −345 454 545 $ US | 1 572 222 222 $ US |
| 1969 | −222 222 222 $ US | 1 042 836 022 $ US |
| 1968 | −244 444 444 $ US | 963 960 711 $ US |
| 1967 | −133 333 333 $ US | - |
| 1966 | −222 222 222 $ US | - |
| 1965 | −100 000 000 $ US | - |
| 1964 | −111 111 111 $ US | - |
| 1963 | −288 888 889 $ US | - |
| 1962 | −211 111 111 $ US | - |
| 1961 | −133 333 333 $ US | - |
| 1960 | −122 222 222 $ US | - |
En 2025, la balance commerciale de la Turquie affichait un déficit de 3,76 milliards de dollars et celle de l'Arabie saoudite un excédent de 20,1 milliards de dollars. En 1968, la balance commerciale de la Turquie affichait un déficit de 244 millions de dollars et celle de l'Arabie saoudite un excédent de 964 millions de dollars.
De 1968 à 2025, la balance commerciale de la Turquie a été excédentaire pendant 13 des 58 années, et celle de l'Arabie saoudite pendant 50. Les balances commerciales de la Turquie et de l'Arabie saoudite ont été déficitaires en même temps pendant 7 de ces années, la dernière fois en 2015.
Turquie vs Arabie saoudite : chiffres de la balance commerciale
|
Turquie
|
Arabie saoudite
|
|
|---|---|---|
| Biens et services, $ US | −3,76 Md $US (2025) | +20,1 Md $US (2025) |
| % du PIB | −0,2 % (2025) | +1,6 % (2025) |
| Années d'excédent depuis 2000 | 8 sur 26 | 25 sur 26 |
| Solde des biens entre les deux, chiffres propres | +394 M $US (2025) | −694 M $US (2025) |
| Premier excédent en biens avec | Irak (+10,4 Md $US, 2025) | Émirats arabes unis (+14,2 Md $US, 2025) |
| Premier déficit en biens avec | Chine (−46,3 Md $US, 2025) | Chine (−61,7 Md $US, 2025) |
Comparer la balance commerciale de 2 pays au choix
Sources :
- Banque mondiale | Économie et croissance (1960–2025, mis à jour en octobre 2026)
- TradeMap (2001–2025, mis à jour en octobre 2026)
Creative Commons Attribution (CC BY) : vous pouvez copier, partager, adapter et réutiliser ce contenu, y compris à des fins commerciales, à condition de citer statistics.wiki et d’indiquer les modifications apportées. Les sources citées ci-dessus peuvent avoir leurs propres conditions de licence.