
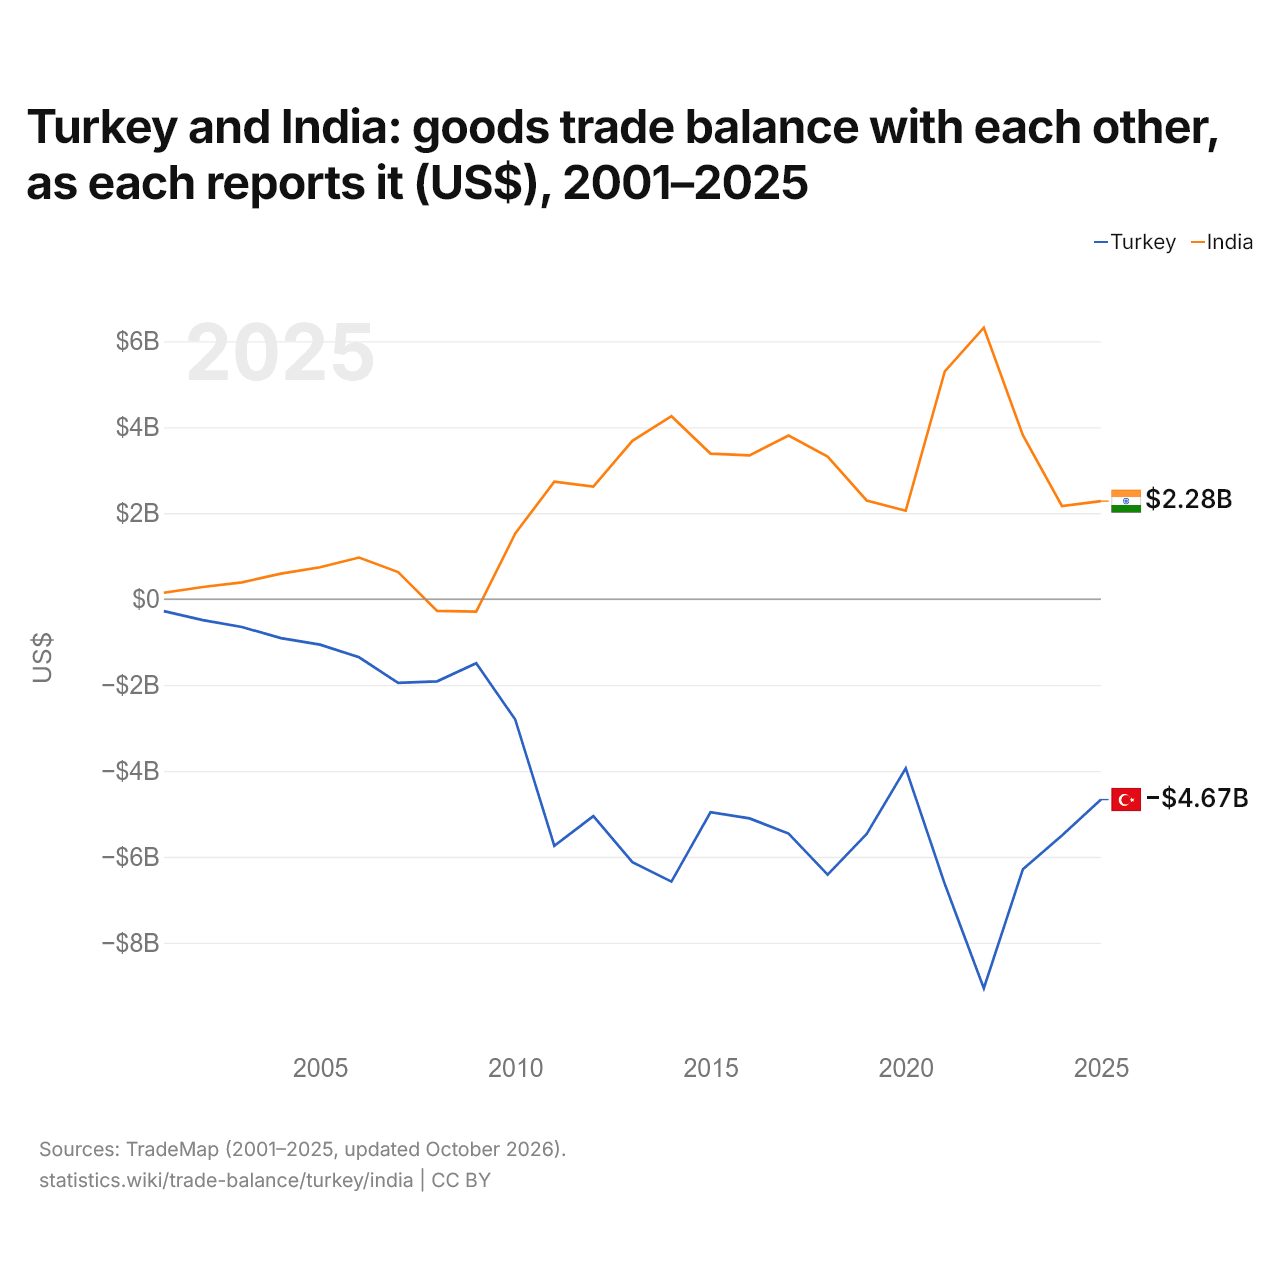
La Turquie et l'Inde : solde de leur commerce de biens bilatéral, selon chacun ($ US), 2001–2025
| Année | $ US | |
|---|---|---|
| Turquie | Inde | |
| 2025 | −4 667 099 000 $ US | 2 279 256 000 $ US |
| 2024 | −5 503 958 000 $ US | 2 165 355 000 $ US |
| 2023 | −6 288 002 000 $ US | 3 811 676 000 $ US |
| 2022 | −9 060 142 000 $ US | 6 315 873 000 $ US |
| 2021 | −6 631 149 000 $ US | 5 298 254 000 $ US |
| 2020 | −3 940 451 000 $ US | 2 056 562 000 $ US |
| 2019 | −5 468 105 000 $ US | 2 293 618 000 $ US |
| 2018 | −6 413 371 000 $ US | 3 316 484 000 $ US |
| 2017 | −5 458 079 000 $ US | 3 806 635 000 $ US |
| 2016 | −5 105 138 000 $ US | 3 343 043 000 $ US |
| 2015 | −4 963 251 000 $ US | 3 385 488 000 $ US |
| 2014 | −6 577 513 000 $ US | 4 255 500 000 $ US |
| 2013 | −6 123 752 000 $ US | 3 683 283 000 $ US |
| 2012 | −5 051 918 000 $ US | 2 619 143 000 $ US |
| 2011 | −5 742 569 000 $ US | 2 731 368 000 $ US |
| 2010 | −2 803 857 000 $ US | 1 526 011 000 $ US |
| 2009 | −1 493 405 000 $ US | −294 623 000 $ US |
| 2008 | −1 915 178 000 $ US | −277 116 000 $ US |
| 2007 | −1 951 503 000 $ US | 626 951 000 $ US |
| 2006 | −1 356 234 000 $ US | 966 679 000 $ US |
| 2005 | −1 060 346 000 $ US | 739 086 000 $ US |
| 2004 | −910 081 000 $ US | 590 839 000 $ US |
| 2003 | −651 473 000 $ US | 387 643 000 $ US |
| 2002 | −491 449 000 $ US | 281 585 000 $ US |
| 2001 | −280 502 000 $ US | 146 776 000 $ US |
En 2025, selon la Turquie, son commerce de biens avec l'Inde affichait un déficit de 4,67 milliards de dollars ; selon l'Inde, son commerce de biens avec la Turquie affichait un excédent de 2,28 milliards de dollars. En 2001, les chiffres étaient un déficit de 281 millions de dollars pour la Turquie et un excédent de 147 millions de dollars pour l'Inde.
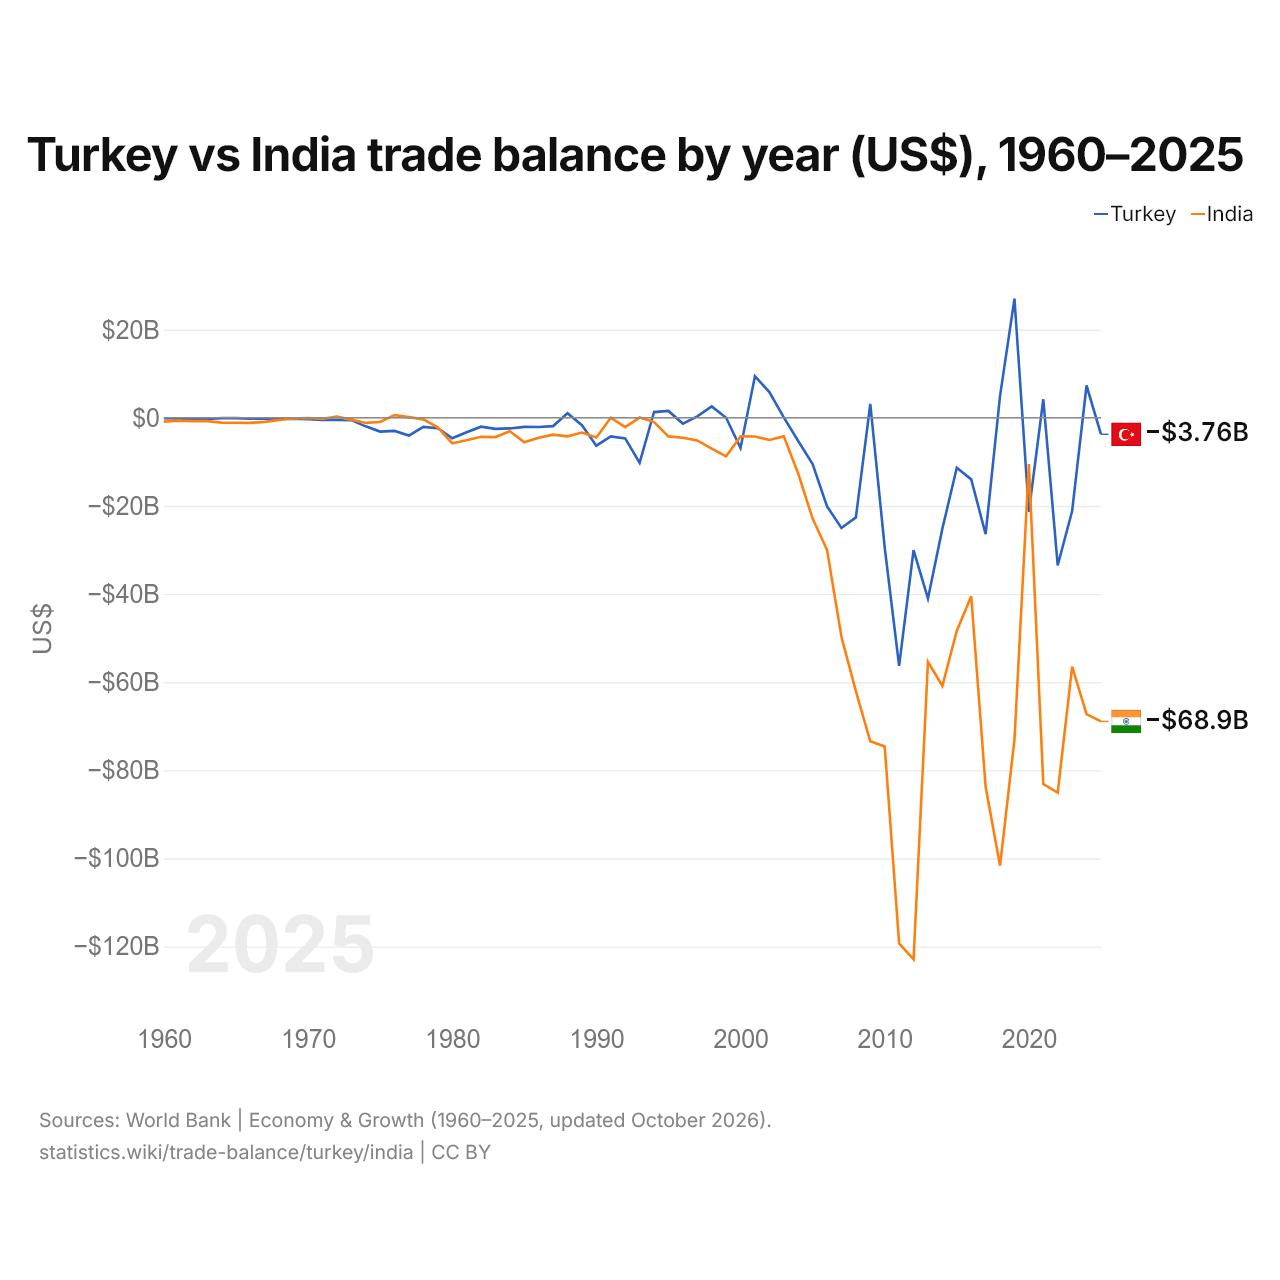
Turquie vs Inde : balance commerciale par année ($ US), 1960–2025
| Année | $ US | |
|---|---|---|
 Turquie |
 Inde |
|
| 2025 | −3 755 785 561 $ US | −68 919 379 155 $ US |
| 2024 | 7 307 197 101 $ US | −67 270 704 658 $ US |
| 2023 | −21 181 731 331 $ US | −56 481 801 795 $ US |
| 2022 | −33 486 302 440 $ US | −85 070 227 555 $ US |
| 2021 | 4 185 993 617 $ US | −83 133 636 377 $ US |
| 2020 | −21 347 440 639 $ US | −10 516 218 300 $ US |
| 2019 | 27 009 801 864 $ US | −73 069 992 885 $ US |
| 2018 | 4 971 181 455 $ US | −101 665 620 603 $ US |
| 2017 | −26 405 711 552 $ US | −83 759 204 290 $ US |
| 2016 | −13 983 412 331 $ US | −40 526 477 692 $ US |
| 2015 | −11 366 572 353 $ US | −48 309 654 578 $ US |
| 2014 | −25 180 591 325 $ US | −60 893 612 908 $ US |
| 2013 | −41 005 981 821 $ US | −55 375 035 766 $ US |
| 2012 | −30 066 833 315 $ US | −122 906 076 681 $ US |
| 2011 | −56 314 976 402 $ US | −119 283 327 195 $ US |
| 2010 | −29 450 676 482 $ US | −74 620 856 173 $ US |
| 2009 | 3 116 333 325 $ US | −73 425 843 079 $ US |
| 2008 | −22 630 468 482 $ US | −62 024 910 978 $ US |
| 2007 | −25 026 651 296 $ US | −49 726 426 539 $ US |
| 2006 | −20 116 184 782 $ US | −29 981 104 764 $ US |
| 2005 | −10 528 378 745 $ US | −22 898 356 563 $ US |
| 2004 | −5 268 792 743 $ US | −12 662 376 777 $ US |
| 2003 | 66 756 414 $ US | −4 233 294 135 $ US |
| 2002 | 5 845 228 386 $ US | −5 045 863 334 $ US |
| 2001 | 9 400 731 322 $ US | −4 254 860 905 $ US |
| 2000 | −6 890 257 814 $ US | −4 245 772 554 $ US |
| 1999 | −12 805 916 $ US | −8 770 221 354 $ US |
| 1998 | 2 572 582 501 $ US | −7 005 099 303 $ US |
| 1997 | 308 677 444 $ US | −5 148 241 779 $ US |
| 1996 | −1 330 688 533 $ US | −4 554 261 385 $ US |
| 1995 | 1 537 801 287 $ US | −4 249 570 650 $ US |
| 1994 | 1 278 297 139 $ US | −988 286 716 $ US |
| 1993 | −10 228 639 053 $ US | 47 187 344 $ US |
| 1992 | −4 698 195 576 $ US | −2 153 620 947 $ US |
| 1991 | −4 219 534 995 $ US | 2 039 268 $ US |
| 1990 | −6 346 799 540 $ US | −4 492 297 406 $ US |
| 1989 | −1 690 292 177 $ US | −3 362 657 410 $ US |
| 1988 | 1 000 632 911 $ US | −4 211 604 784 $ US |
| 1987 | −1 897 782 964 $ US | −3 838 531 827 $ US |
| 1986 | −2 110 962 963 $ US | −4 548 547 296 $ US |
| 1985 | −2 087 931 034 $ US | −5 559 179 686 $ US |
| 1984 | −2 437 602 180 $ US | −3 060 529 243 $ US |
| 1983 | −2 524 444 444 $ US | −4 398 713 512 $ US |
| 1982 | −2 029 447 853 $ US | −4 334 108 792 $ US |
| 1981 | −3 322 522 523 $ US | −5 098 906 809 $ US |
| 1980 | −4 656 578 947 $ US | −5 786 386 673 $ US |
| 1979 | −2 387 096 774 $ US | −2 171 813 477 $ US |
| 1978 | −2 070 833 333 $ US | −375 331 507 $ US |
| 1977 | −4 044 444 444 $ US | 143 648 830 $ US |
| 1976 | −2 987 500 000 $ US | 587 355 938 $ US |
| 1975 | −3 135 714 286 $ US | −984 594 448 $ US |
| 1974 | −1 964 285 714 $ US | −1 183 618 321 $ US |
| 1973 | −535 714 286 $ US | −440 047 978 $ US |
| 1972 | −521 428 571 $ US | 227 671 476 $ US |
| 1971 | −473 333 333 $ US | −225 759 297 $ US |
| 1970 | −345 454 545 $ US | −60 000 000 $ US |
| 1969 | −222 222 222 $ US | −185 333 333 $ US |
| 1968 | −244 444 444 $ US | −480 000 000 $ US |
| 1967 | −133 333 333 $ US | −958 666 667 $ US |
| 1966 | −222 222 222 $ US | −1 152 811 397 $ US |
| 1965 | −100 000 000 $ US | −1 134 001 134 $ US |
| 1964 | −111 111 111 $ US | −1 106 701 107 $ US |
| 1963 | −288 888 889 $ US | −787 500 788 $ US |
| 1962 | −211 111 111 $ US | −785 400 785 $ US |
| 1961 | −133 333 333 $ US | −648 900 649 $ US |
| 1960 | −122 222 222 $ US | −877 800 878 $ US |
En 2025, la balance commerciale de la Turquie affichait un déficit de 3,76 milliards de dollars et celle de l'Inde un déficit de 68,9 milliards de dollars ; le déficit de l'Inde était 18 fois plus grand. En 1960, la balance commerciale de la Turquie affichait un déficit de 122 millions de dollars et celle de l'Inde un déficit de 878 millions de dollars.
De 1960 à 2025, la balance commerciale de la Turquie a été excédentaire pendant 13 des 66 années, et celle de l'Inde pendant 5. Les balances commerciales de la Turquie et de l'Inde ont été déficitaires en même temps pendant 48 de ces années, la dernière fois en 2025.
Turquie vs Inde : chiffres de la balance commerciale
|
Turquie
|
Inde
|
|
|---|---|---|
| Biens et services, $ US | −3,76 Md $US (2025) | −68,9 Md $US (2025) |
| % du PIB | −0,2 % (2025) | −1,7 % (2025) |
| Années d'excédent depuis 2000 | 8 sur 26 | 0 sur 26 |
| Solde des biens entre les deux, chiffres propres | −4,67 Md $US (2025) | +2,28 Md $US (2025) |
| Premier excédent en biens avec | Irak (+10,4 Md $US, 2025) | États-Unis (+42,9 Md $US, 2025) |
| Premier déficit en biens avec | Chine (−46,3 Md $US, 2025) | Chine (−107 Md $US, 2025) |
Comparer la balance commerciale de 2 pays au choix
Sources :
- Banque mondiale | Économie et croissance (1960–2025, mis à jour en octobre 2026)
- TradeMap (2001–2025, mis à jour en octobre 2026)
Creative Commons Attribution (CC BY) : vous pouvez copier, partager, adapter et réutiliser ce contenu, y compris à des fins commerciales, à condition de citer statistics.wiki et d’indiquer les modifications apportées. Les sources citées ci-dessus peuvent avoir leurs propres conditions de licence.