
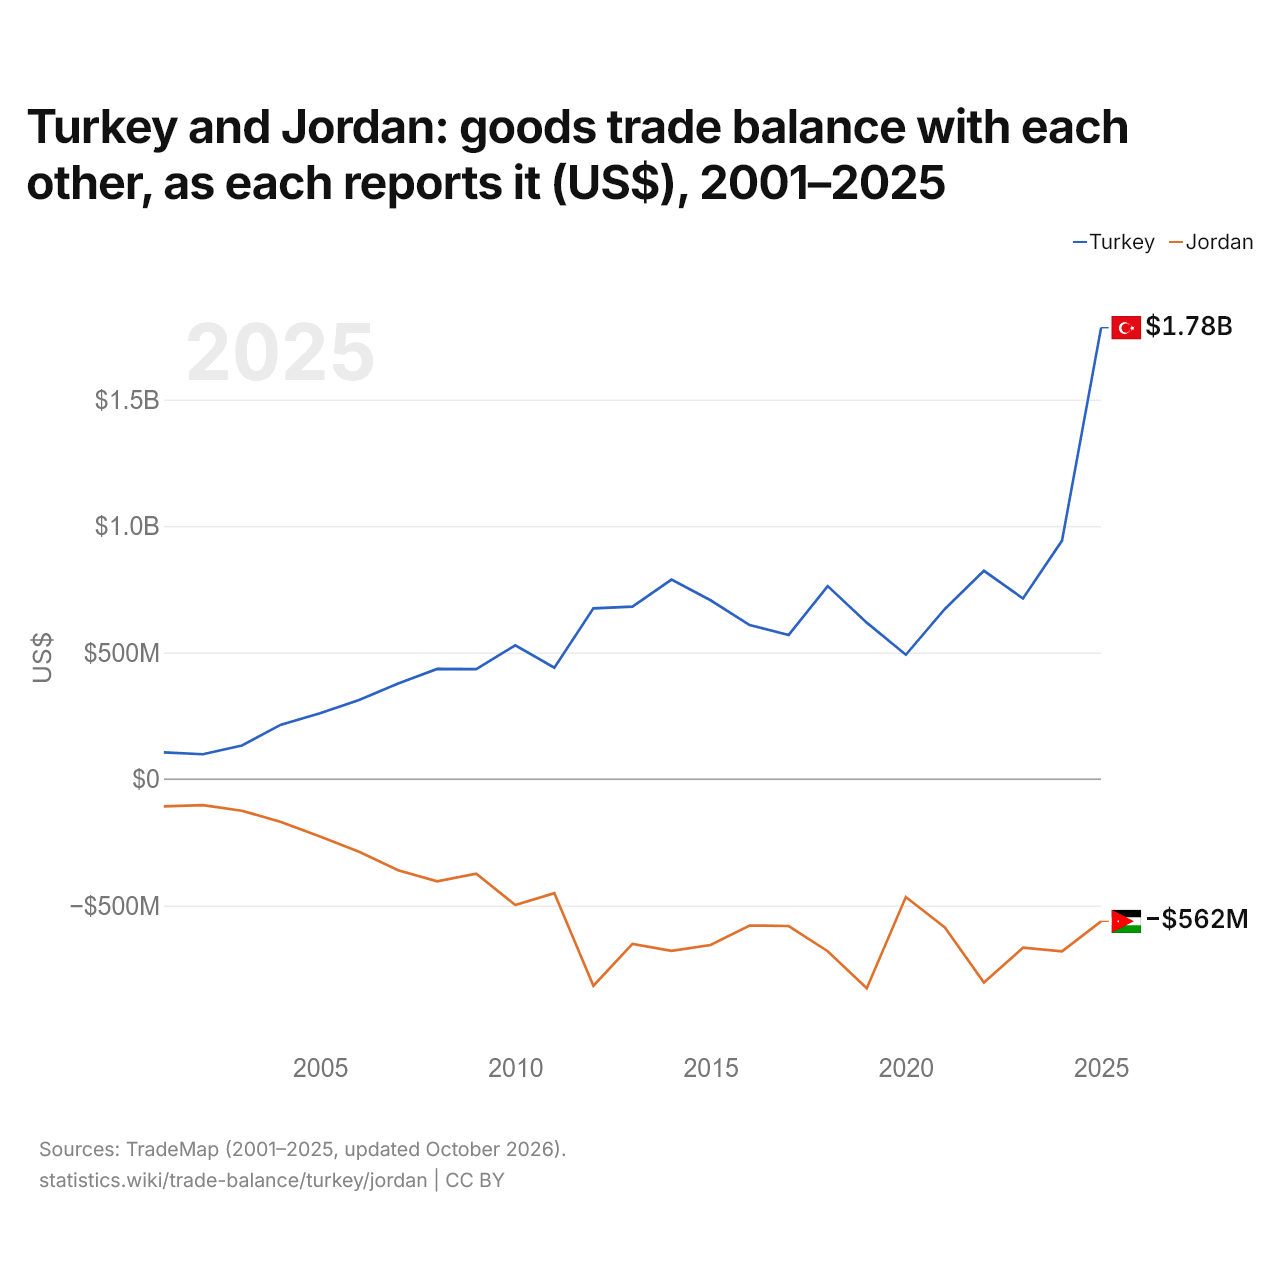
La Turquie et la Jordanie : solde de leur commerce de biens bilatéral, selon chacun ($ US), 2001–2025
| Année | $ US | |
|---|---|---|
| Turquie | Jordanie | |
| 2025 | 1 784 178 000 $ US | −562 133 000 $ US |
| 2024 | 942 629 000 $ US | −680 743 000 $ US |
| 2023 | 713 869 000 $ US | −666 577 000 $ US |
| 2022 | 823 218 000 $ US | −804 356 000 $ US |
| 2021 | 672 504 000 $ US | −586 237 000 $ US |
| 2020 | 491 320 000 $ US | −466 126 000 $ US |
| 2019 | 618 371 000 $ US | −826 877 000 $ US |
| 2018 | 763 022 000 $ US | −680 237 000 $ US |
| 2017 | 569 833 000 $ US | −580 656 000 $ US |
| 2016 | 608 778 000 $ US | −578 611 000 $ US |
| 2015 | 706 841 000 $ US | −656 023 000 $ US |
| 2014 | 788 350 000 $ US | −678 694 000 $ US |
| 2013 | 681 484 000 $ US | −651 401 000 $ US |
| 2012 | 674 986 000 $ US | −816 917 000 $ US |
| 2011 | 440 359 000 $ US | −450 787 000 $ US |
| 2010 | 528 884 000 $ US | −497 602 000 $ US |
| 2009 | 434 998 000 $ US | −373 713 000 $ US |
| 2008 | 435 449 000 $ US | −404 328 000 $ US |
| 2007 | 377 708 000 $ US | −360 234 000 $ US |
| 2006 | 312 342 000 $ US | −286 881 000 $ US |
| 2005 | 260 327 000 $ US | −227 094 000 $ US |
| 2004 | 215 308 000 $ US | −169 169 000 $ US |
| 2003 | 132 767 000 $ US | −124 975 000 $ US |
| 2002 | 98 268 000 $ US | −103 187 000 $ US |
| 2001 | 105 376 000 $ US | −107 994 000 $ US |
En 2025, selon la Turquie, son commerce de biens avec la Jordanie affichait un excédent de 1,78 milliard de dollars ; selon la Jordanie, son commerce de biens avec la Turquie affichait un déficit de 562 millions de dollars. En 2001, les chiffres étaient un excédent de 105 millions de dollars pour la Turquie et un déficit de 108 millions de dollars pour la Jordanie.
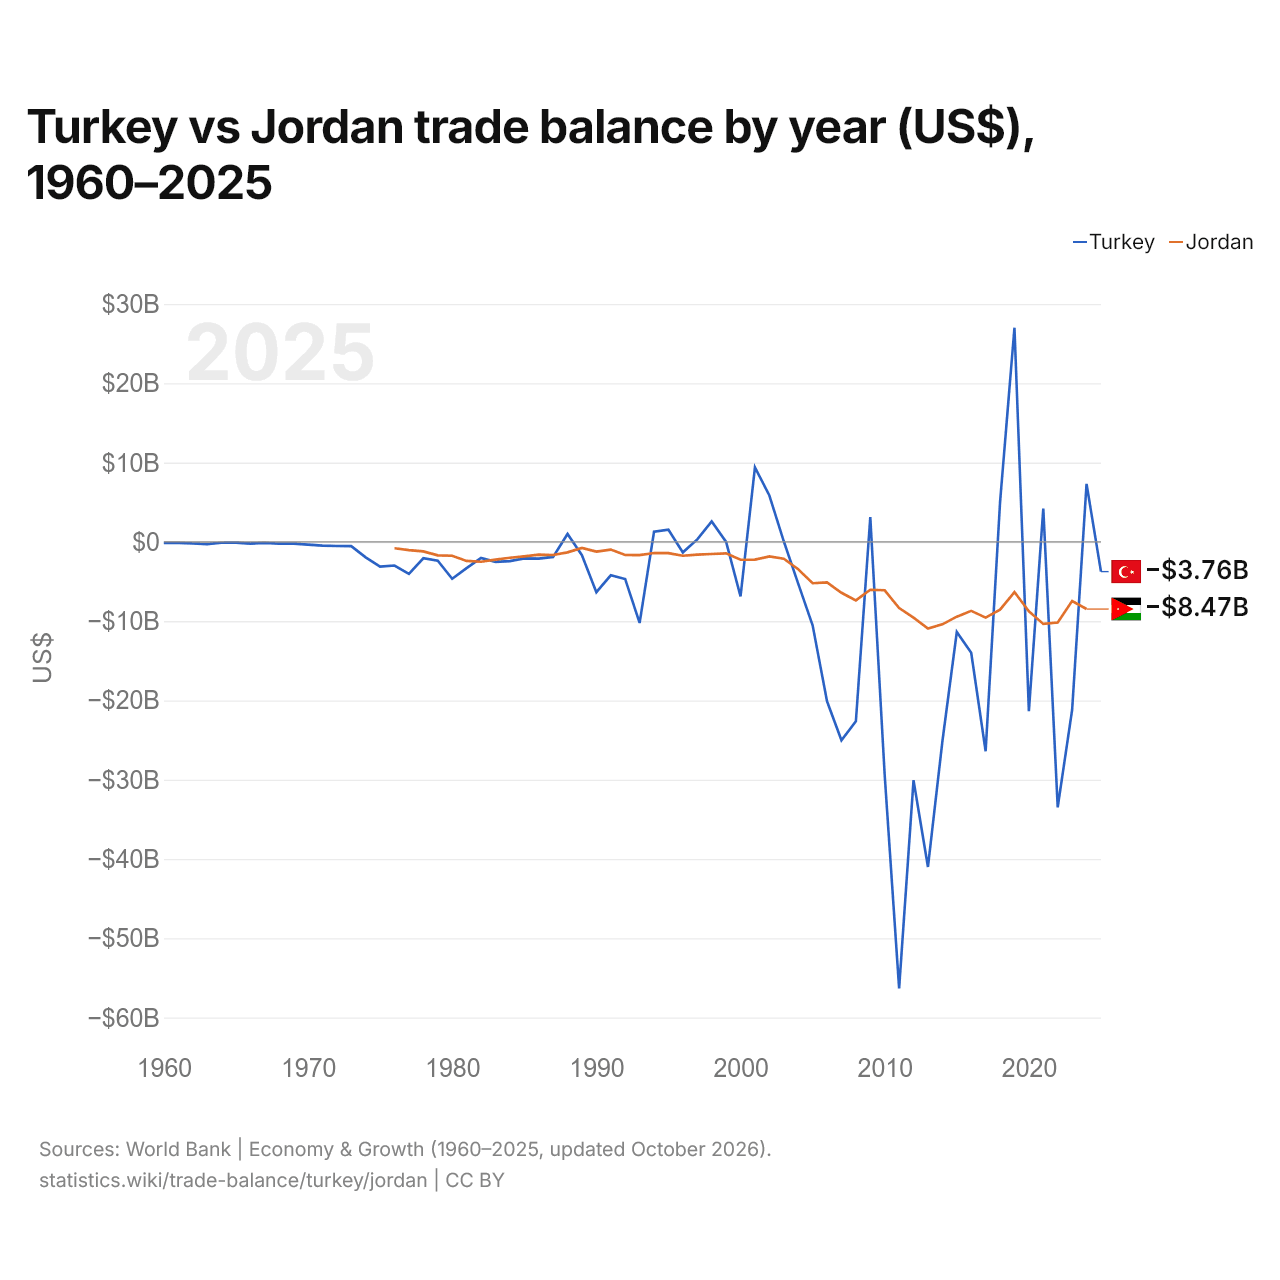
Turquie vs Jordanie : balance commerciale par année ($ US), 1960–2025
| Année | $ US | |
|---|---|---|
 Turquie |
 Jordanie |
|
| 2025 | −3 755 785 561 $ US | - |
| 2024 | 7 307 197 101 $ US | −8 473 484 746 $ US |
| 2023 | −21 181 731 331 $ US | −7 472 336 302 $ US |
| 2022 | −33 486 302 440 $ US | −10 179 201 144 $ US |
| 2021 | 4 185 993 617 $ US | −10 351 533 439 $ US |
| 2020 | −21 347 440 639 $ US | −8 752 372 484 $ US |
| 2019 | 27 009 801 864 $ US | −6 331 967 800 $ US |
| 2018 | 4 971 181 455 $ US | −8 556 328 572 $ US |
| 2017 | −26 405 711 552 $ US | −9 560 139 509 $ US |
| 2016 | −13 983 412 331 $ US | −8 707 247 886 $ US |
| 2015 | −11 366 572 353 $ US | −9 440 747 024 $ US |
| 2014 | −25 180 591 325 $ US | −10 405 761 157 $ US |
| 2013 | −41 005 981 821 $ US | −10 930 374 066 $ US |
| 2012 | −30 066 833 315 $ US | −9 551 261 526 $ US |
| 2011 | −56 314 976 402 $ US | −8 355 432 945 $ US |
| 2010 | −29 450 676 482 $ US | −6 109 535 546 $ US |
| 2009 | 3 116 333 325 $ US | −6 042 038 828 $ US |
| 2008 | −22 630 468 482 $ US | −7 390 727 763 $ US |
| 2007 | −25 026 651 296 $ US | −6 420 592 384 $ US |
| 2006 | −20 116 184 782 $ US | −5 119 181 946 $ US |
| 2005 | −10 528 378 745 $ US | −5 224 400 564 $ US |
| 2004 | −5 268 792 743 $ US | −3 451 198 872 $ US |
| 2003 | 66 756 414 $ US | −2 137 235 543 $ US |
| 2002 | 5 845 228 386 $ US | −1 839 492 243 $ US |
| 2001 | 9 400 731 322 $ US | −2 245 469 920 $ US |
| 2000 | −6 890 257 814 $ US | −2 256 840 621 $ US |
| 1999 | −12 805 916 $ US | −1 454 664 880 $ US |
| 1998 | 2 572 582 501 $ US | −1 539 901 410 $ US |
| 1997 | 308 677 444 $ US | −1 611 613 399 $ US |
| 1996 | −1 330 688 533 $ US | −1 752 750 212 $ US |
| 1995 | 1 537 801 287 $ US | −1 422 231 735 $ US |
| 1994 | 1 278 297 139 $ US | −1 410 131 673 $ US |
| 1993 | −10 228 639 053 $ US | −1 671 546 985 $ US |
| 1992 | −4 698 195 576 $ US | −1 655 884 369 $ US |
| 1991 | −4 219 534 995 $ US | −976 697 324 $ US |
| 1990 | −6 346 799 540 $ US | −1 238 790 319 $ US |
| 1989 | −1 690 292 177 $ US | −774 484 141 $ US |
| 1988 | 1 000 632 911 $ US | −1 332 916 546 $ US |
| 1987 | −1 897 782 964 $ US | −1 664 898 850 $ US |
| 1986 | −2 110 962 963 $ US | −1 615 585 514 $ US |
| 1985 | −2 087 931 034 $ US | −1 827 557 808 $ US |
| 1984 | −2 437 602 180 $ US | −2 010 065 936 $ US |
| 1983 | −2 524 444 444 $ US | −2 240 834 639 $ US |
| 1982 | −2 029 447 853 $ US | −2 512 113 750 $ US |
| 1981 | −3 322 522 523 $ US | −2 406 841 932 $ US |
| 1980 | −4 656 578 947 $ US | −1 756 146 681 $ US |
| 1979 | −2 387 096 774 $ US | −1 701 444 730 $ US |
| 1978 | −2 070 833 333 $ US | −1 206 707 566 $ US |
| 1977 | −4 044 444 444 $ US | −1 043 833 728 $ US |
| 1976 | −2 987 500 000 $ US | −809 680 014 $ US |
| 1975 | −3 135 714 286 $ US | - |
| 1974 | −1 964 285 714 $ US | - |
| 1973 | −535 714 286 $ US | - |
| 1972 | −521 428 571 $ US | - |
| 1971 | −473 333 333 $ US | - |
| 1970 | −345 454 545 $ US | - |
| 1969 | −222 222 222 $ US | - |
| 1968 | −244 444 444 $ US | - |
| 1967 | −133 333 333 $ US | - |
| 1966 | −222 222 222 $ US | - |
| 1965 | −100 000 000 $ US | - |
| 1964 | −111 111 111 $ US | - |
| 1963 | −288 888 889 $ US | - |
| 1962 | −211 111 111 $ US | - |
| 1961 | −133 333 333 $ US | - |
| 1960 | −122 222 222 $ US | - |
La balance commerciale de la Turquie affichait un excédent de 7,31 milliards de dollars (2024) et celle de la Jordanie un déficit de 8,47 milliards de dollars (2024). En 1976, la balance commerciale de la Turquie affichait un déficit de 2,99 milliards de dollars et celle de la Jordanie un déficit de 810 millions de dollars.
Depuis 1976, la balance commerciale de la Turquie a été excédentaire pendant 13 des 49 années, et celle de la Jordanie pendant aucune. Les balances commerciales de la Turquie et de la Jordanie ont été déficitaires en même temps pendant 36 de ces années, la dernière fois en 2023.
Turquie vs Jordanie : chiffres de la balance commerciale
|
Turquie
|
Jordanie
|
|
|---|---|---|
| Biens et services, $ US | −3,76 Md $US (2025) | −8,47 Md $US (2024) |
| % du PIB | −0,2 % (2025) | −14,5 % (2024) |
| Années d'excédent depuis 2000 | 8 sur 26 | 0 sur 25 |
| Solde des biens entre les deux, chiffres propres | +1,78 Md $US (2025) | −562 M $US (2025) |
| Premier excédent en biens avec | Irak (+10,4 Md $US, 2025) | Irak (+2,42 Md $US, 2025) |
| Premier déficit en biens avec | Chine (−46,3 Md $US, 2025) | Chine (−5,50 Md $US, 2025) |
Comparer la balance commerciale de 2 pays au choix
Sources :
- Banque mondiale | Économie et croissance (1960–2025, mis à jour en octobre 2026)
- TradeMap (2001–2025, mis à jour en octobre 2026)
Creative Commons Attribution (CC BY) : vous pouvez copier, partager, adapter et réutiliser ce contenu, y compris à des fins commerciales, à condition de citer statistics.wiki et d’indiquer les modifications apportées. Les sources citées ci-dessus peuvent avoir leurs propres conditions de licence.