
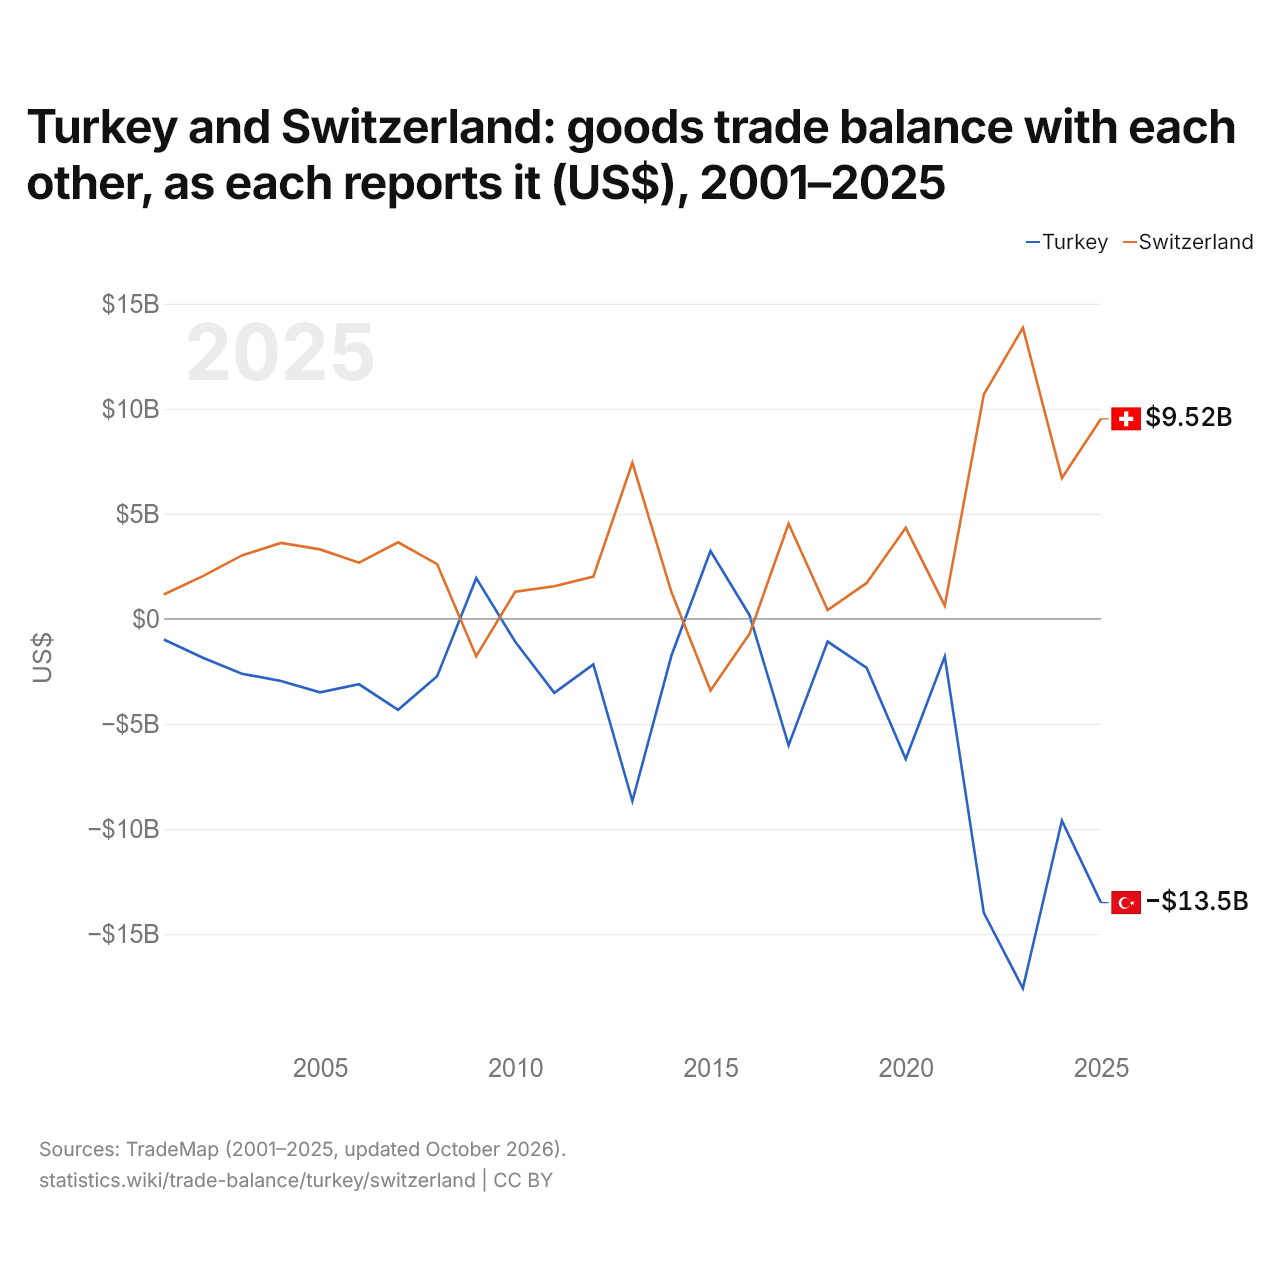
La Turquie et la Suisse : solde de leur commerce de biens bilatéral, selon chacun ($ US), 2001–2025
| Année | $ US | |
|---|---|---|
| Turquie | Suisse | |
| 2025 | −13 509 880 000 $ US | 9 521 198 000 $ US |
| 2024 | −9 603 266 000 $ US | 6 699 410 000 $ US |
| 2023 | −17 589 499 000 $ US | 13 861 117 000 $ US |
| 2022 | −14 001 254 000 $ US | 10 680 212 000 $ US |
| 2021 | −1 798 335 000 $ US | 628 326 000 $ US |
| 2020 | −6 676 247 000 $ US | 4 334 834 000 $ US |
| 2019 | −2 334 707 000 $ US | 1 708 092 000 $ US |
| 2018 | −1 080 152 000 $ US | 414 030 000 $ US |
| 2017 | −6 011 787 000 $ US | 4 528 220 000 $ US |
| 2016 | 174 694 000 $ US | −714 156 000 $ US |
| 2015 | 3 231 203 000 $ US | −3 414 226 000 $ US |
| 2014 | −1 747 252 000 $ US | 1 273 566 000 $ US |
| 2013 | −8 675 515 000 $ US | 7 429 682 000 $ US |
| 2012 | −2 172 827 000 $ US | 2 011 811 000 $ US |
| 2011 | −3 527 504 000 $ US | 1 548 798 000 $ US |
| 2010 | −1 090 711 000 $ US | 1 294 103 000 $ US |
| 2009 | 1 938 477 000 $ US | −1 781 996 000 $ US |
| 2008 | −2 732 349 000 $ US | 2 605 487 000 $ US |
| 2007 | −4 330 625 000 $ US | 3 644 844 000 $ US |
| 2006 | −3 114 033 000 $ US | 2 674 832 000 $ US |
| 2005 | −3 499 494 000 $ US | 3 307 354 000 $ US |
| 2004 | −2 956 449 000 $ US | 3 617 258 000 $ US |
| 2003 | −2 613 252 000 $ US | 3 019 524 000 $ US |
| 2002 | −1 851 633 000 $ US | 2 032 953 000 $ US |
| 2001 | −984 814 000 $ US | 1 161 637 000 $ US |
En 2025, selon la Turquie, son commerce de biens avec la Suisse affichait un déficit de 13,5 milliards de dollars ; selon la Suisse, son commerce de biens avec la Turquie affichait un excédent de 9,52 milliards de dollars. En 2001, les chiffres étaient un déficit de 985 millions de dollars pour la Turquie et un excédent de 1,16 milliard de dollars pour la Suisse.
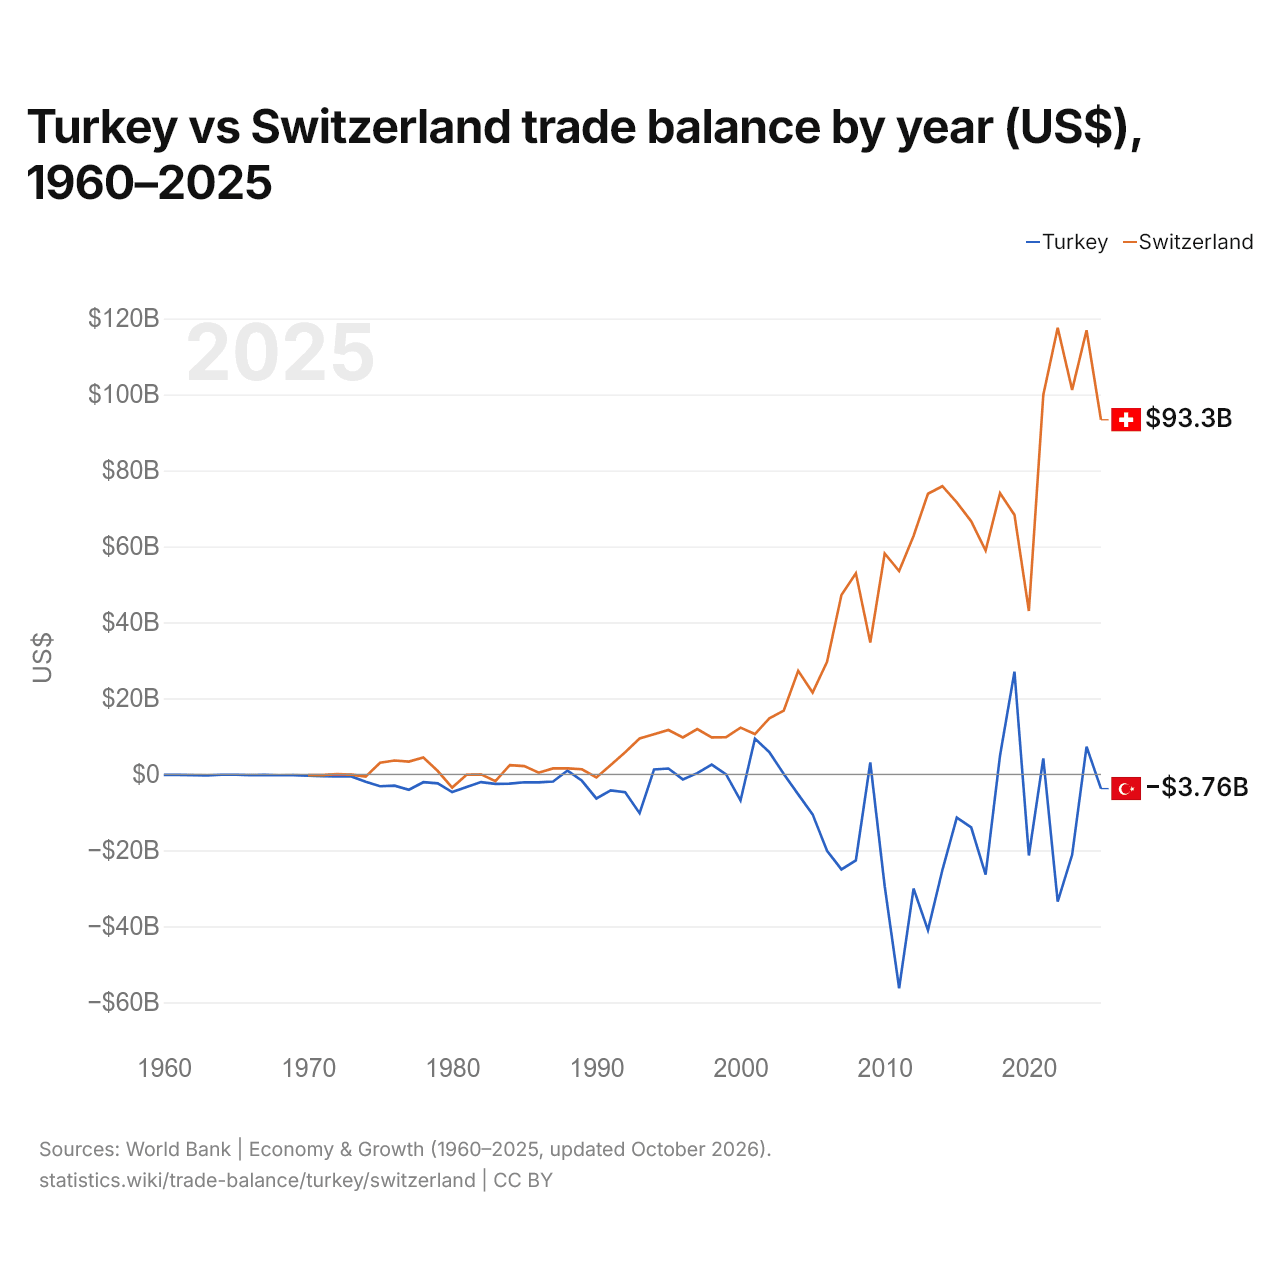
Turquie vs Suisse : balance commerciale par année ($ US), 1960–2025
| Année | $ US | |
|---|---|---|
 Turquie |
 Suisse |
|
| 2025 | −3 755 785 561 $ US | 93 327 424 779 $ US |
| 2024 | 7 307 197 101 $ US | 116 875 945 667 $ US |
| 2023 | −21 181 731 331 $ US | 101 202 061 236 $ US |
| 2022 | −33 486 302 440 $ US | 117 559 414 871 $ US |
| 2021 | 4 185 993 617 $ US | 99 877 578 549 $ US |
| 2020 | −21 347 440 639 $ US | 42 986 735 072 $ US |
| 2019 | 27 009 801 864 $ US | 68 295 204 649 $ US |
| 2018 | 4 971 181 455 $ US | 73 995 137 798 $ US |
| 2017 | −26 405 711 552 $ US | 58 909 490 111 $ US |
| 2016 | −13 983 412 331 $ US | 66 597 209 588 $ US |
| 2015 | −11 366 572 353 $ US | 71 602 620 494 $ US |
| 2014 | −25 180 591 325 $ US | 75 842 856 051 $ US |
| 2013 | −41 005 981 821 $ US | 73 866 194 779 $ US |
| 2012 | −30 066 833 315 $ US | 62 754 994 042 $ US |
| 2011 | −56 314 976 402 $ US | 53 497 314 868 $ US |
| 2010 | −29 450 676 482 $ US | 58 133 791 152 $ US |
| 2009 | 3 116 333 325 $ US | 34 705 789 909 $ US |
| 2008 | −22 630 468 482 $ US | 52 921 058 074 $ US |
| 2007 | −25 026 651 296 $ US | 47 201 037 154 $ US |
| 2006 | −20 116 184 782 $ US | 29 597 737 279 $ US |
| 2005 | −10 528 378 745 $ US | 21 536 056 858 $ US |
| 2004 | −5 268 792 743 $ US | 27 242 195 416 $ US |
| 2003 | 66 756 414 $ US | 16 783 998 663 $ US |
| 2002 | 5 845 228 386 $ US | 14 761 475 683 $ US |
| 2001 | 9 400 731 322 $ US | 10 603 772 813 $ US |
| 2000 | −6 890 257 814 $ US | 12 292 429 536 $ US |
| 1999 | −12 805 916 $ US | 9 788 555 452 $ US |
| 1998 | 2 572 582 501 $ US | 9 746 614 016 $ US |
| 1997 | 308 677 444 $ US | 11 941 174 120 $ US |
| 1996 | −1 330 688 533 $ US | 9 727 214 401 $ US |
| 1995 | 1 537 801 287 $ US | 11 678 361 945 $ US |
| 1994 | 1 278 297 139 $ US | 10 539 556 189 $ US |
| 1993 | −10 228 639 053 $ US | 9 449 052 518 $ US |
| 1992 | −4 698 195 576 $ US | 5 842 552 269 $ US |
| 1991 | −4 219 534 995 $ US | 2 469 264 296 $ US |
| 1990 | −6 346 799 540 $ US | −826 786 640 $ US |
| 1989 | −1 690 292 177 $ US | 1 347 452 778 $ US |
| 1988 | 1 000 632 911 $ US | 1 585 879 861 $ US |
| 1987 | −1 897 782 964 $ US | 1 565 024 812 $ US |
| 1986 | −2 110 962 963 $ US | 434 064 150 $ US |
| 1985 | −2 087 931 034 $ US | 2 176 477 962 $ US |
| 1984 | −2 437 602 180 $ US | 2 438 939 013 $ US |
| 1983 | −2 524 444 444 $ US | −1 788 923 824 $ US |
| 1982 | −2 029 447 853 $ US | 4 030 439 $ US |
| 1981 | −3 322 522 523 $ US | −99 430 302 $ US |
| 1980 | −4 656 578 947 $ US | −3 479 950 468 $ US |
| 1979 | −2 387 096 774 $ US | 879 793 108 $ US |
| 1978 | −2 070 833 333 $ US | 4 440 991 611 $ US |
| 1977 | −4 044 444 444 $ US | 3 344 607 447 $ US |
| 1976 | −2 987 500 000 $ US | 3 651 735 878 $ US |
| 1975 | −3 135 714 286 $ US | 3 077 404 796 $ US |
| 1974 | −1 964 285 714 $ US | −618 285 168 $ US |
| 1973 | −535 714 286 $ US | −63 467 202 $ US |
| 1972 | −521 428 571 $ US | 43 511 115 $ US |
| 1971 | −473 333 333 $ US | −193 591 766 $ US |
| 1970 | −345 454 545 $ US | −193 422 365 $ US |
| 1969 | −222 222 222 $ US | - |
| 1968 | −244 444 444 $ US | - |
| 1967 | −133 333 333 $ US | - |
| 1966 | −222 222 222 $ US | - |
| 1965 | −100 000 000 $ US | - |
| 1964 | −111 111 111 $ US | - |
| 1963 | −288 888 889 $ US | - |
| 1962 | −211 111 111 $ US | - |
| 1961 | −133 333 333 $ US | - |
| 1960 | −122 222 222 $ US | - |
En 2025, la balance commerciale de la Turquie affichait un déficit de 3,76 milliards de dollars et celle de la Suisse un excédent de 93,3 milliards de dollars. En 1970, la balance commerciale de la Turquie affichait un déficit de 345 millions de dollars et celle de la Suisse un déficit de 193 millions de dollars.
De 1970 à 2025, la balance commerciale de la Turquie a été excédentaire pendant 13 des 56 années, et celle de la Suisse pendant 48. Les balances commerciales de la Turquie et de la Suisse ont été déficitaires en même temps pendant 8 de ces années, la dernière fois en 1990.
Turquie vs Suisse : chiffres de la balance commerciale
|
Turquie
|
Suisse
|
|
|---|---|---|
| Biens et services, $ US | −3,76 Md $US (2025) | +93,3 Md $US (2025) |
| % du PIB | −0,2 % (2025) | +8,9 % (2025) |
| Années d'excédent depuis 2000 | 8 sur 26 | 26 sur 26 |
| Solde des biens entre les deux, chiffres propres | −13,5 Md $US (2025) | +9,52 Md $US (2025) |
| Premier excédent en biens avec | Irak (+10,4 Md $US, 2025) | États-Unis (+57,0 Md $US, 2025) |
| Premier déficit en biens avec | Chine (−46,3 Md $US, 2025) | Émirats arabes unis (−35,9 Md $US, 2025) |
Comparer la balance commerciale de 2 pays au choix
Sources :
- Banque mondiale | Économie et croissance (1960–2025, mis à jour en octobre 2026)
- TradeMap (2001–2025, mis à jour en octobre 2026)
Creative Commons Attribution (CC BY) : vous pouvez copier, partager, adapter et réutiliser ce contenu, y compris à des fins commerciales, à condition de citer statistics.wiki et d’indiquer les modifications apportées. Les sources citées ci-dessus peuvent avoir leurs propres conditions de licence.