
La Suisse et le Koweït : solde de leur commerce de biens bilatéral, selon chacun ($ US), 2001–2025
| Année | $ US | |
|---|---|---|
| Suisse | Koweït | |
| 2025 | 766 986 000 $ US | −1 222 445 000 $ US |
| 2024 | 695 865 000 $ US | −1 046 033 000 $ US |
| 2023 | 693 371 000 $ US | −1 042 600 000 $ US |
| 2022 | 536 738 000 $ US | −774 449 000 $ US |
| 2021 | 509 657 000 $ US | −701 015 000 $ US |
| 2020 | 420 893 000 $ US | −638 947 000 $ US |
| 2019 | 447 124 000 $ US | −491 142 000 $ US |
| 2018 | 419 751 000 $ US | −565 056 000 $ US |
| 2017 | 397 869 000 $ US | −591 599 000 $ US |
| 2016 | 392 340 000 $ US | −520 562 000 $ US |
| 2015 | 408 658 000 $ US | −551 689 000 $ US |
| 2014 | 409 572 000 $ US | −581 860 000 $ US |
| 2013 | 407 643 000 $ US | −560 631 000 $ US |
| 2012 | 375 971 000 $ US | −451 610 000 $ US |
| 2011 | 329 986 000 $ US | −391 380 000 $ US |
| 2010 | 364 486 000 $ US | −490 154 000 $ US |
| 2009 | 268 419 000 $ US | −306 416 000 $ US |
| 2008 | 333 236 000 $ US | −378 728 000 $ US |
| 2007 | 285 532 000 $ US | −288 843 000 $ US |
| 2006 | 217 890 000 $ US | −202 343 000 $ US |
| 2005 | 178 930 000 $ US | −163 545 000 $ US |
| 2004 | 151 909 000 $ US | −163 545 000 $ US |
| 2003 | 139 559 000 $ US | −133 098 000 $ US |
| 2002 | 109 914 000 $ US | −129 104 000 $ US |
| 2001 | 91 220 000 $ US | −121 398 000 $ US |
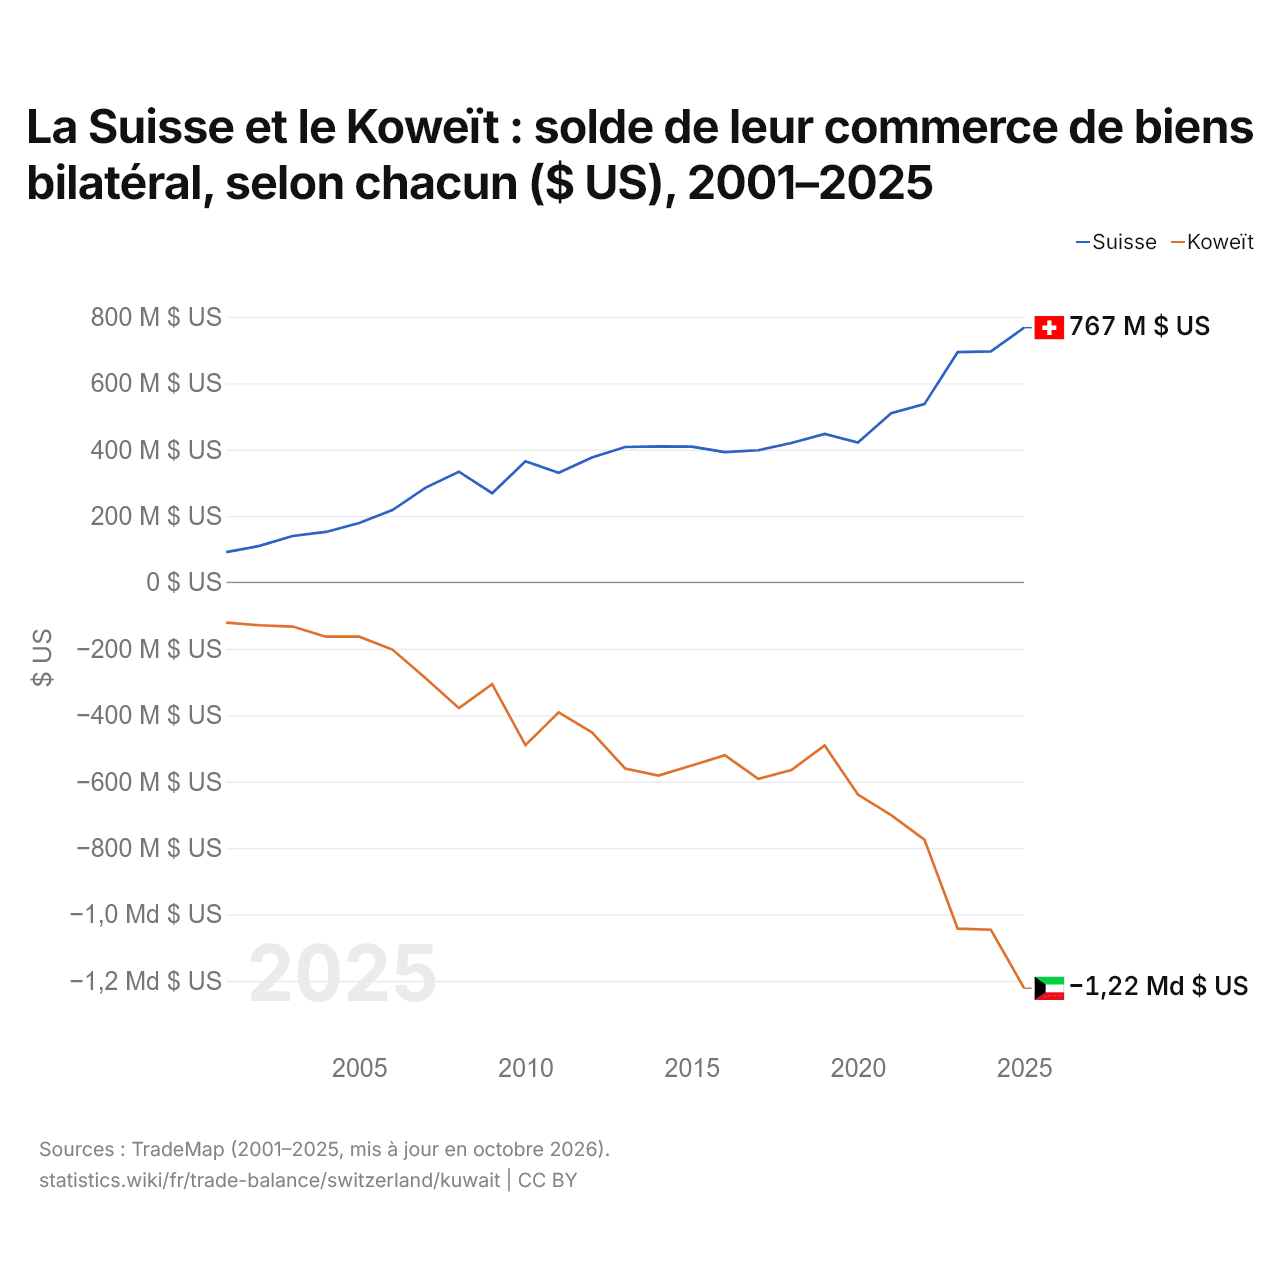
En 2025, selon la Suisse, son commerce de biens avec le Koweït affichait un excédent de 767 millions de dollars ; selon le Koweït, son commerce de biens avec la Suisse affichait un déficit de 1,22 milliard de dollars. En 2001, les chiffres étaient un excédent de 91,2 millions de dollars pour la Suisse et un déficit de 121 millions de dollars pour le Koweït.
Suisse vs Koweït : balance commerciale par année ($ US), 1965–2025
| Année | $ US | |
|---|---|---|
 Suisse |
 Koweït |
|
| 2025 | 93 327 424 779 $ US | 16 276 674 173 $ US |
| 2024 | 116 875 945 667 $ US | 28 191 893 469 $ US |
| 2023 | 101 202 061 236 $ US | 32 049 742 012 $ US |
| 2022 | 117 559 414 871 $ US | 55 010 938 776 $ US |
| 2021 | 99 877 578 549 $ US | 31 822 717 583 $ US |
| 2020 | 42 986 735 072 $ US | 6 011 762 286 $ US |
| 2019 | 68 295 204 649 $ US | 17 509 576 399 $ US |
| 2018 | 73 995 137 798 $ US | 16 411 973 268 $ US |
| 2017 | 58 909 490 111 $ US | 5 494 402 505 $ US |
| 2016 | 66 597 209 588 $ US | −977 113 032 $ US |
| 2015 | 71 602 620 494 $ US | 10 118 771 356 $ US |
| 2014 | 75 842 856 051 $ US | 60 138 150 594 $ US |
| 2013 | 73 866 194 779 $ US | 76 836 954 889 $ US |
| 2012 | 62 754 994 042 $ US | 84 329 989 712 $ US |
| 2011 | 53 497 314 868 $ US | 72 889 603 919 $ US |
| 2010 | 58 133 791 152 $ US | 41 918 027 124 $ US |
| 2009 | 34 705 789 909 $ US | 31 850 165 922 $ US |
| 2008 | 52 921 058 074 $ US | 60 183 463 032 $ US |
| 2007 | 47 201 037 154 $ US | 40 233 767 513 $ US |
| 2006 | 29 597 737 279 $ US | 42 022 772 386 $ US |
| 2005 | 21 536 056 858 $ US | 28 852 739 726 $ US |
| 2004 | 27 242 195 416 $ US | 14 584 323 040 $ US |
| 2003 | 16 783 998 663 $ US | 8 439 257 480 $ US |
| 2002 | 14 761 475 683 $ US | 3 053 495 397 $ US |
| 2001 | 10 603 772 813 $ US | 5 500 811 916 $ US |
| 2000 | 12 292 429 536 $ US | 9 929 845 608 $ US |
| 1999 | 9 788 555 452 $ US | 1 957 853 588 $ US |
| 1998 | 9 746 614 016 $ US | −1 876 911 365 $ US |
| 1997 | 11 941 174 120 $ US | 4 025 066 837 $ US |
| 1996 | 9 727 214 401 $ US | 4 124 792 508 $ US |
| 1995 | 11 678 361 945 $ US | 2 824 612 663 $ US |
| 1994 | 10 539 556 189 $ US | 2 117 844 781 $ US |
| 1993 | 9 449 052 518 $ US | 834 437 748 $ US |
| 1992 | 5 842 552 269 $ US | −2 730 061 350 $ US |
| 1991 | 2 469 264 296 $ US | −11 979 850 423 $ US |
| 1990 | −826 786 640 $ US | −2 420 138 889 $ US |
| 1989 | 1 347 452 778 $ US | 2 682 288 387 $ US |
| 1988 | 1 585 879 861 $ US | 956 889 069 $ US |
| 1987 | 1 565 024 812 $ US | 3 448 610 687 $ US |
| 1986 | 434 064 150 $ US | −326 914 778 $ US |
| 1985 | 2 176 477 962 $ US | 2 344 116 933 $ US |
| 1984 | 2 438 939 013 $ US | 3 357 405 206 $ US |
| 1983 | −1 788 923 824 $ US | 2 040 607 321 $ US |
| 1982 | 4 030 439 $ US | 461 948 310 $ US |
| 1981 | −99 430 302 $ US | 7 773 015 406 $ US |
| 1980 | −3 479 950 468 $ US | 12 615 751 562 $ US |
| 1979 | 879 793 108 $ US | 12 165 027 898 $ US |
| 1978 | 4 440 991 611 $ US | 4 755 447 132 $ US |
| 1977 | 3 344 607 447 $ US | 4 040 954 265 $ US |
| 1976 | 3 651 735 878 $ US | 5 959 224 931 $ US |
| 1975 | 3 077 404 796 $ US | 6 547 553 718 $ US |
| 1974 | −618 285 168 $ US | 9 250 181 647 $ US |
| 1973 | −63 467 202 $ US | 2 691 757 819 $ US |
| 1972 | 43 511 115 $ US | 2 133 461 418 $ US |
| 1971 | −193 591 766 $ US | 1 850 333 335 $ US |
| 1970 | −193 422 365 $ US | 1 025 919 590 $ US |
| 1969 | - | 957 599 617 $ US |
| 1968 | - | 949 199 620 $ US |
| 1967 | - | 758 799 696 $ US |
| 1966 | - | 988 399 605 $ US |
| 1965 | - | 935 199 626 $ US |
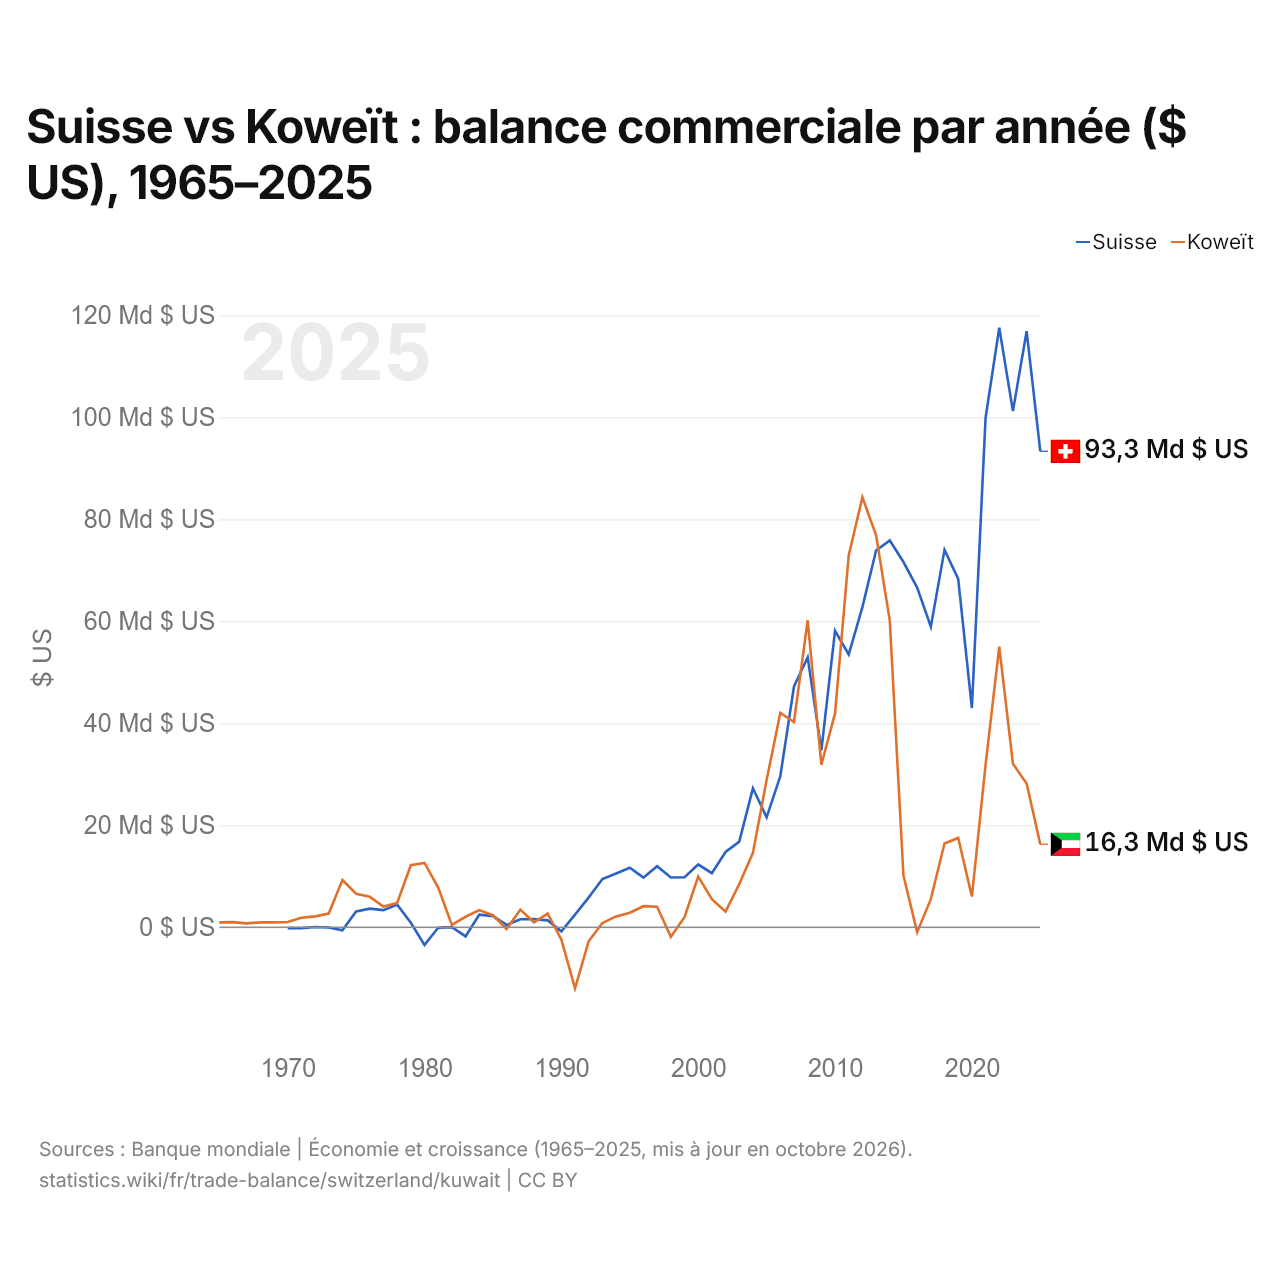
En 2025, la balance commerciale de la Suisse affichait un excédent de 93,3 milliards de dollars et celle du Koweït un excédent de 16,3 milliards de dollars ; l'excédent de la Suisse était 5,7 fois plus grand. En 1970, la balance commerciale de la Suisse affichait un déficit de 193 millions de dollars et celle du Koweït un excédent de 1,03 milliard de dollars.
De 1970 à 2025, la balance commerciale de la Suisse a été excédentaire pendant 48 des 56 années, et celle du Koweït pendant 50. Les balances commerciales de la Suisse et du Koweït n'ont été déficitaires en même temps qu'une seule de ces années, en 1990.
Suisse vs Koweït : chiffres de la balance commerciale
|
Suisse
|
Koweït
|
|
|---|---|---|
| Biens et services, $ US | +93,3 Md $US (2025) | +16,3 Md $US (2025) |
| % du PIB | +8,9 % (2025) | +10,4 % (2025) |
| Années d'excédent depuis 2000 | 26 sur 26 | 25 sur 26 |
| Solde des biens entre les deux, chiffres propres | +767 M $US (2025) | −1,22 Md $US (2025) |
| Premier excédent en biens avec | États-Unis (+57,0 Md $US, 2025) | Irak (+737 M $US, 2025) |
| Premier déficit en biens avec | Émirats arabes unis (−35,9 Md $US, 2025) | Chine (−7,99 Md $US, 2025) |
Comparer la balance commerciale de 2 pays au choix
Sources :
- Banque mondiale | Économie et croissance (1965–2025, mis à jour en octobre 2026)
- TradeMap (2001–2025, mis à jour en octobre 2026)
Creative Commons Attribution (CC BY) : vous pouvez copier, partager, adapter et réutiliser ce contenu, y compris à des fins commerciales, à condition de citer statistics.wiki et d’indiquer les modifications apportées. Les sources citées ci-dessus peuvent avoir leurs propres conditions de licence.