
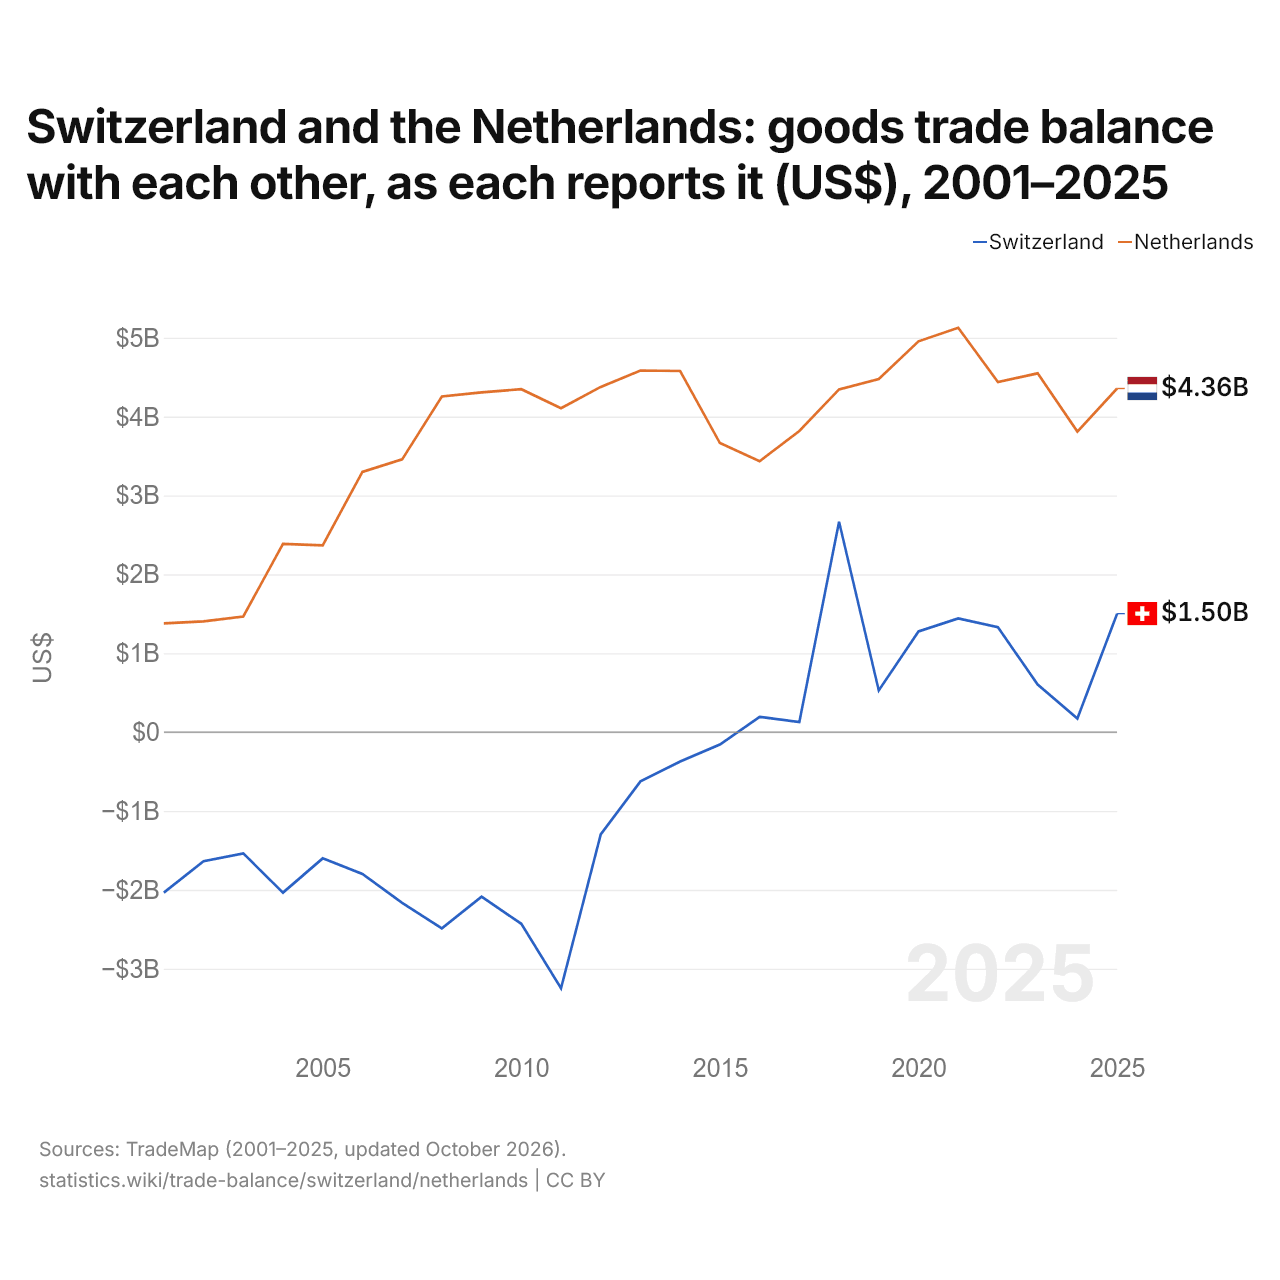
La Suisse et les Pays-Bas : solde de leur commerce de biens bilatéral, selon chacun ($ US), 2001–2025
| Année | $ US | |
|---|---|---|
| Suisse | Pays-Bas | |
| 2025 | 1 501 393 000 $ US | 4 356 301 000 $ US |
| 2024 | 171 634 000 $ US | 3 810 129 000 $ US |
| 2023 | 601 308 000 $ US | 4 548 282 000 $ US |
| 2022 | 1 329 479 000 $ US | 4 439 109 000 $ US |
| 2021 | 1 440 439 000 $ US | 5 126 900 000 $ US |
| 2020 | 1 275 748 000 $ US | 4 954 025 000 $ US |
| 2019 | 527 762 000 $ US | 4 477 019 000 $ US |
| 2018 | 2 666 088 000 $ US | 4 344 583 000 $ US |
| 2017 | 127 870 000 $ US | 3 817 083 000 $ US |
| 2016 | 192 880 000 $ US | 3 434 124 000 $ US |
| 2015 | −158 617 000 $ US | 3 664 340 000 $ US |
| 2014 | −372 104 000 $ US | 4 578 348 000 $ US |
| 2013 | −624 322 000 $ US | 4 584 039 000 $ US |
| 2012 | −1 297 926 000 $ US | 4 376 340 000 $ US |
| 2011 | −3 248 457 000 $ US | 4 105 431 000 $ US |
| 2010 | −2 430 812 000 $ US | 4 346 931 000 $ US |
| 2009 | −2 087 251 000 $ US | 4 306 518 000 $ US |
| 2008 | −2 487 367 000 $ US | 4 255 875 000 $ US |
| 2007 | −2 164 809 000 $ US | 3 457 554 000 $ US |
| 2006 | −1 799 088 000 $ US | 3 298 757 000 $ US |
| 2005 | −1 601 088 000 $ US | 2 367 935 000 $ US |
| 2004 | −2 035 321 000 $ US | 2 385 473 000 $ US |
| 2003 | −1 537 740 000 $ US | 1 465 589 000 $ US |
| 2002 | −1 637 322 000 $ US | 1 403 337 000 $ US |
| 2001 | −2 034 852 000 $ US | 1 377 326 000 $ US |
En 2025, selon la Suisse, son commerce de biens avec les Pays-Bas affichait un excédent de 1,5 milliard de dollars ; selon les Pays-Bas, leur commerce de biens avec la Suisse affichait un excédent de 4,36 milliards de dollars. En 2001, les chiffres étaient un déficit de 2,03 milliards de dollars pour la Suisse et un excédent de 1,38 milliard de dollars pour les Pays-Bas.
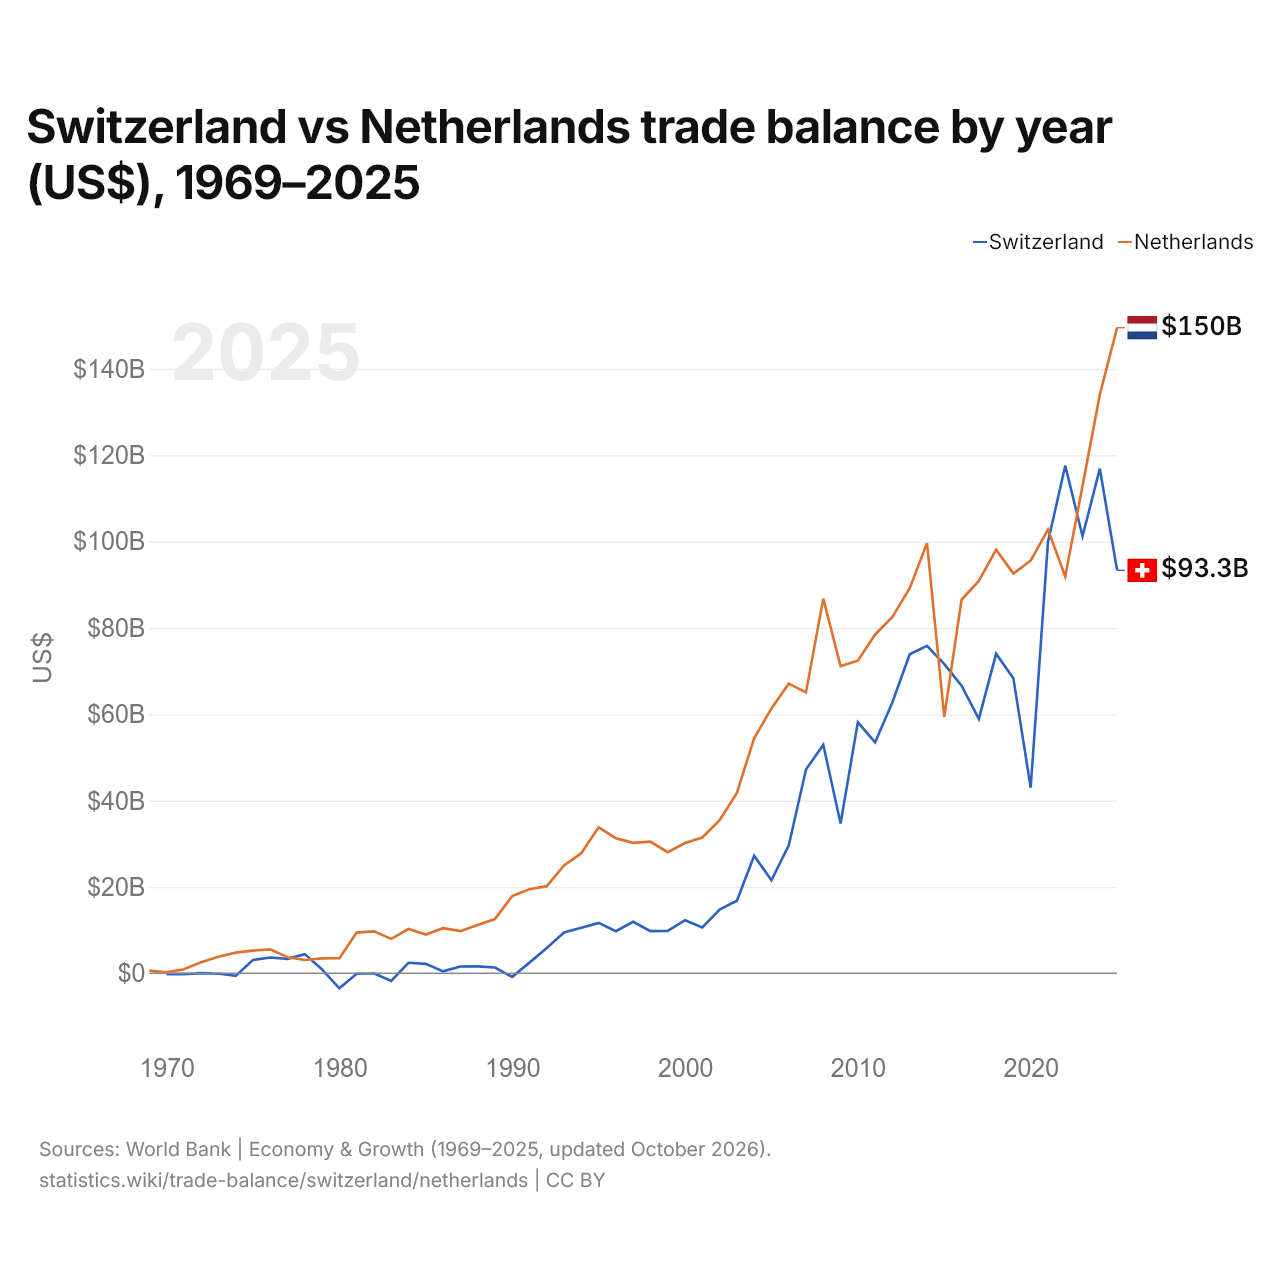
Suisse vs Pays-Bas : balance commerciale par année ($ US), 1969–2025
| Année | $ US | |
|---|---|---|
 Suisse |
 Pays-Bas |
|
| 2025 | 93 327 424 779 $ US | 149 519 368 722 $ US |
| 2024 | 116 875 945 667 $ US | 134 007 361 075 $ US |
| 2023 | 101 202 061 236 $ US | 112 885 525 975 $ US |
| 2022 | 117 559 414 871 $ US | 91 883 758 920 $ US |
| 2021 | 99 877 578 549 $ US | 102 760 026 360 $ US |
| 2020 | 42 986 735 072 $ US | 95 585 823 574 $ US |
| 2019 | 68 295 204 649 $ US | 92 567 108 267 $ US |
| 2018 | 73 995 137 798 $ US | 98 121 967 356 $ US |
| 2017 | 58 909 490 111 $ US | 90 871 553 835 $ US |
| 2016 | 66 597 209 588 $ US | 86 519 974 912 $ US |
| 2015 | 71 602 620 494 $ US | 59 405 539 190 $ US |
| 2014 | 75 842 856 051 $ US | 99 609 660 307 $ US |
| 2013 | 73 866 194 779 $ US | 89 195 079 396 $ US |
| 2012 | 62 754 994 042 $ US | 82 521 976 395 $ US |
| 2011 | 53 497 314 868 $ US | 78 468 693 473 $ US |
| 2010 | 58 133 791 152 $ US | 72 400 038 600 $ US |
| 2009 | 34 705 789 909 $ US | 71 142 272 210 $ US |
| 2008 | 52 921 058 074 $ US | 86 778 984 923 $ US |
| 2007 | 47 201 037 154 $ US | 65 052 481 087 $ US |
| 2006 | 29 597 737 279 $ US | 67 090 411 938 $ US |
| 2005 | 21 536 056 858 $ US | 61 353 555 872 $ US |
| 2004 | 27 242 195 416 $ US | 54 443 116 593 $ US |
| 2003 | 16 783 998 663 $ US | 41 785 064 886 $ US |
| 2002 | 14 761 475 683 $ US | 35 473 198 312 $ US |
| 2001 | 10 603 772 813 $ US | 31 443 761 454 $ US |
| 2000 | 12 292 429 536 $ US | 30 149 484 438 $ US |
| 1999 | 9 788 555 452 $ US | 28 049 104 555 $ US |
| 1998 | 9 746 614 016 $ US | 30 467 673 850 $ US |
| 1997 | 11 941 174 120 $ US | 30 213 462 842 $ US |
| 1996 | 9 727 214 401 $ US | 31 287 581 699 $ US |
| 1995 | 11 678 361 945 $ US | 33 823 771 617 $ US |
| 1994 | 10 539 556 189 $ US | 27 817 382 250 $ US |
| 1993 | 9 449 052 518 $ US | 24 988 427 860 $ US |
| 1992 | 5 842 552 269 $ US | 20 174 407 268 $ US |
| 1991 | 2 469 264 296 $ US | 19 451 513 437 $ US |
| 1990 | −826 786 640 $ US | 17 883 441 849 $ US |
| 1989 | 1 347 452 778 $ US | 12 556 469 916 $ US |
| 1988 | 1 585 879 861 $ US | 11 195 472 182 $ US |
| 1987 | 1 565 024 812 $ US | 9 754 287 424 $ US |
| 1986 | 434 064 150 $ US | 10 457 692 031 $ US |
| 1985 | 2 176 477 962 $ US | 8 962 418 392 $ US |
| 1984 | 2 438 939 013 $ US | 10 259 458 104 $ US |
| 1983 | −1 788 923 824 $ US | 7 966 659 717 $ US |
| 1982 | 4 030 439 $ US | 9 708 016 011 $ US |
| 1981 | −99 430 302 $ US | 9 423 038 947 $ US |
| 1980 | −3 479 950 468 $ US | 3 500 606 296 $ US |
| 1979 | 879 793 108 $ US | 3 439 706 690 $ US |
| 1978 | 4 440 991 611 $ US | 3 075 533 714 $ US |
| 1977 | 3 344 607 447 $ US | 3 708 195 205 $ US |
| 1976 | 3 651 735 878 $ US | 5 533 782 297 $ US |
| 1975 | 3 077 404 796 $ US | 5 259 495 469 $ US |
| 1974 | −618 285 168 $ US | 4 786 280 843 $ US |
| 1973 | −63 467 202 $ US | 3 843 968 154 $ US |
| 1972 | 43 511 115 $ US | 2 565 120 846 $ US |
| 1971 | −193 591 766 $ US | 940 433 584 $ US |
| 1970 | −193 422 365 $ US | 195 855 604 $ US |
| 1969 | - | 611 798 612 $ US |
En 2025, la balance commerciale de la Suisse affichait un excédent de 93,3 milliards de dollars et celle des Pays-Bas un excédent de 150 milliards de dollars ; l'excédent des Pays-Bas était 1,6 fois plus grand. En 1970, la balance commerciale de la Suisse affichait un déficit de 193 millions de dollars et celle des Pays-Bas un excédent de 196 millions de dollars.
De 1970 à 2025, la balance commerciale de la Suisse a été excédentaire pendant 48 des 56 années, et celle des Pays-Bas chacune d'elles. Les balances commerciales de la Suisse et des Pays-Bas n'ont jamais été déficitaires la même année.
Suisse vs Pays-Bas : chiffres de la balance commerciale
|
Suisse
|
Pays-Bas
|
|
|---|---|---|
| Biens et services, $ US | +93,3 Md $US (2025) | +150 Md $US (2025) |
| % du PIB | +8,9 % (2025) | +11,2 % (2025) |
| Années d'excédent depuis 2000 | 26 sur 26 | 26 sur 26 |
| Solde des biens entre les deux, chiffres propres | +1,50 Md $US (2025) | +4,36 Md $US (2025) |
| Premier excédent en biens avec | États-Unis (+57,0 Md $US, 2025) | Allemagne (+52,4 Md $US, 2025) |
| Premier déficit en biens avec | Émirats arabes unis (−35,9 Md $US, 2025) | Chine (−33,7 Md $US, 2025) |
Comparer la balance commerciale de 2 pays au choix
Sources :
- Banque mondiale | Économie et croissance (1969–2025, mis à jour en octobre 2026)
- TradeMap (2001–2025, mis à jour en octobre 2026)
Creative Commons Attribution (CC BY) : vous pouvez copier, partager, adapter et réutiliser ce contenu, y compris à des fins commerciales, à condition de citer statistics.wiki et d’indiquer les modifications apportées. Les sources citées ci-dessus peuvent avoir leurs propres conditions de licence.