
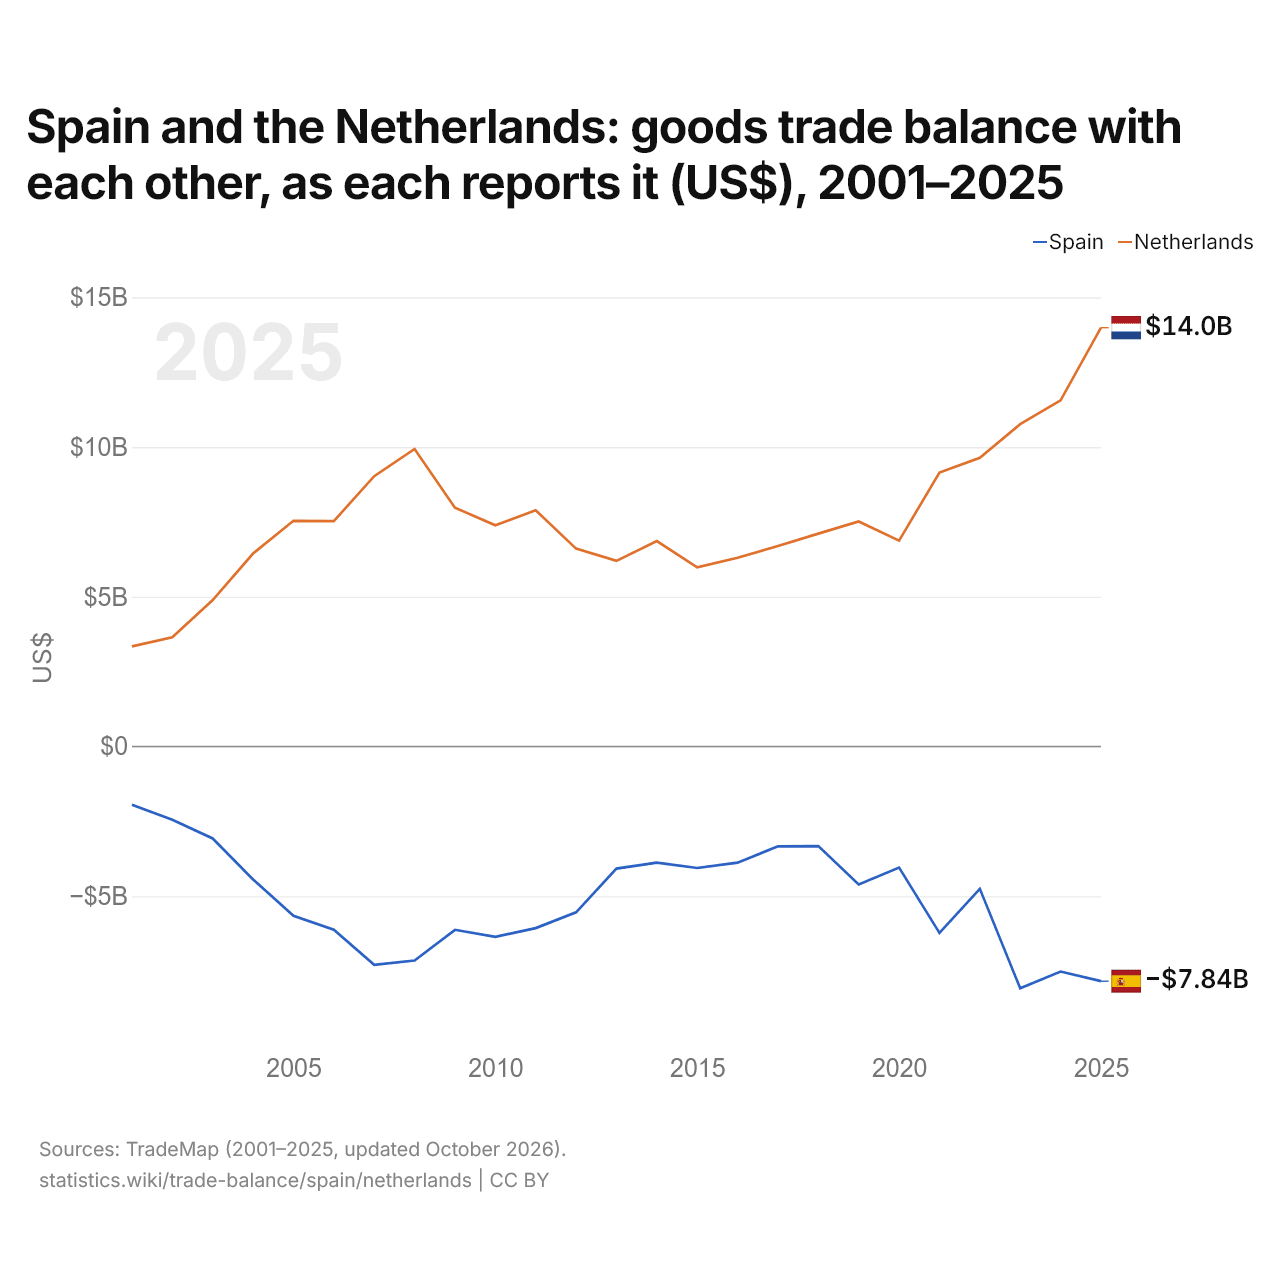
L'Espagne et les Pays-Bas : solde de leur commerce de biens bilatéral, selon chacun ($ US), 2001–2025
| Année | $ US | |
|---|---|---|
| Espagne | Pays-Bas | |
| 2025 | −7 837 765 000 $ US | 13 986 084 000 $ US |
| 2024 | −7 515 615 000 $ US | 11 559 486 000 $ US |
| 2023 | −8 075 977 000 $ US | 10 766 238 000 $ US |
| 2022 | −4 754 237 000 $ US | 9 640 174 000 $ US |
| 2021 | −6 227 133 000 $ US | 9 148 677 000 $ US |
| 2020 | −4 042 741 000 $ US | 6 873 425 000 $ US |
| 2019 | −4 609 330 000 $ US | 7 514 069 000 $ US |
| 2018 | −3 327 229 000 $ US | 7 109 354 000 $ US |
| 2017 | −3 333 580 000 $ US | 6 692 916 000 $ US |
| 2016 | −3 881 152 000 $ US | 6 305 152 000 $ US |
| 2015 | −4 058 937 000 $ US | 5 981 771 000 $ US |
| 2014 | −3 879 912 000 $ US | 6 859 177 000 $ US |
| 2013 | −4 078 877 000 $ US | 6 197 834 000 $ US |
| 2012 | −5 539 616 000 $ US | 6 606 992 000 $ US |
| 2011 | −6 066 169 000 $ US | 7 887 352 000 $ US |
| 2010 | −6 360 009 000 $ US | 7 386 703 000 $ US |
| 2009 | −6 122 492 000 $ US | 7 973 570 000 $ US |
| 2008 | −7 147 777 000 $ US | 9 936 002 000 $ US |
| 2007 | −7 293 037 000 $ US | 9 027 343 000 $ US |
| 2006 | −6 116 001 000 $ US | 7 526 244 000 $ US |
| 2005 | −5 653 322 000 $ US | 7 536 790 000 $ US |
| 2004 | −4 439 597 000 $ US | 6 443 385 000 $ US |
| 2003 | −3 072 288 000 $ US | 4 890 051 000 $ US |
| 2002 | −2 448 651 000 $ US | 3 649 797 000 $ US |
| 2001 | −1 943 519 000 $ US | 3 343 429 000 $ US |
En 2025, selon l'Espagne, son commerce de biens avec les Pays-Bas affichait un déficit de 7,84 milliards de dollars ; selon les Pays-Bas, leur commerce de biens avec l'Espagne affichait un excédent de 14 milliards de dollars. En 2001, les chiffres étaient un déficit de 1,94 milliard de dollars pour l'Espagne et un excédent de 3,34 milliards de dollars pour les Pays-Bas.
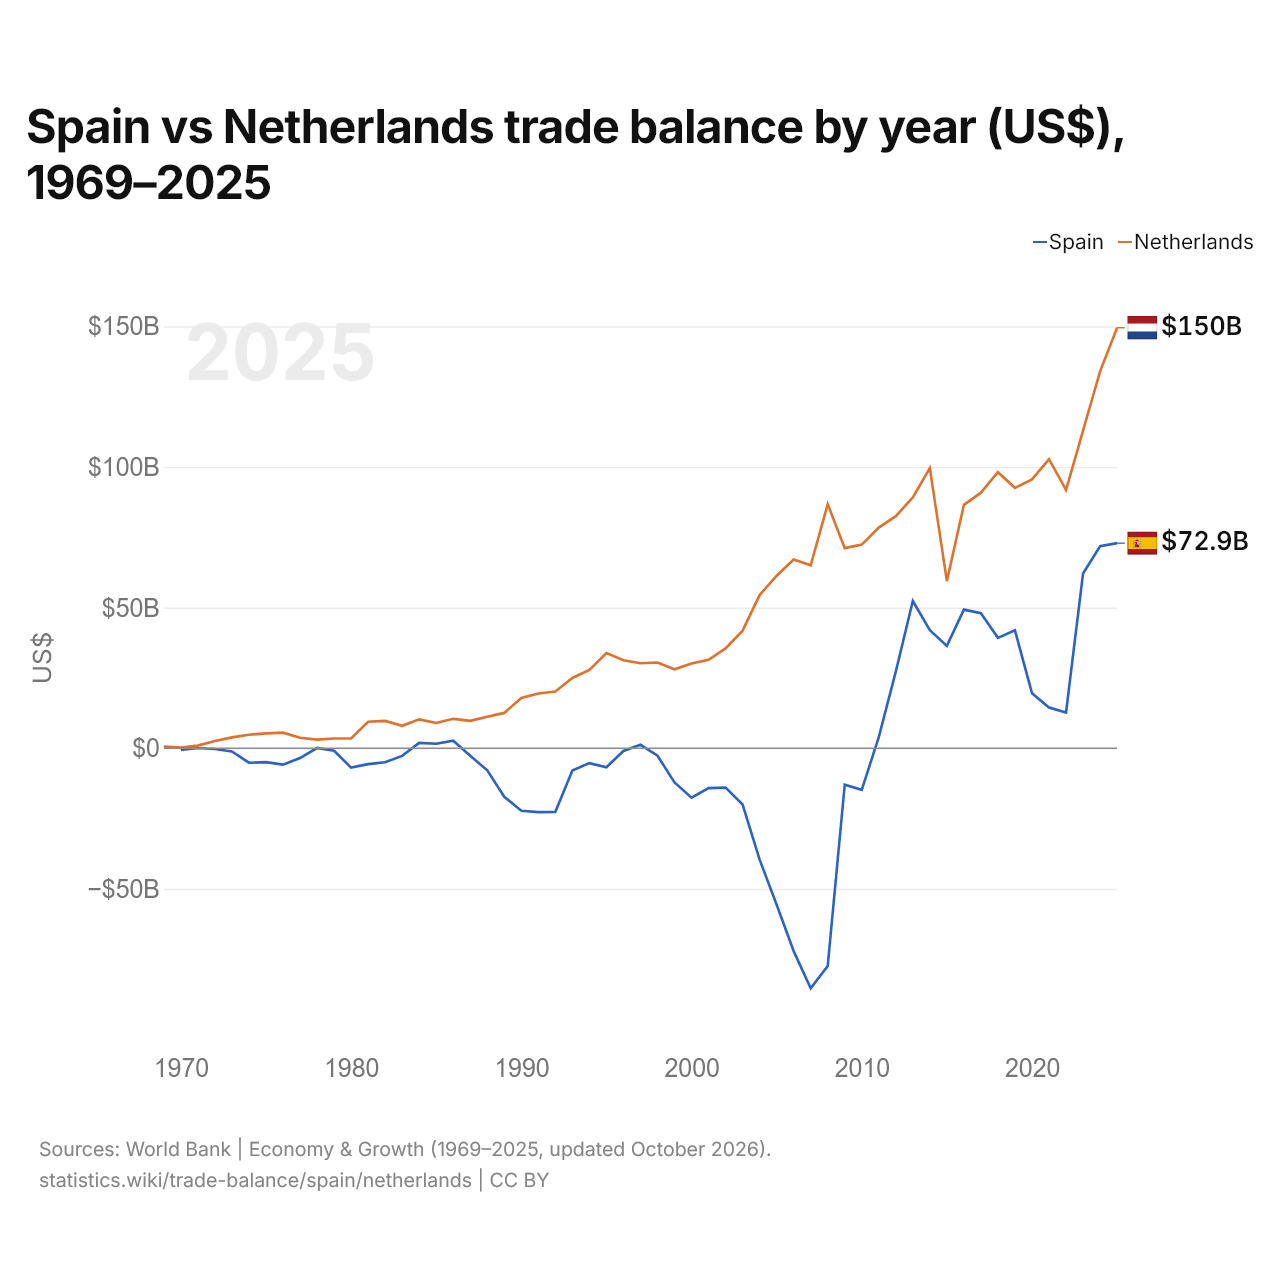
Espagne vs Pays-Bas : balance commerciale par année ($ US), 1969–2025
| Année | $ US | |
|---|---|---|
 Espagne |
 Pays-Bas |
|
| 2025 | 72 905 382 033 $ US | 149 519 368 722 $ US |
| 2024 | 71 813 779 341 $ US | 134 007 361 075 $ US |
| 2023 | 62 117 801 378 $ US | 112 885 525 975 $ US |
| 2022 | 12 715 562 305 $ US | 91 883 758 920 $ US |
| 2021 | 14 460 183 031 $ US | 102 760 026 360 $ US |
| 2020 | 19 552 112 993 $ US | 95 585 823 574 $ US |
| 2019 | 41 892 975 106 $ US | 92 567 108 267 $ US |
| 2018 | 39 230 127 861 $ US | 98 121 967 356 $ US |
| 2017 | 48 023 876 493 $ US | 90 871 553 835 $ US |
| 2016 | 49 290 395 615 $ US | 86 519 974 912 $ US |
| 2015 | 36 369 832 555 $ US | 59 405 539 190 $ US |
| 2014 | 41 951 397 767 $ US | 99 609 660 307 $ US |
| 2013 | 52 337 147 571 $ US | 89 195 079 396 $ US |
| 2012 | 27 224 671 957 $ US | 82 521 976 395 $ US |
| 2011 | 3 942 017 276 $ US | 78 468 693 473 $ US |
| 2010 | −14 818 860 900 $ US | 72 400 038 600 $ US |
| 2009 | −12 958 923 482 $ US | 71 142 272 210 $ US |
| 2008 | −77 429 392 408 $ US | 86 778 984 923 $ US |
| 2007 | −85 367 077 063 $ US | 65 052 481 087 $ US |
| 2006 | −72 139 174 807 $ US | 67 090 411 938 $ US |
| 2005 | −55 631 984 710 $ US | 61 353 555 872 $ US |
| 2004 | −39 615 800 979 $ US | 54 443 116 593 $ US |
| 2003 | −20 017 014 300 $ US | 41 785 064 886 $ US |
| 2002 | −13 991 654 416 $ US | 35 473 198 312 $ US |
| 2001 | −14 189 458 605 $ US | 31 443 761 454 $ US |
| 2000 | −17 606 826 022 $ US | 30 149 484 438 $ US |
| 1999 | −12 163 706 600 $ US | 28 049 104 555 $ US |
| 1998 | −2 663 993 763 $ US | 30 467 673 850 $ US |
| 1997 | 1 209 090 909 $ US | 30 213 462 842 $ US |
| 1996 | −973 335 085 $ US | 31 287 581 699 $ US |
| 1995 | −6 745 396 317 $ US | 33 823 771 617 $ US |
| 1994 | −5 306 615 327 $ US | 27 817 382 250 $ US |
| 1993 | −7 943 935 155 $ US | 24 988 427 860 $ US |
| 1992 | −22 619 393 792 $ US | 20 174 407 268 $ US |
| 1991 | −22 740 254 604 $ US | 19 451 513 437 $ US |
| 1990 | −22 235 288 932 $ US | 17 883 441 849 $ US |
| 1989 | −17 259 685 172 $ US | 12 556 469 916 $ US |
| 1988 | −7 858 501 643 $ US | 11 195 472 182 $ US |
| 1987 | −2 712 726 048 $ US | 9 754 287 424 $ US |
| 1986 | 2 681 646 667 $ US | 10 457 692 031 $ US |
| 1985 | 1 600 854 207 $ US | 8 962 418 392 $ US |
| 1984 | 1 872 076 175 $ US | 10 259 458 104 $ US |
| 1983 | −2 730 429 234 $ US | 7 966 659 717 $ US |
| 1982 | −5 009 245 797 $ US | 9 708 016 011 $ US |
| 1981 | −5 669 717 066 $ US | 9 423 038 947 $ US |
| 1980 | −6 898 052 913 $ US | 3 500 606 296 $ US |
| 1979 | −885 949 430 $ US | 3 439 706 690 $ US |
| 1978 | 78 546 007 $ US | 3 075 533 714 $ US |
| 1977 | −3 503 969 332 $ US | 3 708 195 205 $ US |
| 1976 | −5 842 516 787 $ US | 5 533 782 297 $ US |
| 1975 | −4 959 394 203 $ US | 5 259 495 469 $ US |
| 1974 | −5 167 078 166 $ US | 4 786 280 843 $ US |
| 1973 | −1 140 005 711 $ US | 3 843 968 154 $ US |
| 1972 | −288 646 130 $ US | 2 565 120 846 $ US |
| 1971 | 68 340 120 $ US | 940 433 584 $ US |
| 1970 | −634 228 667 $ US | 195 855 604 $ US |
| 1969 | - | 611 798 612 $ US |
En 2025, la balance commerciale de l'Espagne affichait un excédent de 72,9 milliards de dollars et celle des Pays-Bas un excédent de 150 milliards de dollars ; l'excédent des Pays-Bas était 2,1 fois plus grand. En 1970, la balance commerciale de l'Espagne affichait un déficit de 634 millions de dollars et celle des Pays-Bas un excédent de 196 millions de dollars.
De 1970 à 2025, la balance commerciale de l'Espagne a été excédentaire pendant 21 des 56 années, et celle des Pays-Bas chacune d'elles. Les balances commerciales de l'Espagne et des Pays-Bas n'ont jamais été déficitaires la même année.
Espagne vs Pays-Bas : chiffres de la balance commerciale
|
Espagne
|
Pays-Bas
|
|
|---|---|---|
| Biens et services, $ US | +72,9 Md $US (2025) | +150 Md $US (2025) |
| % du PIB | +3,8 % (2025) | +11,2 % (2025) |
| Années d'excédent depuis 2000 | 15 sur 26 | 26 sur 26 |
| Solde des biens entre les deux, chiffres propres | −7,84 Md $US (2025) | +14,0 Md $US (2025) |
| Premier excédent en biens avec | Portugal (+20,1 Md $US, 2025) | Allemagne (+52,4 Md $US, 2025) |
| Premier déficit en biens avec | Chine (−47,1 Md $US, 2025) | Chine (−33,7 Md $US, 2025) |
Comparer la balance commerciale de 2 pays au choix
Sources :
- Banque mondiale | Économie et croissance (1969–2025, mis à jour en octobre 2026)
- TradeMap (2001–2025, mis à jour en octobre 2026)
Creative Commons Attribution (CC BY) : vous pouvez copier, partager, adapter et réutiliser ce contenu, y compris à des fins commerciales, à condition de citer statistics.wiki et d’indiquer les modifications apportées. Les sources citées ci-dessus peuvent avoir leurs propres conditions de licence.