
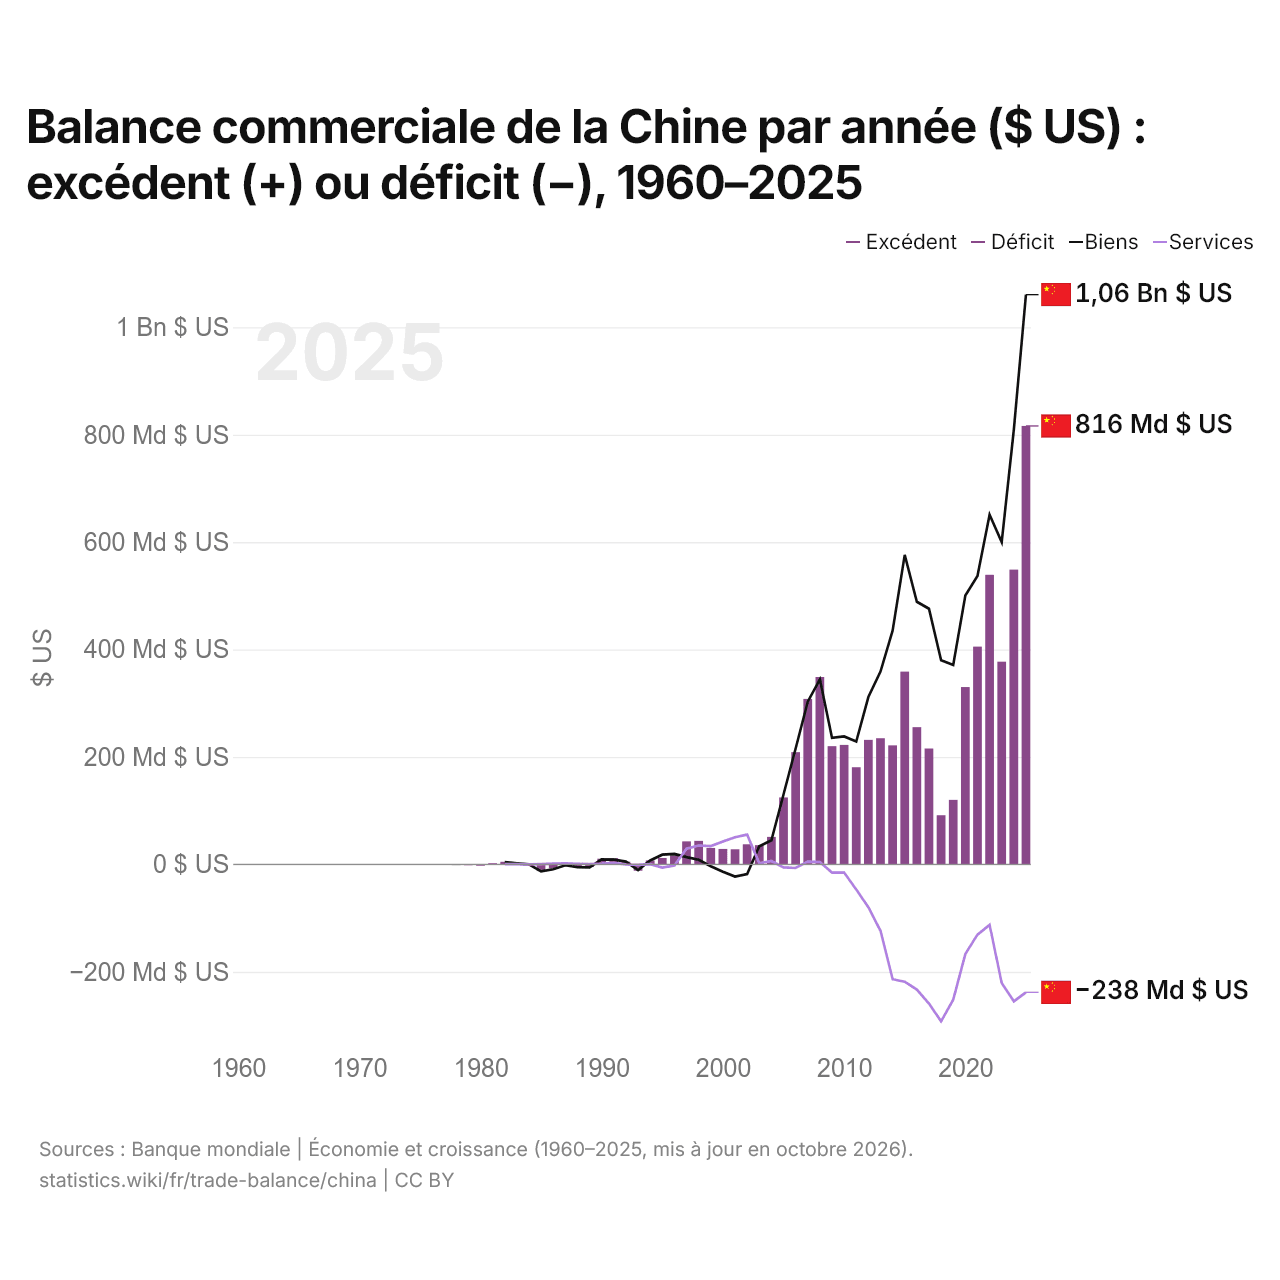
Balance commerciale de la Chine par année ($ US) : excédent (+) ou déficit (−), 1960–2025
| Année | $ US | ||
|---|---|---|---|
| Biens et services | Biens | Services | |
| 2025 | 816 189 653 994 $ US | 1 060 554 188 436 $ US | −238 112 200 157 $ US |
| 2024 | 548 703 728 924 $ US | 809 100 446 485 $ US | −254 979 114 149 $ US |
| 2023 | 377 368 486 355 $ US | 600 038 595 600 $ US | −220 816 083 762 $ US |
| 2022 | 539 054 406 264 $ US | 650 919 724 478 $ US | −112 543 094 105 $ US |
| 2021 | 405 394 120 058 $ US | 536 699 812 289 $ US | −130 683 779 983 $ US |
| 2020 | 330 134 703 664 $ US | 500 475 269 176 $ US | −167 022 409 519 $ US |
| 2019 | 120 151 888 640 $ US | 371 088 097 666 $ US | −251 886 307 047 $ US |
| 2018 | 91 487 265 093 $ US | 380 073 518 632 $ US | −292 168 370 180 $ US |
| 2017 | 215 697 133 466 $ US | 475 941 413 134 $ US | −258 931 513 200 $ US |
| 2016 | 255 484 319 295 $ US | 488 882 999 359 $ US | −233 145 911 117 $ US |
| 2015 | 358 836 357 206 $ US | 576 191 072 366 $ US | −218 320 308 084 $ US |
| 2014 | 221 549 605 872 $ US | 435 041 621 802 $ US | −213 742 374 855 $ US |
| 2013 | 234 872 118 182 $ US | 358 981 297 740 $ US | −123 601 736 136 $ US |
| 2012 | 231 864 021 797 $ US | 311 569 753 155 $ US | −79 724 876 407 $ US |
| 2011 | 180 895 321 770 $ US | 228 700 752 634 $ US | −46 797 013 721 $ US |
| 2010 | 222 400 893 687 $ US | 238 086 469 488 $ US | −15 062 597 775 $ US |
| 2009 | 220 130 401 367 $ US | 235 476 707 260 $ US | −15 346 305 893 $ US |
| 2008 | 348 832 533 154 $ US | 344 467 617 307 $ US | 4 364 915 847 $ US |
| 2007 | 308 036 028 783 $ US | 302 846 264 377 $ US | 5 189 764 406 $ US |
| 2006 | 208 918 924 501 $ US | 215 686 120 290 $ US | −6 767 195 789 $ US |
| 2005 | 124 626 797 517 $ US | 130 128 746 434 $ US | −5 501 948 917 $ US |
| 2004 | 51 174 382 540 $ US | 44 895 552 673 $ US | 6 278 829 867 $ US |
| 2003 | 35 821 129 066 $ US | 33 689 172 315 $ US | 2 131 956 751 $ US |
| 2002 | 37 382 671 264 $ US | −18 020 418 975 $ US | 55 403 506 639 $ US |
| 2001 | 28 086 220 298 $ US | −22 568 000 000 $ US | 50 652 000 000 $ US |
| 2000 | 28 785 851 579 $ US | −13 565 524 000 $ US | 42 439 058 000 $ US |
| 1999 | 30 640 955 367 $ US | −3 342 000 000 $ US | 33 983 000 000 $ US |
| 1998 | 43 836 689 480 $ US | 8 662 000 000 $ US | 35 175 000 000 $ US |
| 1997 | 42 823 220 000 $ US | 13 552 000 000 $ US | 29 272 000 000 $ US |
| 1996 | 17 550 000 000 $ US | 19 535 000 000 $ US | −1 984 000 000 $ US |
| 1995 | 11 958 000 000 $ US | 18 050 110 000 $ US | −6 092 520 000 $ US |
| 1994 | 7 357 000 000 $ US | 7 290 000 000 $ US | 321 000 000 $ US |
| 1993 | −11 792 000 000 $ US | −10 654 000 000 $ US | −843 000 000 $ US |
| 1992 | 4 998 000 000 $ US | 5 183 000 000 $ US | −185 000 000 $ US |
| 1991 | 11 601 000 000 $ US | 8 743 000 000 $ US | 2 858 000 000 $ US |
| 1990 | 10 668 000 000 $ US | 9 165 000 000 $ US | 1 503 000 000 $ US |
| 1989 | −4 928 000 000 $ US | −5 620 000 000 $ US | 693 000 000 $ US |
| 1988 | −4 061 000 000 $ US | −5 315 000 000 $ US | 1 255 000 000 $ US |
| 1987 | 291 000 000 $ US | −1 661 000 000 $ US | 1 952 000 000 $ US |
| 1986 | −7 390 000 000 $ US | −9 140 000 000 $ US | 1 551 000 000 $ US |
| 1985 | −12 501 000 000 $ US | −13 123 000 000 $ US | 531 000 000 $ US |
| 1984 | 54 000 000 $ US | 14 000 000 $ US | −46 000 000 $ US |
| 1983 | 2 571 000 000 $ US | 1 990 000 000 $ US | 485 000 000 $ US |
| 1982 | 4 812 000 000 $ US | 4 249 000 000 $ US | 488 000 000 $ US |
| 1981 | 2 150 220 000 $ US | - | - |
| 1980 | −2 436 990 000 $ US | - | - |
| 1979 | −1 572 643 000 $ US | - | - |
| 1978 | −1 460 560 000 $ US | - | - |
| 1977 | 210 672 000 $ US | - | - |
| 1976 | 90 791 000 $ US | - | - |
| 1975 | −380 480 000 $ US | - | - |
| 1974 | −503 131 000 $ US | - | - |
| 1973 | 701 488 000 $ US | - | - |
| 1972 | 620 760 000 $ US | - | - |
| 1971 | 477 289 000 $ US | - | - |
| 1970 | 72 660 000 $ US | - | - |
| 1969 | 483 200 000 $ US | - | - |
| 1968 | 269 480 000 $ US | - | - |
| 1967 | 236 020 000 $ US | - | - |
| 1966 | 185 300 000 $ US | - | - |
| 1965 | 330 180 000 $ US | - | - |
| 1964 | 457 760 000 $ US | - | - |
| 1963 | 455 680 000 $ US | - | - |
| 1962 | 377 650 000 $ US | - | - |
| 1961 | 97 520 000 $ US | - | - |
| 1960 | −7 530 000 $ US | - | - |
En 2025, la balance commerciale de la Chine affichait un excédent de 816 milliards de dollars, contre un déficit de 7,53 millions de dollars en 1960. Le plus grand déficit a été de 12,5 milliards de dollars, en 1985. La balance commerciale de la Chine est excédentaire chaque année depuis 1994. Le commerce de biens affichait un excédent de 1,06 billion de dollars et celui de services un déficit de 238 milliards de dollars.
En 2025, l'excédent commercial de la Chine était le plus élevé de 44 pays situés en Asie, devant Singapour (excédent de 214 milliards de dollars). De 2016 à 2025, les soldes commerciaux de la Chine ont totalisé un excédent de 3,7 billions de dollars, contre un excédent de 2,54 billions de dollars de 2006 à 2015. En 2025, les transactions courantes de la Chine affichaient un excédent de 3,8 % du PIB.
Commerce de biens de la Chine avec ses 10 principaux partenaires commerciaux, selon la Chine, 2025
| Pays | Exportations vers | Importations depuis | Solde | |
|---|---|---|---|---|
 États-Unis |
421 Md $US | 141 Md $US | +280 Md $US | vs USA |
 Corée du Sud |
145 Md $US | 187 Md $US | −42,7 Md $US | vs Corée du Sud |
 Japon |
157 Md $US | 165 Md $US | −7,52 Md $US | vs Japon |
 Vietnam |
199 Md $US | 98,0 Md $US | +101 Md $US | vs Vietnam |
 Russie |
103 Md $US | 124 Md $US | −20,5 Md $US | vs Russie |
 Allemagne |
118 Md $US | 92,9 Md $US | +25,4 Md $US | vs Allemagne |
 Australie |
76,5 Md $US | 128 Md $US | −51,6 Md $US | vs Australie |
 Malaisie |
104 Md $US | 88,1 Md $US | +15,7 Md $US | vs Malaisie |
 Brésil |
71,6 Md $US | 116 Md $US | −44,6 Md $US | vs Brésil |
 Indonésie |
85,4 Md $US | 82,3 Md $US | +3,14 Md $US | vs Indonésie |
Balance commerciale de la Chine : excédent (+) ou déficit (−)
| Biens et services, $ US, 2025 | +816 Md $US |
|---|---|
| % du PIB, 2025 | +4,2 % |
| Années d'excédent, 2000–2025 | 26 |
| Biens, $ US, 2025 | +1,06 Bn $US |
| Services, $ US, 2025 | −238 Md $US |
| Premier excédent en biens, 2025 | États-Unis +280 Md $US |
| Premier déficit en biens, 2025 | Australie −51,6 Md $US |
Comparer la balance commerciale de la Chine avec celle d'autres pays
Sources :
- TradeMap (2025, mis à jour en octobre 2026)
- Banque mondiale | Économie et croissance (1960–2025, mis à jour en octobre 2026)
Creative Commons Attribution (CC BY) : vous pouvez copier, partager, adapter et réutiliser ce contenu, y compris à des fins commerciales, à condition de citer statistics.wiki et d’indiquer les modifications apportées. Les sources citées ci-dessus peuvent avoir leurs propres conditions de licence.