
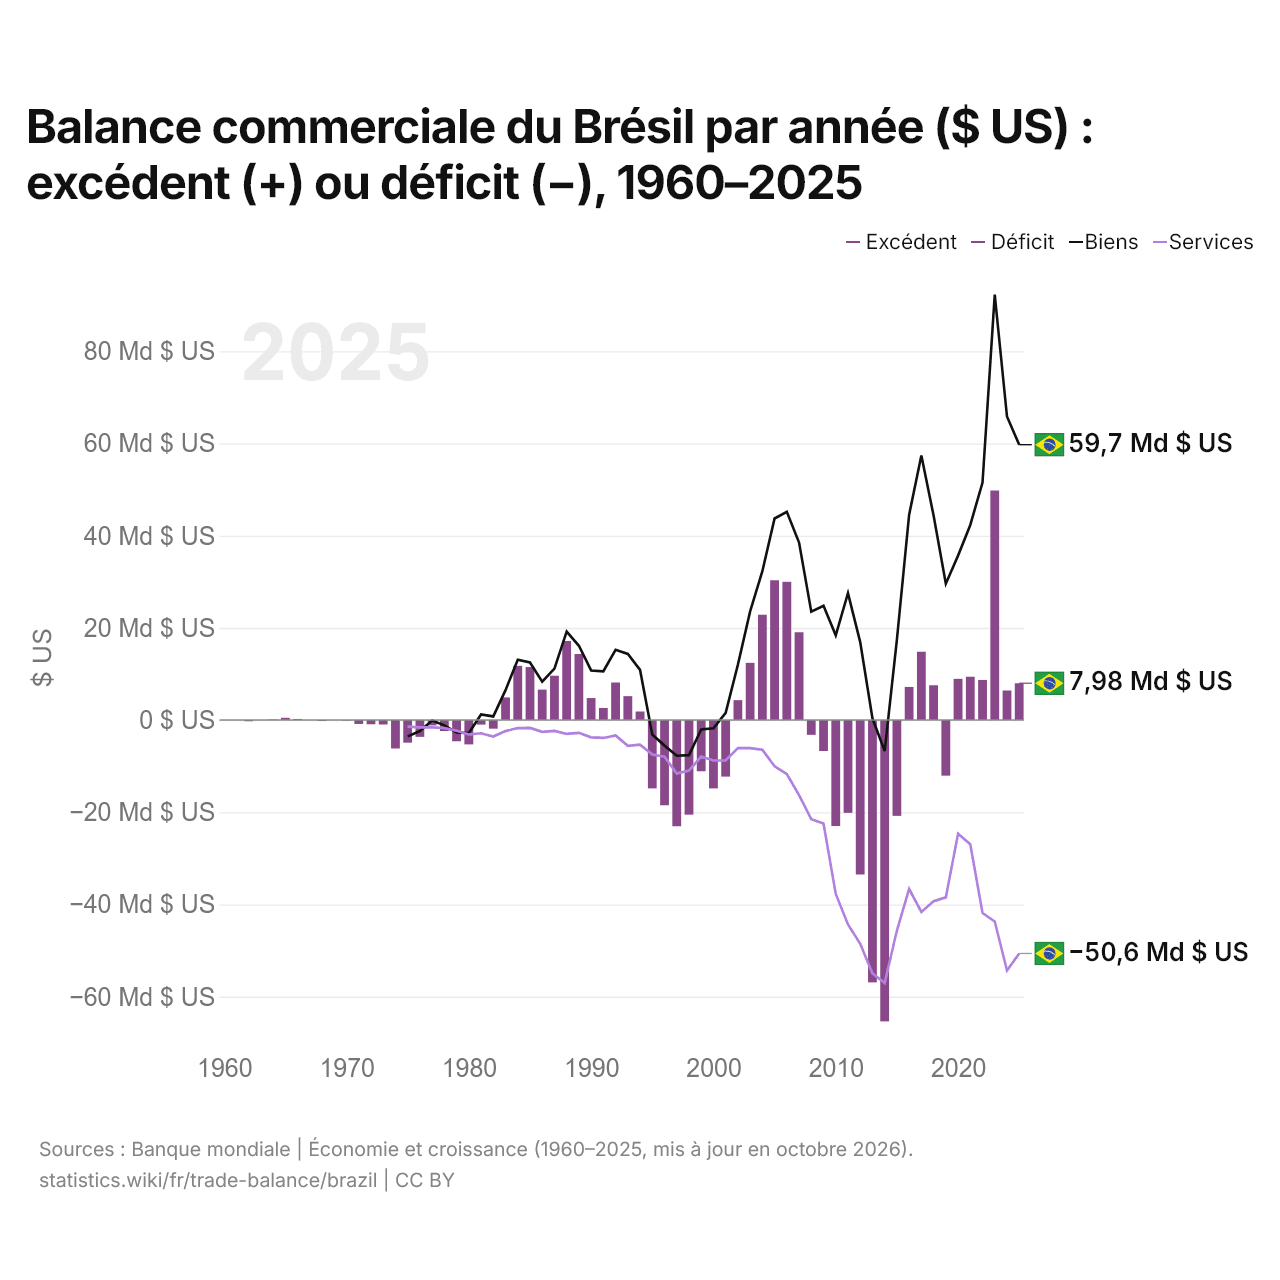
Balance commerciale du Brésil par année ($ US) : excédent (+) ou déficit (−), 1960–2025
| Année | $ US | ||
|---|---|---|---|
| Biens et services | Biens | Services | |
| 2025 | 7 978 888 856 $ US | 59 728 339 667 $ US | −50 642 122 326 $ US |
| 2024 | 6 396 477 783 $ US | 65 842 096 194 $ US | −54 326 735 383 $ US |
| 2023 | 49 791 689 659 $ US | 92 275 370 515 $ US | −43 705 903 286 $ US |
| 2022 | 8 695 119 065 $ US | 51 521 824 602 $ US | −41 878 467 624 $ US |
| 2021 | 9 397 892 444 $ US | 42 312 115 283 $ US | −26 956 995 892 $ US |
| 2020 | 8 930 824 788 $ US | 35 663 589 151 $ US | −24 657 087 772 $ US |
| 2019 | −12 071 834 246 $ US | 29 567 258 998 $ US | −38 480 940 706 $ US |
| 2018 | 7 548 801 626 $ US | 44 348 391 311 $ US | −39 327 650 584 $ US |
| 2017 | 14 820 192 744 $ US | 57 398 844 753 $ US | −41 628 279 011 $ US |
| 2016 | 7 176 956 033 $ US | 44 544 155 351 $ US | −36 655 886 991 $ US |
| 2015 | −20 783 887 933 $ US | 17 444 951 649 $ US | −45 669 878 587 $ US |
| 2014 | −65 368 099 307 $ US | −6 738 943 776 $ US | −57 052 563 726 $ US |
| 2013 | −56 911 843 574 $ US | 368 977 227 $ US | −54 952 339 295 $ US |
| 2012 | −33 507 264 618 $ US | 16 908 389 495 $ US | −48 548 025 300 $ US |
| 2011 | −20 128 178 015 $ US | 27 525 074 203 $ US | −44 354 782 778 $ US |
| 2010 | −22 994 190 062 $ US | 18 357 937 386 $ US | −37 726 844 342 $ US |
| 2009 | −6 721 885 359 $ US | 24 790 315 360 $ US | −22 473 666 194 $ US |
| 2008 | −3 214 805 207 $ US | 23 506 952 459 $ US | −21 526 867 947 $ US |
| 2007 | 19 039 021 642 $ US | 38 498 297 635 $ US | −16 281 043 459 $ US |
| 2006 | 29 982 705 221 $ US | 45 177 703 889 $ US | −11 725 190 066 $ US |
| 2005 | 30 323 248 288 $ US | 43 721 595 990 $ US | −10 047 366 774 $ US |
| 2004 | 22 844 658 798 $ US | 32 283 966 742 $ US | −6 454 455 785 $ US |
| 2003 | 12 399 391 352 $ US | 23 576 298 302 $ US | −6 114 679 696 $ US |
| 2002 | 4 296 672 537 $ US | 12 003 796 576 $ US | −6 082 619 127 $ US |
| 2001 | −12 279 677 754 $ US | 1 536 651 037 $ US | −8 757 084 552 $ US |
| 2000 | −14 837 154 502 $ US | −1 788 777 522 $ US | −8 781 831 088 $ US |
| 1999 | −11 107 588 704 $ US | −2 062 261 046 $ US | −7 929 674 185 $ US |
| 1998 | −20 535 451 010 $ US | −7 627 569 359 $ US | −10 983 176 674 $ US |
| 1997 | −23 042 055 321 $ US | −7 750 633 527 $ US | −11 629 961 172 $ US |
| 1996 | −18 498 238 583 $ US | −5 555 000 000 $ US | −7 957 000 000 $ US |
| 1995 | −14 822 816 229 $ US | −3 157 000 000 $ US | −7 495 000 000 $ US |
| 1994 | 1 846 111 837 $ US | 10 861 000 000 $ US | −5 346 000 000 $ US |
| 1993 | 5 182 689 343 $ US | 14 323 000 000 $ US | −5 584 000 000 $ US |
| 1992 | 8 149 820 789 $ US | 15 239 000 000 $ US | −3 342 000 000 $ US |
| 1991 | 2 614 204 545 $ US | 10 578 000 000 $ US | −3 891 000 000 $ US |
| 1990 | 4 769 166 667 $ US | 10 747 000 000 $ US | −3 761 000 000 $ US |
| 1989 | 14 323 932 823 $ US | 16 112 000 000 $ US | −2 785 000 000 $ US |
| 1988 | 17 141 241 475 $ US | 19 168 000 000 $ US | −3 023 000 000 $ US |
| 1987 | 9 608 553 171 $ US | 11 158 000 000 $ US | −2 364 000 000 $ US |
| 1986 | 6 601 570 908 $ US | 8 304 000 000 $ US | −2 573 000 000 $ US |
| 1985 | 11 487 450 960 $ US | 12 466 000 000 $ US | −1 704 000 000 $ US |
| 1984 | 11 753 827 696 $ US | 13 086 000 000 $ US | −1 749 000 000 $ US |
| 1983 | 4 906 714 630 $ US | 6 469 000 000 $ US | −2 407 000 000 $ US |
| 1982 | −1 872 613 598 $ US | 778 000 000 $ US | −3 588 000 000 $ US |
| 1981 | −999 146 350 $ US | 1 185 000 000 $ US | −2 873 000 000 $ US |
| 1980 | −5 295 341 312 $ US | −2 823 000 000 $ US | −3 134 000 000 $ US |
| 1979 | −4 615 615 400 $ US | −2 717 000 000 $ US | −2 324 000 000 $ US |
| 1978 | −2 387 152 106 $ US | −1 158 000 000 $ US | −1 724 000 000 $ US |
| 1977 | −1 172 207 021 $ US | −100 000 000 $ US | −1 586 000 000 $ US |
| 1976 | −3 659 545 985 $ US | −2 386 000 000 $ US | −1 585 000 000 $ US |
| 1975 | −4 907 560 236 $ US | −3 550 000 000 $ US | −1 444 000 000 $ US |
| 1974 | −6 172 123 572 $ US | - | - |
| 1973 | −975 055 647 $ US | - | - |
| 1972 | −927 784 676 $ US | - | - |
| 1971 | −848 612 874 $ US | - | - |
| 1970 | −177 912 553 $ US | - | - |
| 1969 | 24 981 601 $ US | - | - |
| 1968 | −206 594 912 $ US | - | - |
| 1967 | 0 $ US | - | - |
| 1966 | 225 450 250 $ US | - | - |
| 1965 | 474 987 148 $ US | - | - |
| 1964 | 150 139 739 $ US | - | - |
| 1963 | −17 161 539 $ US | - | - |
| 1962 | −263 069 676 $ US | - | - |
| 1961 | −9 149 903 $ US | - | - |
| 1960 | −8 829 343 $ US | - | - |
En 2025, la balance commerciale du Brésil affichait un excédent de 7,98 milliards de dollars, contre un déficit de 8,83 millions de dollars en 1960. Le plus grand déficit a été de 65,4 milliards de dollars, en 2014, et le plus grand excédent de 49,8 milliards de dollars, en 2023. La balance commerciale du Brésil est excédentaire chaque année depuis 2020.
En 2025, le solde commercial du Brésil était le 3e plus élevé de 26 pays situés en Amérique latine, où les soldes allaient d'un déficit de 24,7 milliards de dollars en Colombie à un excédent de 27,2 milliards de dollars au Pérou. De 2016 à 2025, les soldes commerciaux du Brésil ont totalisé un excédent de 109 milliards de dollars, contre un déficit de 181 milliards de dollars de 2006 à 2015. En 2025, les transactions courantes du Brésil affichaient un déficit de 2,9 % du PIB.
Commerce de biens du Brésil avec ses 10 principaux partenaires commerciaux, selon le Brésil, 2025
| Pays | Exportations vers | Importations depuis | Solde | |
|---|---|---|---|---|
 Chine |
100 Md $US | 70,9 Md $US | +29,1 Md $US | vs Chine |
 États-Unis |
38,0 Md $US | 46,0 Md $US | −7,94 Md $US | vs USA |
 Argentine |
18,1 Md $US | 12,9 Md $US | +5,17 Md $US | vs Argentine |
 Allemagne |
6,53 Md $US | 14,4 Md $US | −7,88 Md $US | vs Allemagne |
 Inde |
6,86 Md $US | 8,35 Md $US | −1,49 Md $US | vs Inde |
 Pays-Bas |
11,7 Md $US | 2,37 Md $US | +9,38 Md $US | |
 Mexique |
7,73 Md $US | 6,22 Md $US | +1,51 Md $US | vs Mexique |
 Espagne |
8,79 Md $US | 3,82 Md $US | +4,97 Md $US | vs Espagne |
 Italie |
5,38 Md $US | 7,07 Md $US | −1,69 Md $US | vs Italie |
 Chili |
7,21 Md $US | 4,63 Md $US | +2,58 Md $US | vs Chili |
Balance commerciale du Brésil : excédent (+) ou déficit (−)
| Biens et services, $ US, 2025 | +7,98 Md $US |
|---|---|
| % du PIB, 2025 | +0,3 % |
| Années d'excédent, 2000–2025 | 15 |
| Biens, $ US, 2025 | +59,7 Md $US |
| Services, $ US, 2025 | −50,6 Md $US |
| Premier excédent en biens, 2025 | Chine +29,1 Md $US |
| Premier déficit en biens, 2025 | États-Unis −7,94 Md $US |
Comparer la balance commerciale du Brésil avec celle d'autres pays
Sources :
- TradeMap (2025, mis à jour en octobre 2026)
- Banque mondiale | Économie et croissance (1960–2025, mis à jour en octobre 2026)
Creative Commons Attribution (CC BY) : vous pouvez copier, partager, adapter et réutiliser ce contenu, y compris à des fins commerciales, à condition de citer statistics.wiki et d’indiquer les modifications apportées. Les sources citées ci-dessus peuvent avoir leurs propres conditions de licence.