
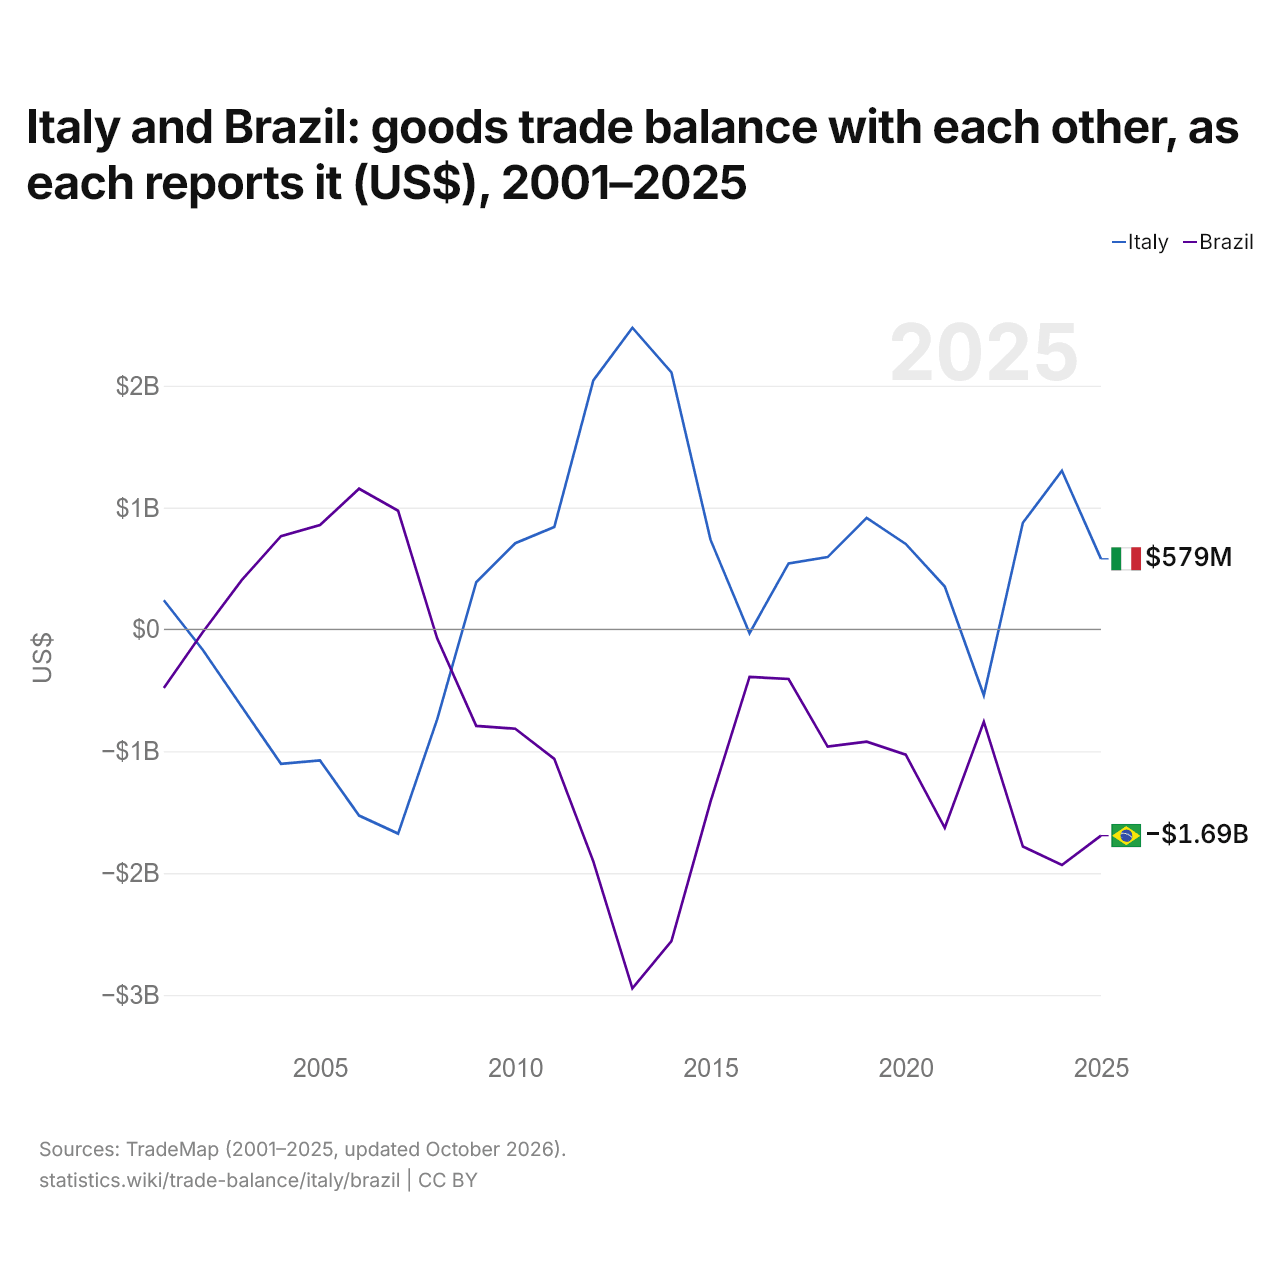
L'Italie et le Brésil : solde de leur commerce de biens bilatéral, selon chacun ($ US), 2001–2025
| Année | $ US | |
|---|---|---|
| Italie | Brésil | |
| 2025 | 579 017 000 $ US | −1 692 682 000 $ US |
| 2024 | 1 302 121 000 $ US | −1 933 877 000 $ US |
| 2023 | 875 335 000 $ US | −1 782 554 000 $ US |
| 2022 | −540 878 000 $ US | −758 481 000 $ US |
| 2021 | 351 903 000 $ US | −1 628 584 000 $ US |
| 2020 | 701 579 000 $ US | −1 028 281 000 $ US |
| 2019 | 915 195 000 $ US | −921 064 000 $ US |
| 2018 | 593 411 000 $ US | −962 360 000 $ US |
| 2017 | 542 049 000 $ US | −406 616 000 $ US |
| 2016 | −31 256 000 $ US | −390 188 000 $ US |
| 2015 | 736 641 000 $ US | −1 414 644 000 $ US |
| 2014 | 2 109 936 000 $ US | −2 558 537 000 $ US |
| 2013 | 2 476 371 000 $ US | −2 945 744 000 $ US |
| 2012 | 2 043 614 000 $ US | −1 905 298 000 $ US |
| 2011 | 840 146 000 $ US | −1 062 205 000 $ US |
| 2010 | 707 602 000 $ US | −815 228 000 $ US |
| 2009 | 387 138 000 $ US | −792 261 000 $ US |
| 2008 | −738 652 000 $ US | −73 315 000 $ US |
| 2007 | −1 675 888 000 $ US | 973 817 000 $ US |
| 2006 | −1 527 902 000 $ US | 1 154 856 000 $ US |
| 2005 | −1 075 482 000 $ US | 856 140 000 $ US |
| 2004 | −1 103 522 000 $ US | 765 220 000 $ US |
| 2003 | −637 496 000 $ US | 406 381 000 $ US |
| 2002 | −168 857 000 $ US | −21 598 000 $ US |
| 2001 | 239 361 000 $ US | −481 648 000 $ US |
En 2025, selon l'Italie, son commerce de biens avec le Brésil affichait un excédent de 579 millions de dollars ; selon le Brésil, son commerce de biens avec l'Italie affichait un déficit de 1,69 milliard de dollars. En 2001, les chiffres étaient un excédent de 239 millions de dollars pour l'Italie et un déficit de 482 millions de dollars pour le Brésil.
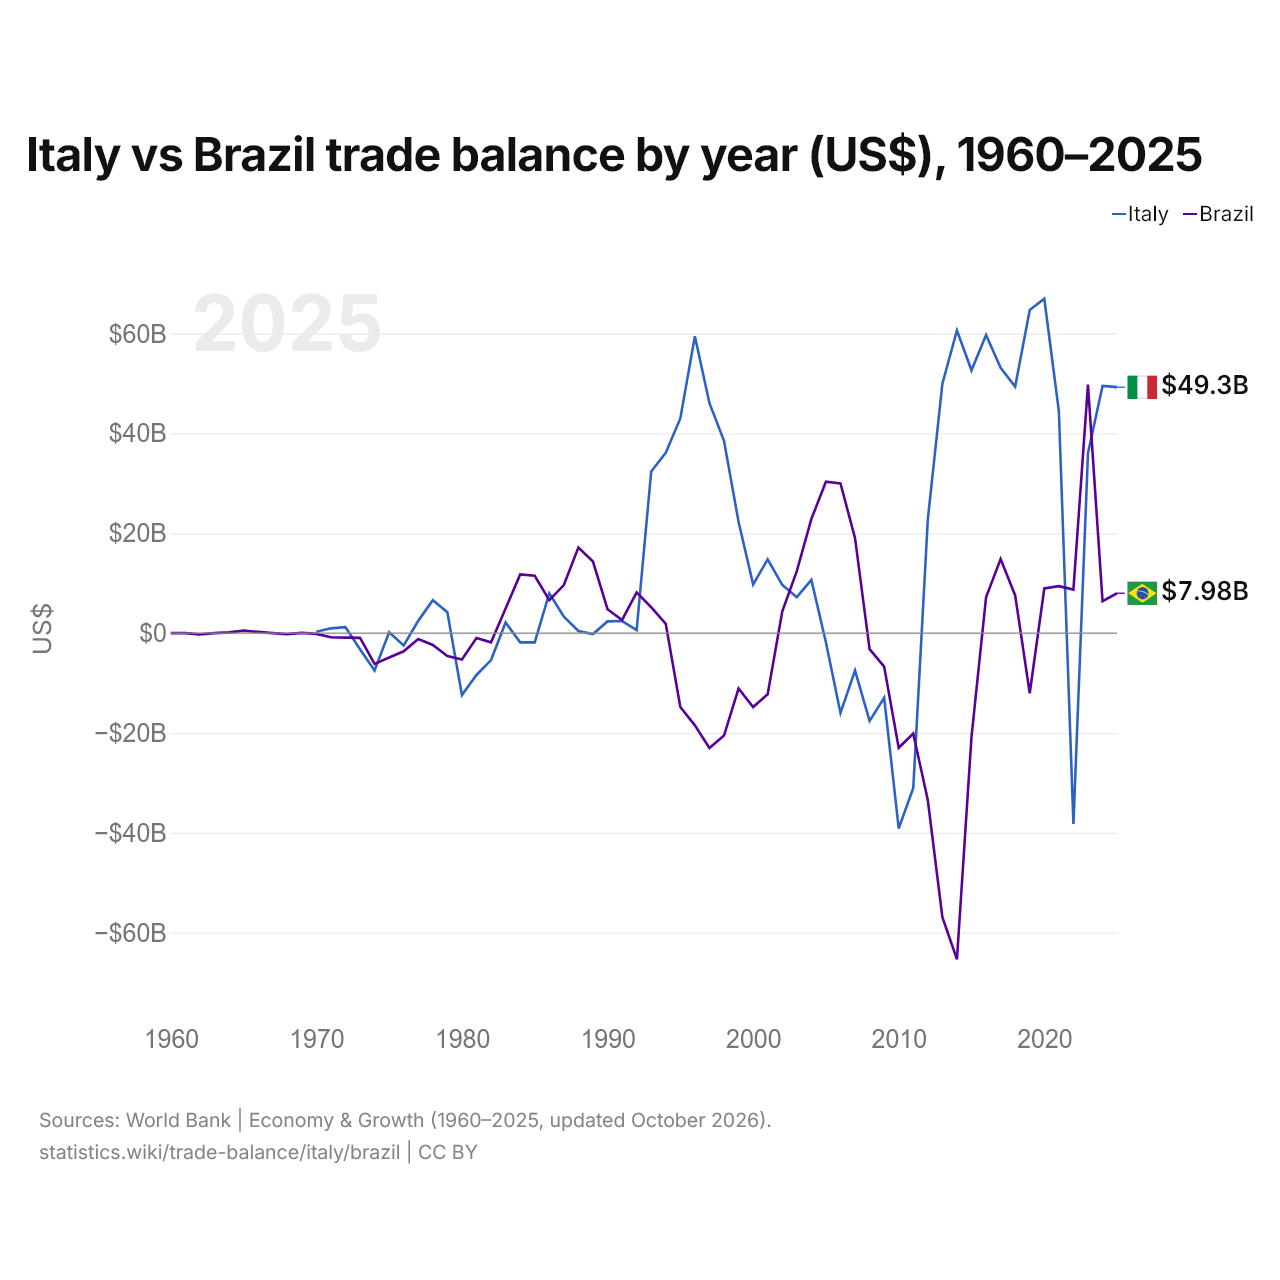
Italie vs Brésil : balance commerciale par année ($ US), 1960–2025
| Année | $ US | |
|---|---|---|
 Italie |
 Brésil |
|
| 2025 | 49 265 795 806 $ US | 7 978 888 856 $ US |
| 2024 | 49 516 416 970 $ US | 6 396 477 783 $ US |
| 2023 | 36 048 306 644 $ US | 49 791 689 659 $ US |
| 2022 | −38 256 625 194 $ US | 8 695 119 065 $ US |
| 2021 | 44 482 863 062 $ US | 9 397 892 444 $ US |
| 2020 | 66 995 055 892 $ US | 8 930 824 788 $ US |
| 2019 | 64 739 658 692 $ US | −12 071 834 246 $ US |
| 2018 | 49 379 369 014 $ US | 7 548 801 626 $ US |
| 2017 | 53 145 963 915 $ US | 14 820 192 744 $ US |
| 2016 | 59 733 694 414 $ US | 7 176 956 033 $ US |
| 2015 | 52 641 504 803 $ US | −20 783 887 933 $ US |
| 2014 | 60 639 816 850 $ US | −65 368 099 307 $ US |
| 2013 | 49 969 909 978 $ US | −56 911 843 574 $ US |
| 2012 | 22 780 973 378 $ US | −33 507 264 618 $ US |
| 2011 | −31 057 444 799 $ US | −20 128 178 015 $ US |
| 2010 | −39 140 989 153 $ US | −22 994 190 062 $ US |
| 2009 | −12 973 150 262 $ US | −6 721 885 359 $ US |
| 2008 | −17 617 150 231 $ US | −3 214 805 207 $ US |
| 2007 | −7 510 630 798 $ US | 19 039 021 642 $ US |
| 2006 | −16 009 638 359 $ US | 29 982 705 221 $ US |
| 2005 | −1 836 401 651 $ US | 30 323 248 288 $ US |
| 2004 | 10 646 435 538 $ US | 22 844 658 798 $ US |
| 2003 | 7 186 714 436 $ US | 12 399 391 352 $ US |
| 2002 | 9 665 276 392 $ US | 4 296 672 537 $ US |
| 2001 | 14 754 690 400 $ US | −12 279 677 754 $ US |
| 2000 | 9 745 220 727 $ US | −14 837 154 502 $ US |
| 1999 | 22 302 224 793 $ US | −11 107 588 704 $ US |
| 1998 | 38 522 694 324 $ US | −20 535 451 010 $ US |
| 1997 | 46 087 198 727 $ US | −23 042 055 321 $ US |
| 1996 | 59 461 538 462 $ US | −18 498 238 583 $ US |
| 1995 | 42 997 622 727 $ US | −14 822 816 229 $ US |
| 1994 | 36 132 880 644 $ US | 1 846 111 837 $ US |
| 1993 | 32 363 681 555 $ US | 5 182 689 343 $ US |
| 1992 | 589 693 637 $ US | 8 149 820 789 $ US |
| 1991 | 2 412 450 445 $ US | 2 614 204 545 $ US |
| 1990 | 2 328 492 243 $ US | 4 769 166 667 $ US |
| 1989 | −180 646 345 $ US | 14 323 932 823 $ US |
| 1988 | 400 105 623 $ US | 17 141 241 475 $ US |
| 1987 | 3 267 109 352 $ US | 9 608 553 171 $ US |
| 1986 | 7 969 577 867 $ US | 6 601 570 908 $ US |
| 1985 | −1 862 996 653 $ US | 11 487 450 960 $ US |
| 1984 | −1 867 307 692 $ US | 11 753 827 696 $ US |
| 1983 | 2 109 484 957 $ US | 4 906 714 630 $ US |
| 1982 | −5 419 292 770 $ US | −1 872 613 598 $ US |
| 1981 | −8 404 464 316 $ US | −999 146 350 $ US |
| 1980 | −12 410 859 145 $ US | −5 295 341 312 $ US |
| 1979 | 4 173 132 137 $ US | −4 615 615 400 $ US |
| 1978 | 6 582 594 114 $ US | −2 387 152 106 $ US |
| 1977 | 2 446 631 556 $ US | −1 172 207 021 $ US |
| 1976 | −2 478 057 688 $ US | −3 659 545 985 $ US |
| 1975 | 145 868 921 $ US | −4 907 560 236 $ US |
| 1974 | −7 493 364 096 $ US | −6 172 123 572 $ US |
| 1973 | −3 253 224 842 $ US | −975 055 647 $ US |
| 1972 | 1 168 247 012 $ US | −927 784 676 $ US |
| 1971 | 952 521 848 $ US | −848 612 874 $ US |
| 1970 | 258 798 017 $ US | −177 912 553 $ US |
| 1969 | - | 24 981 601 $ US |
| 1968 | - | −206 594 912 $ US |
| 1967 | - | 0 $ US |
| 1966 | - | 225 450 250 $ US |
| 1965 | - | 474 987 148 $ US |
| 1964 | - | 150 139 739 $ US |
| 1963 | - | −17 161 539 $ US |
| 1962 | - | −263 069 676 $ US |
| 1961 | - | −9 149 903 $ US |
| 1960 | - | −8 829 343 $ US |
En 2025, la balance commerciale de l'Italie affichait un excédent de 49,3 milliards de dollars et celle du Brésil un excédent de 7,98 milliards de dollars ; l'excédent de l'Italie était 6,2 fois plus grand. En 1970, la balance commerciale de l'Italie affichait un excédent de 259 millions de dollars et celle du Brésil un déficit de 178 millions de dollars.
De 1970 à 2025, la balance commerciale de l'Italie a été excédentaire pendant 39 des 56 années, et celle du Brésil pendant 27. Les balances commerciales de l'Italie et du Brésil ont été déficitaires en même temps pendant 10 de ces années, la dernière fois en 2011.
Italie vs Brésil : chiffres de la balance commerciale
|
Italie
|
Brésil
|
|
|---|---|---|
| Biens et services, $ US | +49,3 Md $US (2025) | +7,98 Md $US (2025) |
| % du PIB | +1,9 % (2025) | +0,3 % (2025) |
| Années d'excédent depuis 2000 | 18 sur 26 | 15 sur 26 |
| Solde des biens entre les deux, chiffres propres | +579 M $US (2025) | −1,69 Md $US (2025) |
| Premier excédent en biens avec | États-Unis (+38,7 Md $US, 2025) | Chine (+29,1 Md $US, 2025) |
| Premier déficit en biens avec | Chine (−52,3 Md $US, 2025) | États-Unis (−7,94 Md $US, 2025) |
Comparer la balance commerciale de 2 pays au choix
Sources :
- Banque mondiale | Économie et croissance (1960–2025, mis à jour en octobre 2026)
- TradeMap (2001–2025, mis à jour en octobre 2026)
Creative Commons Attribution (CC BY) : vous pouvez copier, partager, adapter et réutiliser ce contenu, y compris à des fins commerciales, à condition de citer statistics.wiki et d’indiquer les modifications apportées. Les sources citées ci-dessus peuvent avoir leurs propres conditions de licence.