
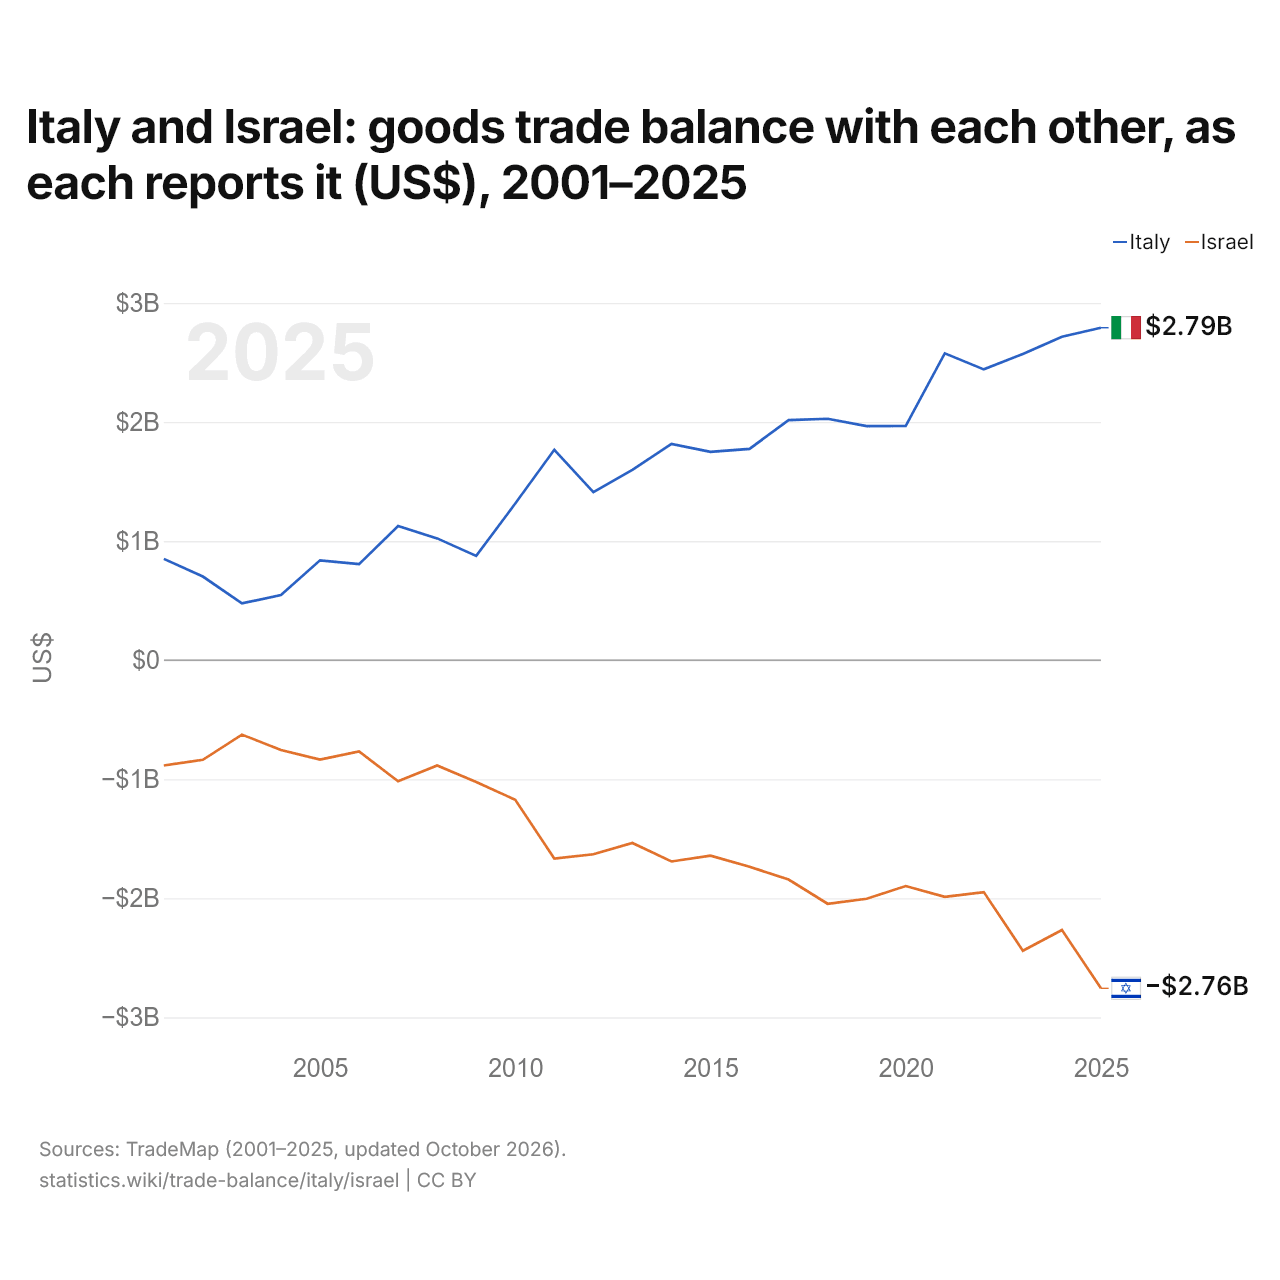
L'Italie et Israël : solde de leur commerce de biens bilatéral, selon chacun ($ US), 2001–2025
| Année | $ US | |
|---|---|---|
| Italie | Israël | |
| 2025 | 2 791 854 000 $ US | −2 756 107 000 $ US |
| 2024 | 2 716 488 000 $ US | −2 267 046 000 $ US |
| 2023 | 2 571 214 000 $ US | −2 440 949 000 $ US |
| 2022 | 2 441 877 000 $ US | −1 947 882 000 $ US |
| 2021 | 2 576 457 000 $ US | −1 988 463 000 $ US |
| 2020 | 1 966 591 000 $ US | −1 897 421 000 $ US |
| 2019 | 1 965 183 000 $ US | −2 004 429 000 $ US |
| 2018 | 2 027 198 000 $ US | −2 046 064 000 $ US |
| 2017 | 2 015 380 000 $ US | −1 842 631 000 $ US |
| 2016 | 1 774 127 000 $ US | −1 735 453 000 $ US |
| 2015 | 1 748 775 000 $ US | −1 641 781 000 $ US |
| 2014 | 1 815 589 000 $ US | −1 690 728 000 $ US |
| 2013 | 1 597 234 000 $ US | −1 535 299 000 $ US |
| 2012 | 1 411 151 000 $ US | −1 629 909 000 $ US |
| 2011 | 1 766 375 000 $ US | −1 666 277 000 $ US |
| 2010 | 1 315 259 000 $ US | −1 172 689 000 $ US |
| 2009 | 875 202 000 $ US | −1 023 111 000 $ US |
| 2008 | 1 022 342 000 $ US | −885 137 000 $ US |
| 2007 | 1 126 842 000 $ US | −1 017 594 000 $ US |
| 2006 | 805 898 000 $ US | −766 892 000 $ US |
| 2005 | 838 376 000 $ US | −835 968 000 $ US |
| 2004 | 546 436 000 $ US | −755 448 000 $ US |
| 2003 | 476 619 000 $ US | −625 650 000 $ US |
| 2002 | 702 177 000 $ US | −837 062 000 $ US |
| 2001 | 850 471 000 $ US | −884 661 000 $ US |
En 2025, selon l'Italie, son commerce de biens avec Israël affichait un excédent de 2,79 milliards de dollars ; selon Israël, son commerce de biens avec l'Italie affichait un déficit de 2,76 milliards de dollars. En 2001, les chiffres étaient un excédent de 850 millions de dollars pour l'Italie et un déficit de 885 millions de dollars pour Israël.
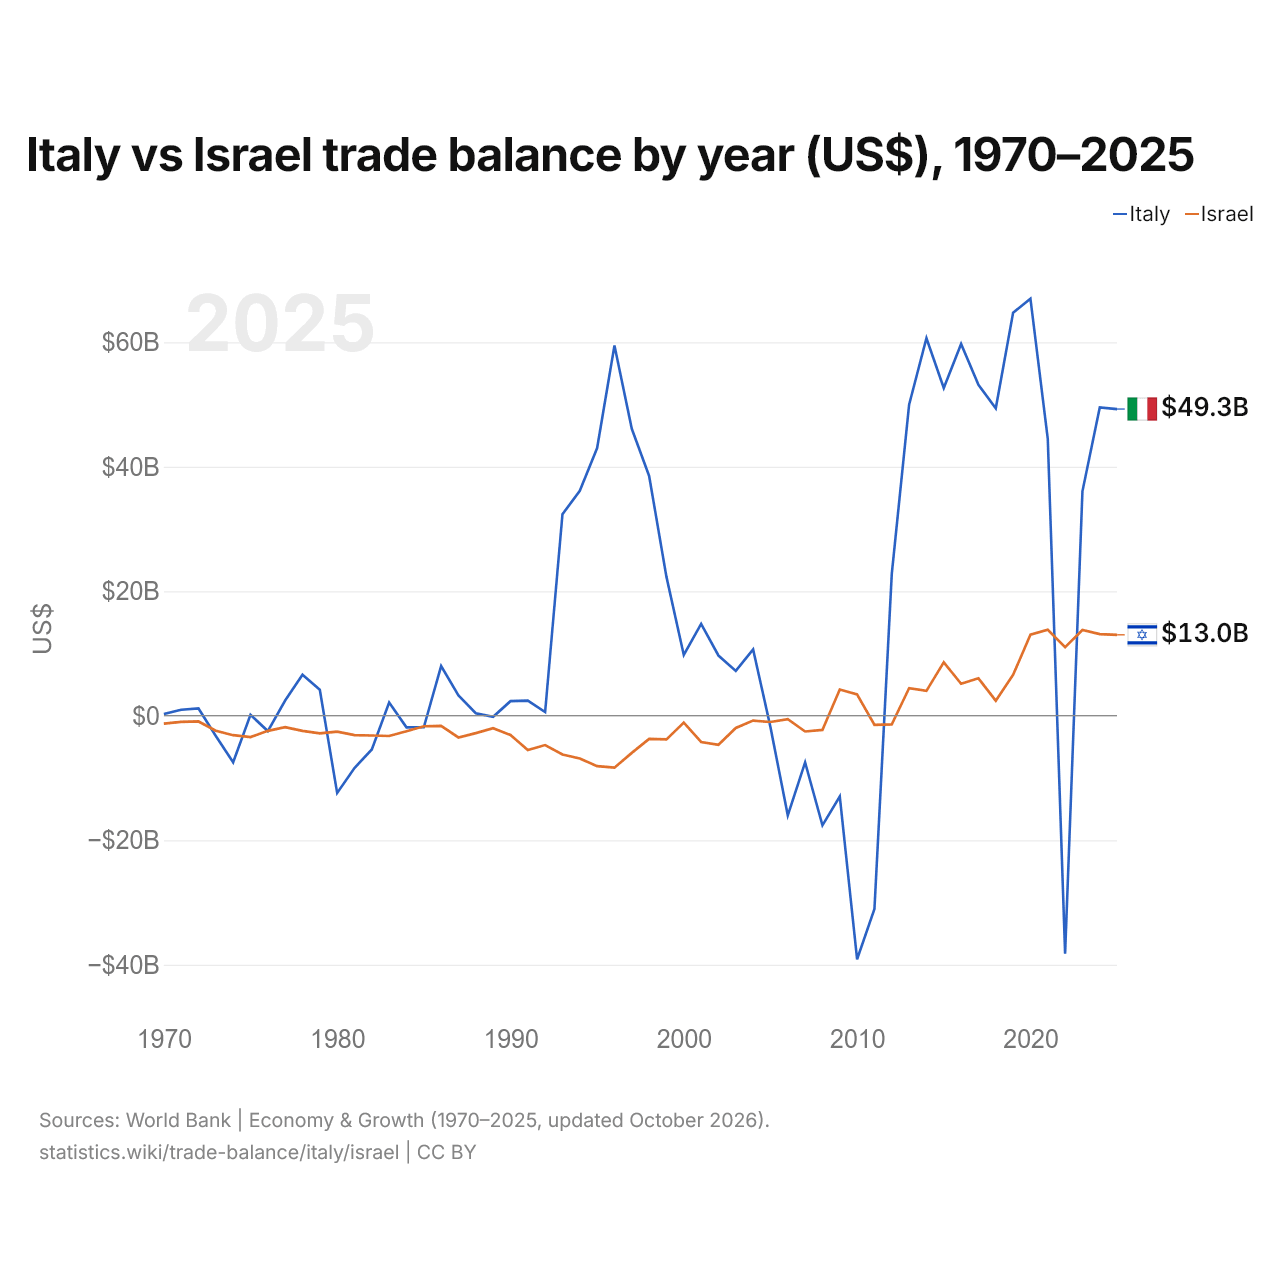
Italie vs Israël : balance commerciale par année ($ US), 1970–2025
| Année | $ US | |
|---|---|---|
 Italie |
 Israël |
|
| 2025 | 49 265 795 806 $ US | 12 994 365 505 $ US |
| 2024 | 49 516 416 970 $ US | 13 100 279 099 $ US |
| 2023 | 36 048 306 644 $ US | 13 754 663 733 $ US |
| 2022 | −38 256 625 194 $ US | 11 000 808 302 $ US |
| 2021 | 44 482 863 062 $ US | 13 804 496 055 $ US |
| 2020 | 66 995 055 892 $ US | 13 021 165 408 $ US |
| 2019 | 64 739 658 692 $ US | 6 557 503 906 $ US |
| 2018 | 49 379 369 014 $ US | 2 413 018 727 $ US |
| 2017 | 53 145 963 915 $ US | 6 004 796 901 $ US |
| 2016 | 59 733 694 414 $ US | 5 128 475 225 $ US |
| 2015 | 52 641 504 803 $ US | 8 575 319 326 $ US |
| 2014 | 60 639 816 850 $ US | 3 984 226 053 $ US |
| 2013 | 49 969 909 978 $ US | 4 406 103 796 $ US |
| 2012 | 22 780 973 378 $ US | −1 392 248 402 $ US |
| 2011 | −31 057 444 799 $ US | −1 462 187 515 $ US |
| 2010 | −39 140 989 153 $ US | 3 412 251 219 $ US |
| 2009 | −12 973 150 262 $ US | 4 198 677 110 $ US |
| 2008 | −17 617 150 231 $ US | −2 287 048 495 $ US |
| 2007 | −7 510 630 798 $ US | −2 539 773 861 $ US |
| 2006 | −16 009 638 359 $ US | −575 153 283 $ US |
| 2005 | −1 836 401 651 $ US | −1 009 500 635 $ US |
| 2004 | 10 646 435 538 $ US | −793 186 301 $ US |
| 2003 | 7 186 714 436 $ US | −1 975 804 879 $ US |
| 2002 | 9 665 276 392 $ US | −4 669 753 894 $ US |
| 2001 | 14 754 690 400 $ US | −4 222 578 168 $ US |
| 2000 | 9 745 220 727 $ US | −1 098 518 628 $ US |
| 1999 | 22 302 224 793 $ US | −3 810 722 999 $ US |
| 1998 | 38 522 694 324 $ US | −3 730 624 984 $ US |
| 1997 | 46 087 198 727 $ US | −5 975 502 116 $ US |
| 1996 | 59 461 538 462 $ US | −8 351 877 056 $ US |
| 1995 | 42 997 622 727 $ US | −8 115 948 262 $ US |
| 1994 | 36 132 880 644 $ US | −6 867 235 894 $ US |
| 1993 | 32 363 681 555 $ US | −6 232 770 220 $ US |
| 1992 | 589 693 637 $ US | −4 720 523 362 $ US |
| 1991 | 2 412 450 445 $ US | −5 509 077 267 $ US |
| 1990 | 2 328 492 243 $ US | −3 103 552 723 $ US |
| 1989 | −180 646 345 $ US | −2 010 870 382 $ US |
| 1988 | 400 105 623 $ US | −2 800 375 258 $ US |
| 1987 | 3 267 109 352 $ US | −3 498 185 125 $ US |
| 1986 | 7 969 577 867 $ US | −1 649 481 113 $ US |
| 1985 | −1 862 996 653 $ US | −1 698 280 601 $ US |
| 1984 | −1 867 307 692 $ US | −2 488 666 439 $ US |
| 1983 | 2 109 484 957 $ US | −3 259 483 986 $ US |
| 1982 | −5 419 292 770 $ US | −3 188 683 128 $ US |
| 1981 | −8 404 464 316 $ US | −3 131 228 070 $ US |
| 1980 | −12 410 859 145 $ US | −2 559 607 843 $ US |
| 1979 | 4 173 132 137 $ US | −2 851 200 000 $ US |
| 1978 | 6 582 594 114 $ US | −2 447 647 059 $ US |
| 1977 | 2 446 631 556 $ US | −1 834 000 000 $ US |
| 1976 | −2 478 057 688 $ US | −2 433 750 000 $ US |
| 1975 | 145 868 921 $ US | −3 438 333 333 $ US |
| 1974 | −7 493 364 096 $ US | −3 132 500 000 $ US |
| 1973 | −3 253 224 842 $ US | −2 412 500 000 $ US |
| 1972 | 1 168 247 012 $ US | −925 000 000 $ US |
| 1971 | 952 521 848 $ US | −1 000 000 000 $ US |
| 1970 | 258 798 017 $ US | −1 283 333 333 $ US |
En 2025, la balance commerciale de l'Italie affichait un excédent de 49,3 milliards de dollars et celle d'Israël un excédent de 13 milliards de dollars ; l'excédent de l'Italie était 3,8 fois plus grand. En 1970, la balance commerciale de l'Italie affichait un excédent de 259 millions de dollars et celle d'Israël un déficit de 1,28 milliard de dollars.
De 1970 à 2025, la balance commerciale de l'Italie a été excédentaire pendant 39 des 56 années, et celle d'Israël pendant 15. Les balances commerciales de l'Italie et d'Israël ont été déficitaires en même temps pendant 14 de ces années, la dernière fois en 2011.
Italie vs Israël : chiffres de la balance commerciale
|
Italie
|
Israël
|
|
|---|---|---|
| Biens et services, $ US | +49,3 Md $US (2025) | +13,0 Md $US (2025) |
| % du PIB | +1,9 % (2025) | +2,1 % (2025) |
| Années d'excédent depuis 2000 | 18 sur 26 | 15 sur 26 |
| Solde des biens entre les deux, chiffres propres | +2,79 Md $US (2025) | −2,76 Md $US (2025) |
| Premier excédent en biens avec | États-Unis (+38,7 Md $US, 2025) | États-Unis (+6,12 Md $US, 2025) |
| Premier déficit en biens avec | Chine (−52,3 Md $US, 2025) | Chine (−18,0 Md $US, 2025) |
Comparer la balance commerciale de 2 pays au choix
Sources :
- Banque mondiale | Économie et croissance (1970–2025, mis à jour en octobre 2026)
- TradeMap (2001–2025, mis à jour en octobre 2026)
Creative Commons Attribution (CC BY) : vous pouvez copier, partager, adapter et réutiliser ce contenu, y compris à des fins commerciales, à condition de citer statistics.wiki et d’indiquer les modifications apportées. Les sources citées ci-dessus peuvent avoir leurs propres conditions de licence.