
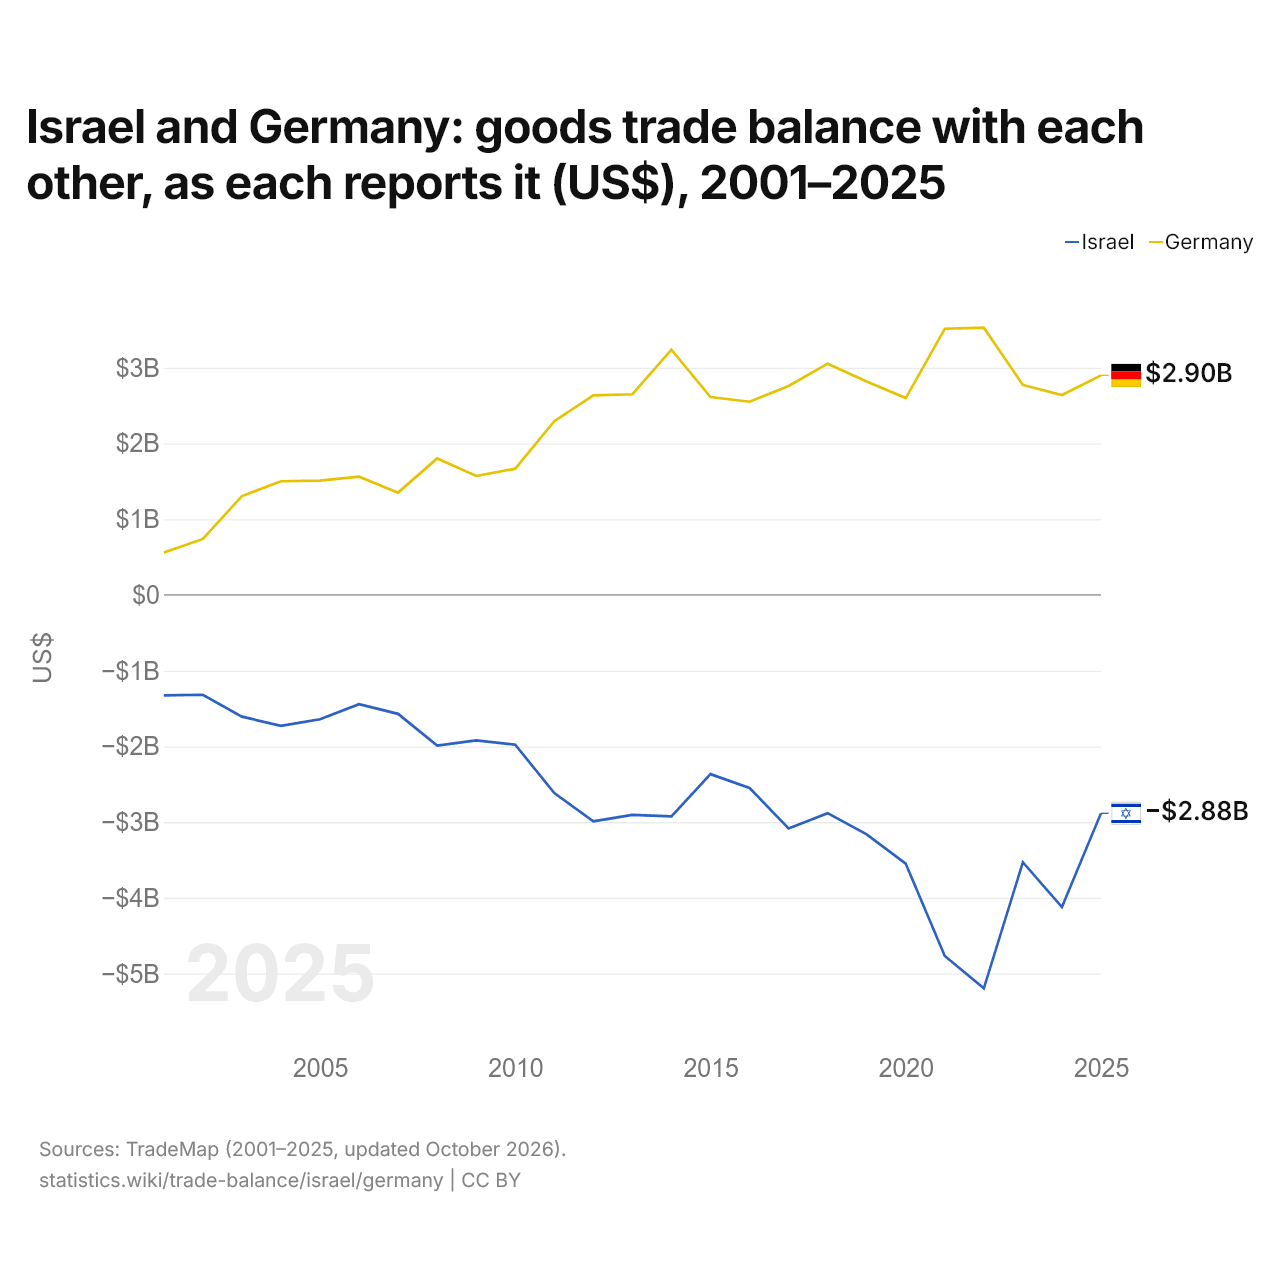
Israël et l'Allemagne : solde de leur commerce de biens bilatéral, selon chacun ($ US), 2001–2025
| Année | $ US | |
|---|---|---|
| Israël | Allemagne | |
| 2025 | −2 884 347 000 $ US | 2 900 158 000 $ US |
| 2024 | −4 121 647 000 $ US | 2 640 532 000 $ US |
| 2023 | −3 530 006 000 $ US | 2 773 475 000 $ US |
| 2022 | −5 195 072 000 $ US | 3 529 437 000 $ US |
| 2021 | −4 768 154 000 $ US | 3 515 134 000 $ US |
| 2020 | −3 548 932 000 $ US | 2 599 643 000 $ US |
| 2019 | −3 161 511 000 $ US | 2 817 713 000 $ US |
| 2018 | −2 882 059 000 $ US | 3 054 193 000 $ US |
| 2017 | −3 083 217 000 $ US | 2 759 684 000 $ US |
| 2016 | −2 549 859 000 $ US | 2 552 013 000 $ US |
| 2015 | −2 366 482 000 $ US | 2 613 858 000 $ US |
| 2014 | −2 924 416 000 $ US | 3 239 321 000 $ US |
| 2013 | −2 904 142 000 $ US | 2 650 280 000 $ US |
| 2012 | −2 990 071 000 $ US | 2 635 455 000 $ US |
| 2011 | −2 617 287 000 $ US | 2 295 216 000 $ US |
| 2010 | −1 977 671 000 $ US | 1 667 598 000 $ US |
| 2009 | −1 921 126 000 $ US | 1 570 955 000 $ US |
| 2008 | −1 989 844 000 $ US | 1 802 977 000 $ US |
| 2007 | −1 570 293 000 $ US | 1 351 176 000 $ US |
| 2006 | −1 443 499 000 $ US | 1 562 116 000 $ US |
| 2005 | −1 641 090 000 $ US | 1 509 039 000 $ US |
| 2004 | −1 729 229 000 $ US | 1 501 470 000 $ US |
| 2003 | −1 607 496 000 $ US | 1 305 359 000 $ US |
| 2002 | −1 317 895 000 $ US | 739 493 000 $ US |
| 2001 | −1 326 924 000 $ US | 560 940 000 $ US |
En 2025, selon Israël, son commerce de biens avec l'Allemagne affichait un déficit de 2,88 milliards de dollars ; selon l'Allemagne, son commerce de biens avec Israël affichait un excédent de 2,9 milliards de dollars. En 2001, les chiffres étaient un déficit de 1,33 milliard de dollars pour Israël et un excédent de 561 millions de dollars pour l'Allemagne.
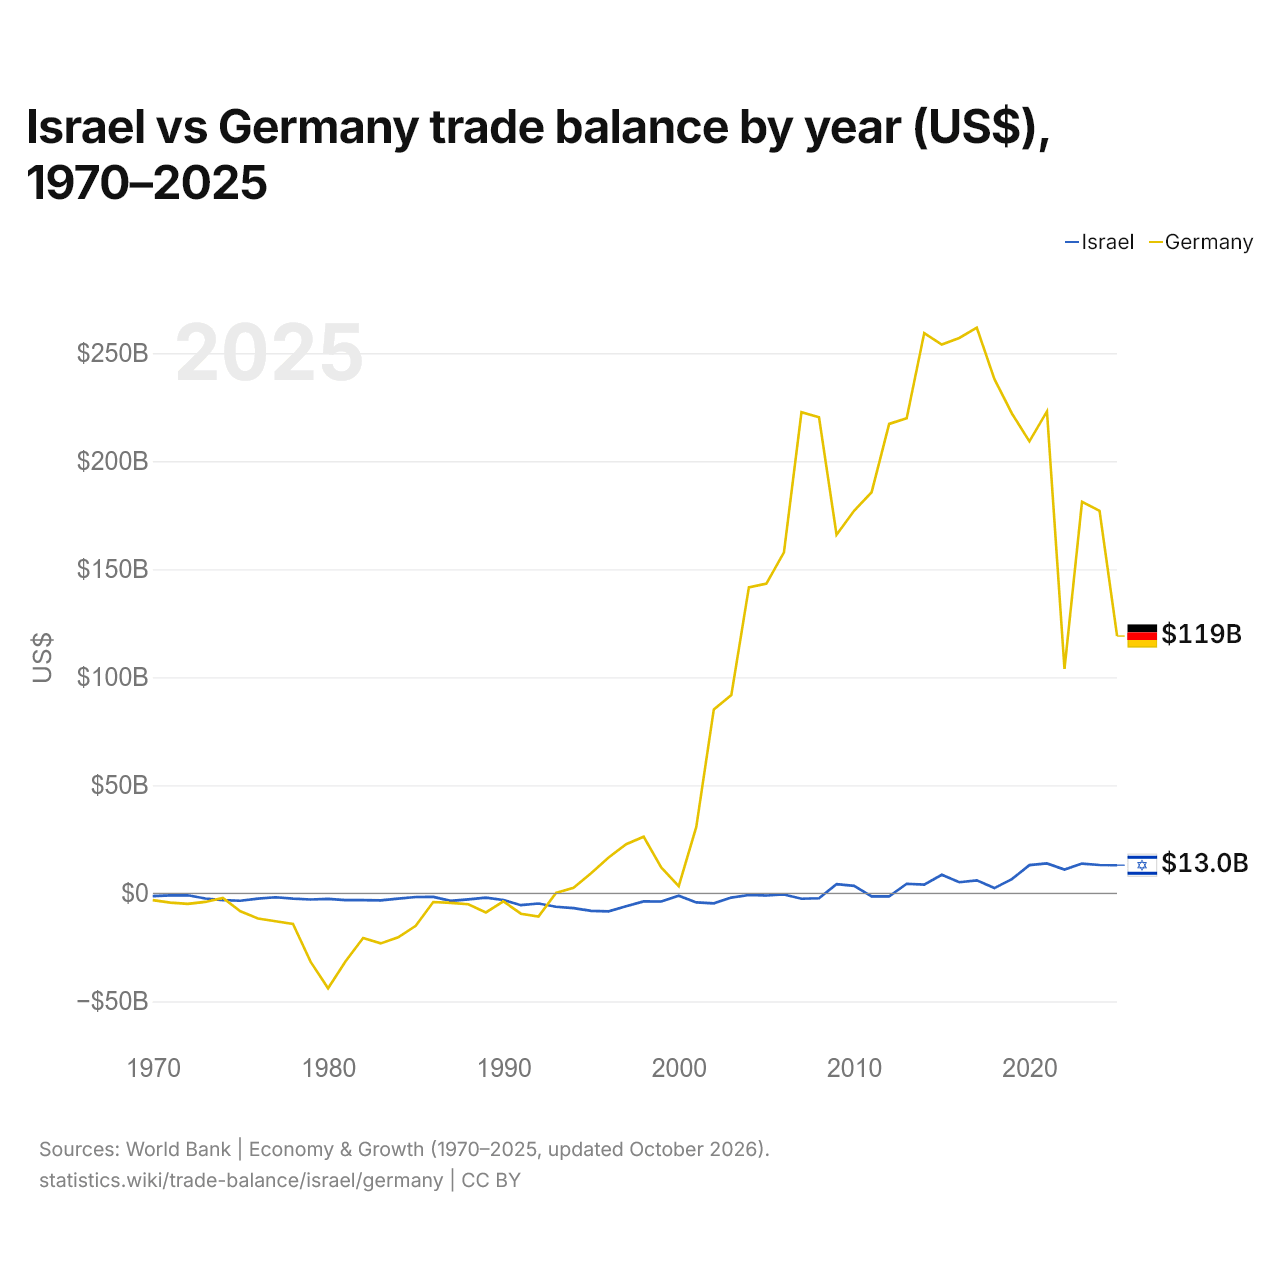
Israël vs Allemagne : balance commerciale par année ($ US), 1970–2025
| Année | $ US | |
|---|---|---|
 Israël |
 Allemagne |
|
| 2025 | 12 994 365 505 $ US | 119 036 943 611 $ US |
| 2024 | 13 100 279 099 $ US | 176 993 019 011 $ US |
| 2023 | 13 754 663 733 $ US | 181 209 809 275 $ US |
| 2022 | 11 000 808 302 $ US | 103 809 534 747 $ US |
| 2021 | 13 804 496 055 $ US | 222 995 040 802 $ US |
| 2020 | 13 021 165 408 $ US | 209 133 823 156 $ US |
| 2019 | 6 557 503 906 $ US | 222 041 052 173 $ US |
| 2018 | 2 413 018 727 $ US | 237 995 400 452 $ US |
| 2017 | 6 004 796 901 $ US | 261 732 442 733 $ US |
| 2016 | 5 128 475 225 $ US | 256 950 954 099 $ US |
| 2015 | 8 575 319 326 $ US | 253 944 200 893 $ US |
| 2014 | 3 984 226 053 $ US | 259 262 242 062 $ US |
| 2013 | 4 406 103 796 $ US | 219 838 066 559 $ US |
| 2012 | −1 392 248 402 $ US | 217 210 227 233 $ US |
| 2011 | −1 462 187 515 $ US | 185 606 097 335 $ US |
| 2010 | 3 412 251 219 $ US | 177 011 015 050 $ US |
| 2009 | 4 198 677 110 $ US | 165 923 316 906 $ US |
| 2008 | −2 287 048 495 $ US | 220 288 283 354 $ US |
| 2007 | −2 539 773 861 $ US | 222 623 193 646 $ US |
| 2006 | −575 153 283 $ US | 157 789 848 554 $ US |
| 2005 | −1 009 500 635 $ US | 143 315 467 107 $ US |
| 2004 | −793 186 301 $ US | 141 587 181 187 $ US |
| 2003 | −1 975 804 879 $ US | 91 785 747 701 $ US |
| 2002 | −4 669 753 894 $ US | 85 110 145 458 $ US |
| 2001 | −4 222 578 168 $ US | 30 705 762 723 $ US |
| 2000 | −1 098 518 628 $ US | 3 259 428 685 $ US |
| 1999 | −3 810 722 999 $ US | 11 966 537 957 $ US |
| 1998 | −3 730 624 984 $ US | 26 183 172 169 $ US |
| 1997 | −5 975 502 116 $ US | 22 686 668 171 $ US |
| 1996 | −8 351 877 056 $ US | 16 562 256 304 $ US |
| 1995 | −8 115 948 262 $ US | 9 254 810 973 $ US |
| 1994 | −6 867 235 894 $ US | 2 562 371 942 $ US |
| 1993 | −6 232 770 220 $ US | 179 817 816 $ US |
| 1992 | −4 720 523 362 $ US | −10 812 773 951 $ US |
| 1991 | −5 509 077 267 $ US | −9 442 545 669 $ US |
| 1990 | −3 103 552 723 $ US | −3 700 909 091 $ US |
| 1989 | −2 010 870 382 $ US | −8 860 353 688 $ US |
| 1988 | −2 800 375 258 $ US | −5 073 354 494 $ US |
| 1987 | −3 498 185 125 $ US | −4 398 411 317 $ US |
| 1986 | −1 649 481 113 $ US | −4 040 852 923 $ US |
| 1985 | −1 698 280 601 $ US | −15 052 044 247 $ US |
| 1984 | −2 488 666 439 $ US | −20 362 746 203 $ US |
| 1983 | −3 259 483 986 $ US | −23 185 607 813 $ US |
| 1982 | −3 188 683 128 $ US | −20 687 120 174 $ US |
| 1981 | −3 131 228 070 $ US | −31 452 268 282 $ US |
| 1980 | −2 559 607 843 $ US | −43 964 356 574 $ US |
| 1979 | −2 851 200 000 $ US | −31 634 161 776 $ US |
| 1978 | −2 447 647 059 $ US | −14 221 404 090 $ US |
| 1977 | −1 834 000 000 $ US | −12 957 768 887 $ US |
| 1976 | −2 433 750 000 $ US | −11 645 608 203 $ US |
| 1975 | −3 438 333 333 $ US | −8 334 008 268 $ US |
| 1974 | −3 132 500 000 $ US | −2 193 463 835 $ US |
| 1973 | −2 412 500 000 $ US | −4 000 794 731 $ US |
| 1972 | −925 000 000 $ US | −4 909 821 505 $ US |
| 1971 | −1 000 000 000 $ US | −4 336 130 597 $ US |
| 1970 | −1 283 333 333 $ US | −3 162 513 226 $ US |
En 2025, la balance commerciale d'Israël affichait un excédent de 13 milliards de dollars et celle de l'Allemagne un excédent de 119 milliards de dollars ; l'excédent de l'Allemagne était 9,2 fois plus grand. En 1970, la balance commerciale d'Israël affichait un déficit de 1,28 milliard de dollars et celle de l'Allemagne un déficit de 3,16 milliards de dollars.
De 1970 à 2025, la balance commerciale d'Israël a été excédentaire pendant 15 des 56 années, et celle de l'Allemagne pendant 33. Les balances commerciales d'Israël et de l'Allemagne ont été déficitaires en même temps pendant 23 de ces années, la dernière fois en 1992.
Israël vs Allemagne : chiffres de la balance commerciale
|
Israël
|
Allemagne
|
|
|---|---|---|
| Biens et services, $ US | +13,0 Md $US (2025) | +119 Md $US (2025) |
| % du PIB | +2,1 % (2025) | +2,4 % (2025) |
| Années d'excédent depuis 2000 | 15 sur 26 | 26 sur 26 |
| Solde des biens entre les deux, chiffres propres | −2,88 Md $US (2025) | +2,90 Md $US (2025) |
| Premier excédent en biens avec | États-Unis (+6,12 Md $US, 2025) | États-Unis (+62,9 Md $US, 2025) |
| Premier déficit en biens avec | Chine (−18,0 Md $US, 2025) | Chine (−102 Md $US, 2025) |
Comparer la balance commerciale de 2 pays au choix
Sources :
- Banque mondiale | Économie et croissance (1970–2025, mis à jour en octobre 2026)
- TradeMap (2001–2025, mis à jour en octobre 2026)
Creative Commons Attribution (CC BY) : vous pouvez copier, partager, adapter et réutiliser ce contenu, y compris à des fins commerciales, à condition de citer statistics.wiki et d’indiquer les modifications apportées. Les sources citées ci-dessus peuvent avoir leurs propres conditions de licence.