
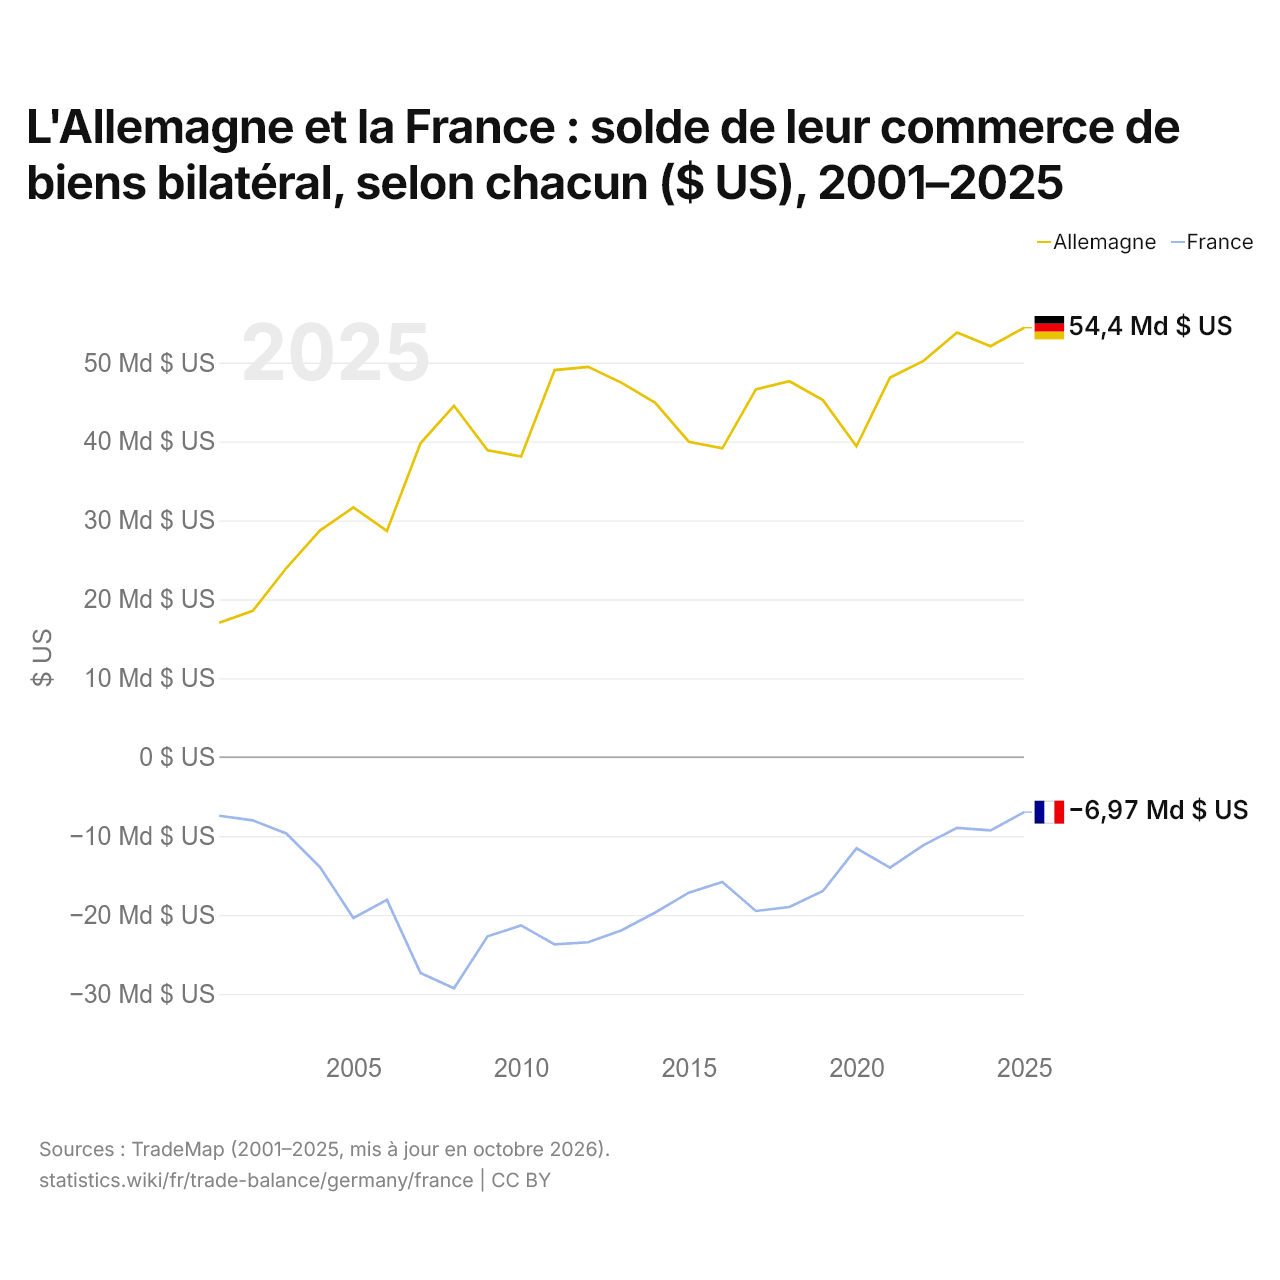
L'Allemagne et la France : solde de leur commerce de biens bilatéral, selon chacun ($ US), 2001–2025
| Année | $ US | |
|---|---|---|
| Allemagne | France | |
| 2025 | 54 416 164 000 $ US | −6 966 320 000 $ US |
| 2024 | 52 070 750 000 $ US | −9 276 463 000 $ US |
| 2023 | 53 802 788 000 $ US | −8 953 187 000 $ US |
| 2022 | 50 216 732 000 $ US | −11 141 523 000 $ US |
| 2021 | 48 095 162 000 $ US | −13 995 203 000 $ US |
| 2020 | 39 380 934 000 $ US | −11 549 485 000 $ US |
| 2019 | 45 243 823 000 $ US | −16 959 452 000 $ US |
| 2018 | 47 633 456 000 $ US | −18 992 567 000 $ US |
| 2017 | 46 594 152 000 $ US | −19 487 490 000 $ US |
| 2016 | 39 130 121 000 $ US | −15 808 533 000 $ US |
| 2015 | 39 971 708 000 $ US | −17 172 520 000 $ US |
| 2014 | 44 904 960 000 $ US | −19 677 306 000 $ US |
| 2013 | 47 425 356 000 $ US | −21 929 894 000 $ US |
| 2012 | 49 453 456 000 $ US | −23 451 556 000 $ US |
| 2011 | 49 049 920 000 $ US | −23 715 538 000 $ US |
| 2010 | 38 094 053 000 $ US | −21 322 904 000 $ US |
| 2009 | 38 891 616 000 $ US | −22 698 064 000 $ US |
| 2008 | 44 522 691 000 $ US | −29 287 000 000 $ US |
| 2007 | 39 765 878 000 $ US | −27 332 628 000 $ US |
| 2006 | 28 672 874 000 $ US | −18 086 395 000 $ US |
| 2005 | 31 642 706 000 $ US | −20 371 764 000 $ US |
| 2004 | 28 707 446 000 $ US | −13 914 854 000 $ US |
| 2003 | 23 964 763 000 $ US | −9 667 798 000 $ US |
| 2002 | 18 545 065 000 $ US | −8 007 066 000 $ US |
| 2001 | 17 017 283 000 $ US | −7 428 933 000 $ US |
En 2025, selon l'Allemagne, son commerce de biens avec la France affichait un excédent de 54,4 milliards de dollars ; selon la France, son commerce de biens avec l'Allemagne affichait un déficit de 6,97 milliards de dollars. En 2001, les chiffres étaient un excédent de 17 milliards de dollars pour l'Allemagne et un déficit de 7,43 milliards de dollars pour la France.
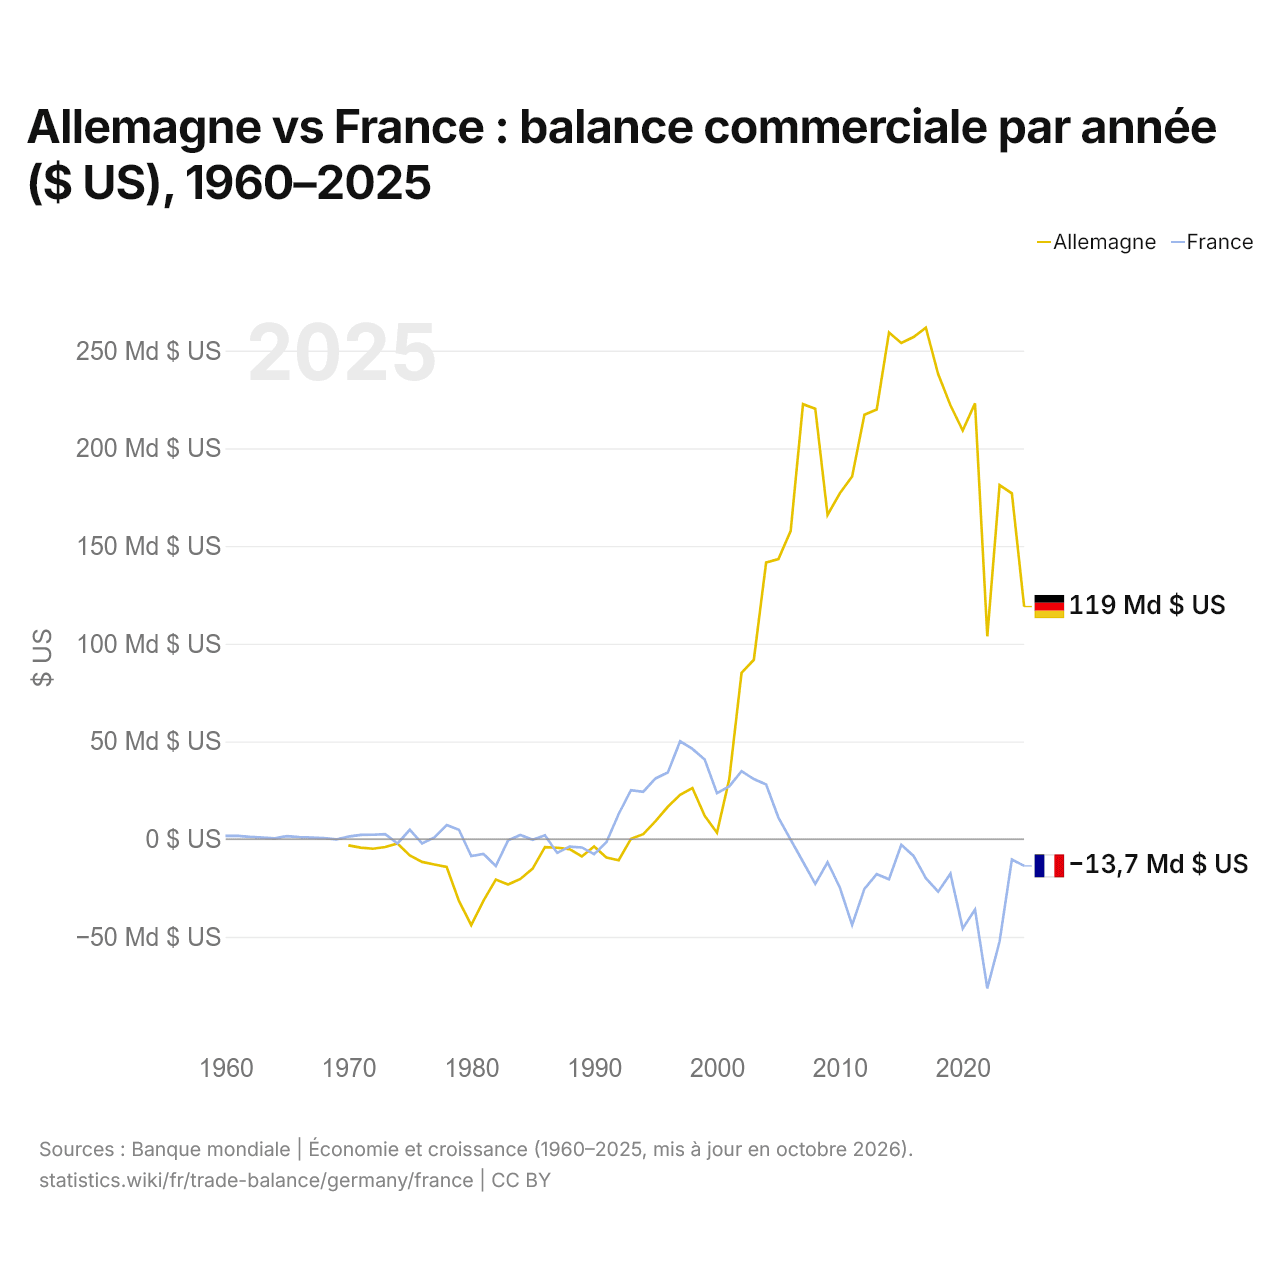
Allemagne vs France : balance commerciale par année ($ US), 1960–2025
| Année | $ US | |
|---|---|---|
 Allemagne |
 France |
|
| 2025 | 119 036 943 611 $ US | −13 691 892 676 $ US |
| 2024 | 176 993 019 011 $ US | −10 387 713 597 $ US |
| 2023 | 181 209 809 275 $ US | −52 372 867 874 $ US |
| 2022 | 103 809 534 747 $ US | −76 323 175 109 $ US |
| 2021 | 222 995 040 802 $ US | −35 964 530 801 $ US |
| 2020 | 209 133 823 156 $ US | −45 662 030 726 $ US |
| 2019 | 222 041 052 173 $ US | −17 694 749 944 $ US |
| 2018 | 237 995 400 452 $ US | −26 878 288 452 $ US |
| 2017 | 261 732 442 733 $ US | −19 990 725 131 $ US |
| 2016 | 256 950 954 099 $ US | −8 555 918 301 $ US |
| 2015 | 253 944 200 893 $ US | −2 874 747 900 $ US |
| 2014 | 259 262 242 062 $ US | −20 476 182 589 $ US |
| 2013 | 219 838 066 559 $ US | −17 928 929 470 $ US |
| 2012 | 217 210 227 233 $ US | −25 424 169 112 $ US |
| 2011 | 185 606 097 335 $ US | −43 858 143 696 $ US |
| 2010 | 177 011 015 050 $ US | −24 731 111 845 $ US |
| 2009 | 165 923 316 906 $ US | −11 805 159 462 $ US |
| 2008 | 220 288 283 354 $ US | −22 878 042 543 $ US |
| 2007 | 222 623 193 646 $ US | −11 565 875 316 $ US |
| 2006 | 157 789 848 554 $ US | −314 778 625 $ US |
| 2005 | 143 315 467 107 $ US | 11 054 488 524 $ US |
| 2004 | 141 587 181 187 $ US | 27 985 189 929 $ US |
| 2003 | 91 785 747 701 $ US | 30 738 831 193 $ US |
| 2002 | 85 110 145 458 $ US | 34 756 831 657 $ US |
| 2001 | 30 705 762 723 $ US | 26 968 658 956 $ US |
| 2000 | 3 259 428 685 $ US | 23 545 285 267 $ US |
| 1999 | 11 966 537 957 $ US | 40 790 461 990 $ US |
| 1998 | 26 183 172 169 $ US | 46 166 110 740 $ US |
| 1997 | 22 686 668 171 $ US | 50 108 338 953 $ US |
| 1996 | 16 562 256 304 $ US | 34 112 706 757 $ US |
| 1995 | 9 254 810 973 $ US | 31 069 260 087 $ US |
| 1994 | 2 562 371 942 $ US | 24 247 400 756 $ US |
| 1993 | 179 817 816 $ US | 25 065 323 141 $ US |
| 1992 | −10 812 773 951 $ US | 12 888 475 836 $ US |
| 1991 | −9 442 545 669 $ US | −1 575 747 006 $ US |
| 1990 | −3 700 909 091 $ US | −7 657 631 611 $ US |
| 1989 | −8 860 353 688 $ US | −4 238 741 518 $ US |
| 1988 | −5 073 354 494 $ US | −3 842 638 476 $ US |
| 1987 | −4 398 411 317 $ US | −7 038 415 366 $ US |
| 1986 | −4 040 852 923 $ US | 2 015 437 068 $ US |
| 1985 | −15 052 044 247 $ US | −286 173 164 $ US |
| 1984 | −20 362 746 203 $ US | 2 161 975 531 $ US |
| 1983 | −23 185 607 813 $ US | −632 756 692 $ US |
| 1982 | −20 687 120 174 $ US | −13 723 325 681 $ US |
| 1981 | −31 452 268 282 $ US | −7 579 843 090 $ US |
| 1980 | −43 964 356 574 $ US | −8 643 123 254 $ US |
| 1979 | −31 634 161 776 $ US | 4 816 373 728 $ US |
| 1978 | −14 221 404 090 $ US | 7 241 133 721 $ US |
| 1977 | −12 957 768 887 $ US | 868 280 289 $ US |
| 1976 | −11 645 608 203 $ US | −2 147 364 108 $ US |
| 1975 | −8 334 008 268 $ US | 4 812 605 171 $ US |
| 1974 | −2 193 463 835 $ US | −2 215 630 115 $ US |
| 1973 | −4 000 794 731 $ US | 2 527 401 296 $ US |
| 1972 | −4 909 821 505 $ US | 2 245 383 615 $ US |
| 1971 | −4 336 130 597 $ US | 2 159 464 899 $ US |
| 1970 | −3 162 513 226 $ US | 1 297 980 394 $ US |
| 1969 | - | −146 618 606 $ US |
| 1968 | - | 612 901 162 $ US |
| 1967 | - | 840 231 291 $ US |
| 1966 | - | 1 011 891 447 $ US |
| 1965 | - | 1 521 823 088 $ US |
| 1964 | - | 442 835 372 $ US |
| 1963 | - | 841 559 930 $ US |
| 1962 | - | 1 154 587 274 $ US |
| 1961 | - | 1 666 644 737 $ US |
| 1960 | - | 1 710 489 823 $ US |
En 2025, la balance commerciale de l'Allemagne affichait un excédent de 119 milliards de dollars et celle de la France un déficit de 13,7 milliards de dollars. En 1970, la balance commerciale de l'Allemagne affichait un déficit de 3,16 milliards de dollars et celle de la France un excédent de 1,3 milliard de dollars.
De 1970 à 2025, la balance commerciale de l'Allemagne a été excédentaire pendant 33 des 56 années, et celle de la France pendant 24. Les balances commerciales de l'Allemagne et de la France ont été déficitaires en même temps pendant 12 de ces années, la dernière fois en 1991.
Allemagne vs France : chiffres de la balance commerciale
|
Allemagne
|
France
|
|
|---|---|---|
| Biens et services, $ US | +119 Md $US (2025) | −13,7 Md $US (2025) |
| % du PIB | +2,4 % (2025) | −0,4 % (2025) |
| Années d'excédent depuis 2000 | 26 sur 26 | 6 sur 26 |
| Solde des biens entre les deux, chiffres propres | +54,4 Md $US (2025) | −6,97 Md $US (2025) |
| Premier excédent en biens avec | États-Unis (+62,9 Md $US, 2025) | Royaume-Uni (+15,2 Md $US, 2025) |
| Premier déficit en biens avec | Chine (−102 Md $US, 2025) | Chine (−56,4 Md $US, 2025) |
Comparer la balance commerciale de 2 pays au choix
Sources :
- Banque mondiale | Économie et croissance (1960–2025, mis à jour en octobre 2026)
- TradeMap (2001–2025, mis à jour en octobre 2026)
Creative Commons Attribution (CC BY) : vous pouvez copier, partager, adapter et réutiliser ce contenu, y compris à des fins commerciales, à condition de citer statistics.wiki et d’indiquer les modifications apportées. Les sources citées ci-dessus peuvent avoir leurs propres conditions de licence.