
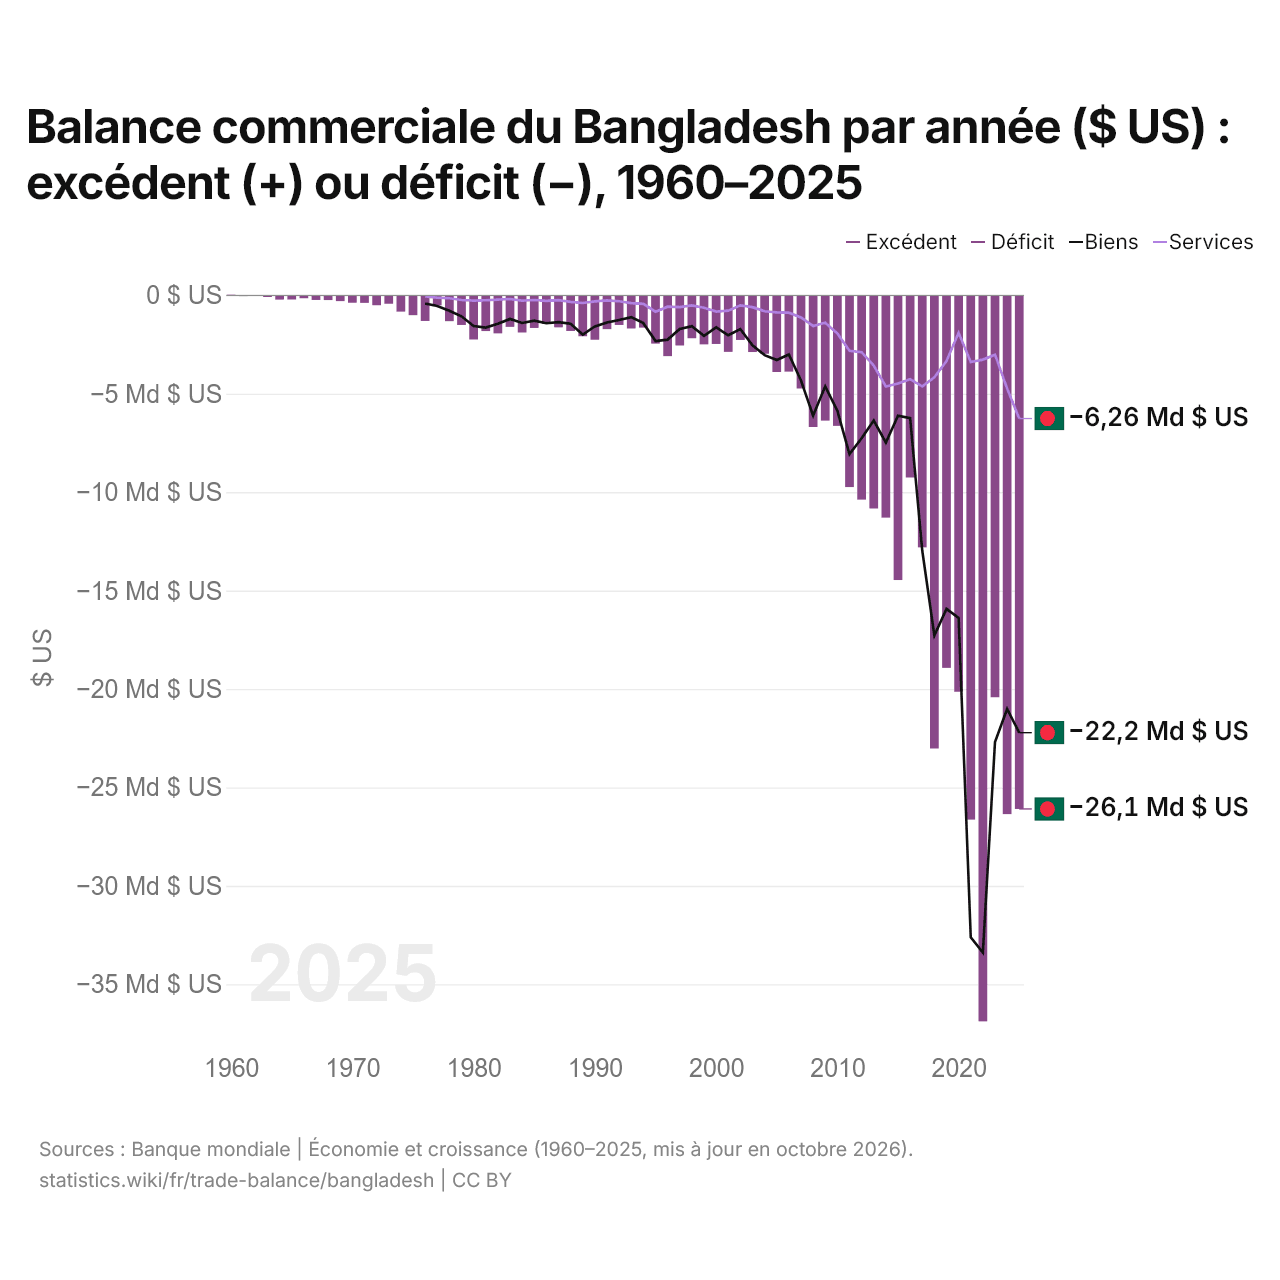
Balance commerciale du Bangladesh par année ($ US) : excédent (+) ou déficit (−), 1960–2025
| Année | $ US | ||
|---|---|---|---|
| Biens et services | Biens | Services | |
| 2025 | −26 094 007 785 $ US | −22 218 710 707 $ US | −6 263 519 619 $ US |
| 2024 | −26 357 644 240 $ US | −21 014 147 257 $ US | −4 731 283 350 $ US |
| 2023 | −20 421 363 572 $ US | −22 692 111 206 $ US | −3 017 016 422 $ US |
| 2022 | −36 881 921 801 $ US | −33 393 617 605 $ US | −3 268 735 663 $ US |
| 2021 | −26 634 920 363 $ US | −32 616 728 177 $ US | −3 391 478 086 $ US |
| 2020 | −20 142 051 278 $ US | −16 393 590 453 $ US | −1 906 794 454 $ US |
| 2019 | −18 926 257 571 $ US | −15 928 569 464 $ US | −3 344 036 396 $ US |
| 2018 | −23 025 820 647 $ US | −17 284 133 892 $ US | −4 173 035 993 $ US |
| 2017 | −12 807 430 499 $ US | −12 965 813 782 $ US | −4 628 674 053 $ US |
| 2016 | −9 260 953 611 $ US | −6 243 937 554 $ US | −4 261 364 988 $ US |
| 2015 | −14 465 532 640 $ US | −6 120 242 244 $ US | −4 486 255 931 $ US |
| 2014 | −11 297 725 501 $ US | −7 481 914 473 $ US | −4 637 475 139 $ US |
| 2013 | −10 830 906 475 $ US | −6 362 380 111 $ US | −3 570 817 964 $ US |
| 2012 | −10 381 901 109 $ US | −7 266 478 673 $ US | −2 891 420 426 $ US |
| 2011 | −9 744 203 015 $ US | −8 070 176 826 $ US | −2 817 850 065 $ US |
| 2010 | −6 633 666 170 $ US | −5 872 228 067 $ US | −1 944 116 726 $ US |
| 2009 | −6 366 300 367 $ US | −4 625 996 480 $ US | −1 399 302 672 $ US |
| 2008 | −6 692 430 506 $ US | −6 112 733 469 $ US | −1 559 908 340 $ US |
| 2007 | −4 738 256 592 $ US | −4 332 098 853 $ US | −1 130 829 728 $ US |
| 2006 | −3 880 557 603 $ US | −3 011 857 469 $ US | −884 446 391 $ US |
| 2005 | −3 898 472 862 $ US | −3 289 177 495 $ US | −867 582 221 $ US |
| 2004 | −2 972 345 847 $ US | −3 043 437 399 $ US | −811 443 083 $ US |
| 2003 | −2 884 974 093 $ US | −2 538 611 631 $ US | −603 042 186 $ US |
| 2002 | −2 269 650 009 $ US | −1 719 959 944 $ US | −514 883 603 $ US |
| 2001 | −2 874 981 468 $ US | −2 033 063 344 $ US | −784 922 313 $ US |
| 2000 | −2 472 788 710 $ US | −1 626 994 620 $ US | −831 884 268 $ US |
| 1999 | −2 497 212 978 $ US | −2 061 032 897 $ US | −635 260 073 $ US |
| 1998 | −2 182 026 432 $ US | −1 572 620 789 $ US | −514 817 820 $ US |
| 1997 | −2 549 601 874 $ US | −1 707 504 356 $ US | −599 707 796 $ US |
| 1996 | −3 094 229 829 $ US | −2 254 061 059 $ US | −582 454 543 $ US |
| 1995 | −2 458 582 090 $ US | −2 324 093 838 $ US | −833 021 288 $ US |
| 1994 | −1 642 094 763 $ US | −1 416 109 446 $ US | −435 236 455 $ US |
| 1993 | −1 687 195 767 $ US | −1 112 599 439 $ US | −402 739 914 $ US |
| 1992 | −1 509 549 072 $ US | −1 255 926 435 $ US | −305 424 178 $ US |
| 1991 | −1 722 661 064 $ US | −1 385 793 343 $ US | −264 229 496 $ US |
| 1990 | −2 259 239 984 $ US | −1 586 957 674 $ US | −308 883 257 $ US |
| 1989 | −2 085 202 622 $ US | −1 995 289 743 $ US | −392 035 947 $ US |
| 1988 | −1 813 076 865 $ US | −1 443 389 544 $ US | −335 472 504 $ US |
| 1987 | −1 629 838 710 $ US | −1 368 753 616 $ US | −246 247 186 $ US |
| 1986 | −1 448 600 000 $ US | −1 420 714 661 $ US | −287 979 759 $ US |
| 1985 | −1 660 461 538 $ US | −1 286 968 042 $ US | −240 059 355 $ US |
| 1984 | −1 895 720 000 $ US | −1 408 266 956 $ US | −270 528 106 $ US |
| 1983 | −1 604 040 404 $ US | −1 206 770 152 $ US | −189 168 574 $ US |
| 1982 | −1 937 075 848 $ US | −1 452 646 455 $ US | −221 544 816 $ US |
| 1981 | −1 819 522 644 $ US | −1 644 302 977 $ US | −252 352 306 $ US |
| 1980 | −2 247 061 873 $ US | −1 559 609 531 $ US | −269 696 151 $ US |
| 1979 | −1 508 080 953 $ US | −1 070 181 573 $ US | −239 581 328 $ US |
| 1978 | −1 317 974 808 $ US | −790 338 284 $ US | −152 140 257 $ US |
| 1977 | −515 438 378 $ US | −542 625 112 $ US | −120 744 777 $ US |
| 1976 | −1 304 107 178 $ US | −417 149 338 $ US | −63 456 927 $ US |
| 1975 | −1 012 377 603 $ US | - | - |
| 1974 | −831 762 076 $ US | - | - |
| 1973 | −429 877 227 $ US | - | - |
| 1972 | −506 696 083 $ US | - | - |
| 1971 | −388 240 271 $ US | - | - |
| 1970 | −377 188 146 $ US | - | - |
| 1969 | −298 123 208 $ US | - | - |
| 1968 | −245 129 813 $ US | - | - |
| 1967 | −238 611 875 $ US | - | - |
| 1966 | −152 462 271 $ US | - | - |
| 1965 | −218 774 792 $ US | - | - |
| 1964 | −220 475 083 $ US | - | - |
| 1963 | −88 983 521 $ US | - | - |
| 1962 | −3 117 229 $ US | - | - |
| 1961 | −44 208 312 $ US | - | - |
| 1960 | 29 472 271 $ US | - | - |
En 2025, la balance commerciale du Bangladesh affichait un déficit de 26,1 milliards de dollars, contre un excédent de 29,5 millions de dollars en 1960. Le plus grand déficit a été de 36,9 milliards de dollars, en 2022. La balance commerciale du Bangladesh est déficitaire chaque année depuis 1961.
En 2025, le solde commercial du Bangladesh était le 39e plus élevé de 44 pays situés en Asie, où les soldes allaient d'un déficit de 68,9 milliards de dollars en Inde à un excédent de 816 milliards de dollars en Chine. De 2016 à 2025, les soldes commerciaux du Bangladesh ont totalisé un déficit de 221 milliards de dollars, contre un déficit de 85 milliards de dollars de 2006 à 2015. En 2025, les transactions courantes du Bangladesh étaient à l'équilibre.
Commerce de biens du Bangladesh avec ses 10 principaux partenaires commerciaux, selon le Bangladesh
| Pays | Exportations vers | Importations depuis | Solde | |
|---|---|---|---|---|
 Chine |
891 M $US | 15,3 Md $US | −14,4 Md $US | |
 Inde |
1,23 Md $US | 9,41 Md $US | −8,18 Md $US | vs Inde |
 Espagne |
2,55 Md $US | 6,59 Md $US | −4,04 Md $US | |
 États-Unis |
6,54 Md $US | 2,24 Md $US | +4,30 Md $US | |
 Allemagne |
6,23 Md $US | 1,26 Md $US | +4,97 Md $US | |
 Singapour |
295 M $US | 5,87 Md $US | −5,58 Md $US | |
 Royaume-Uni |
4,05 Md $US | 449 M $US | +3,60 Md $US | |
 Japon |
1,37 Md $US | 2,76 Md $US | −1,40 Md $US | |
 Indonésie |
61,8 M $US | 3,18 Md $US | −3,12 Md $US | |
 Malaisie |
270 M $US | 2,89 Md $US | −2,62 Md $US |
Balance commerciale du Bangladesh : excédent (+) ou déficit (−)
Comparer la balance commerciale du Bangladesh avec celle d'autres pays
Sources :
- TradeMap (2018, mis à jour en octobre 2026)
- Banque mondiale | Économie et croissance (1960–2025, mis à jour en octobre 2026)
Creative Commons Attribution (CC BY) : vous pouvez copier, partager, adapter et réutiliser ce contenu, y compris à des fins commerciales, à condition de citer statistics.wiki et d’indiquer les modifications apportées. Les sources citées ci-dessus peuvent avoir leurs propres conditions de licence.