
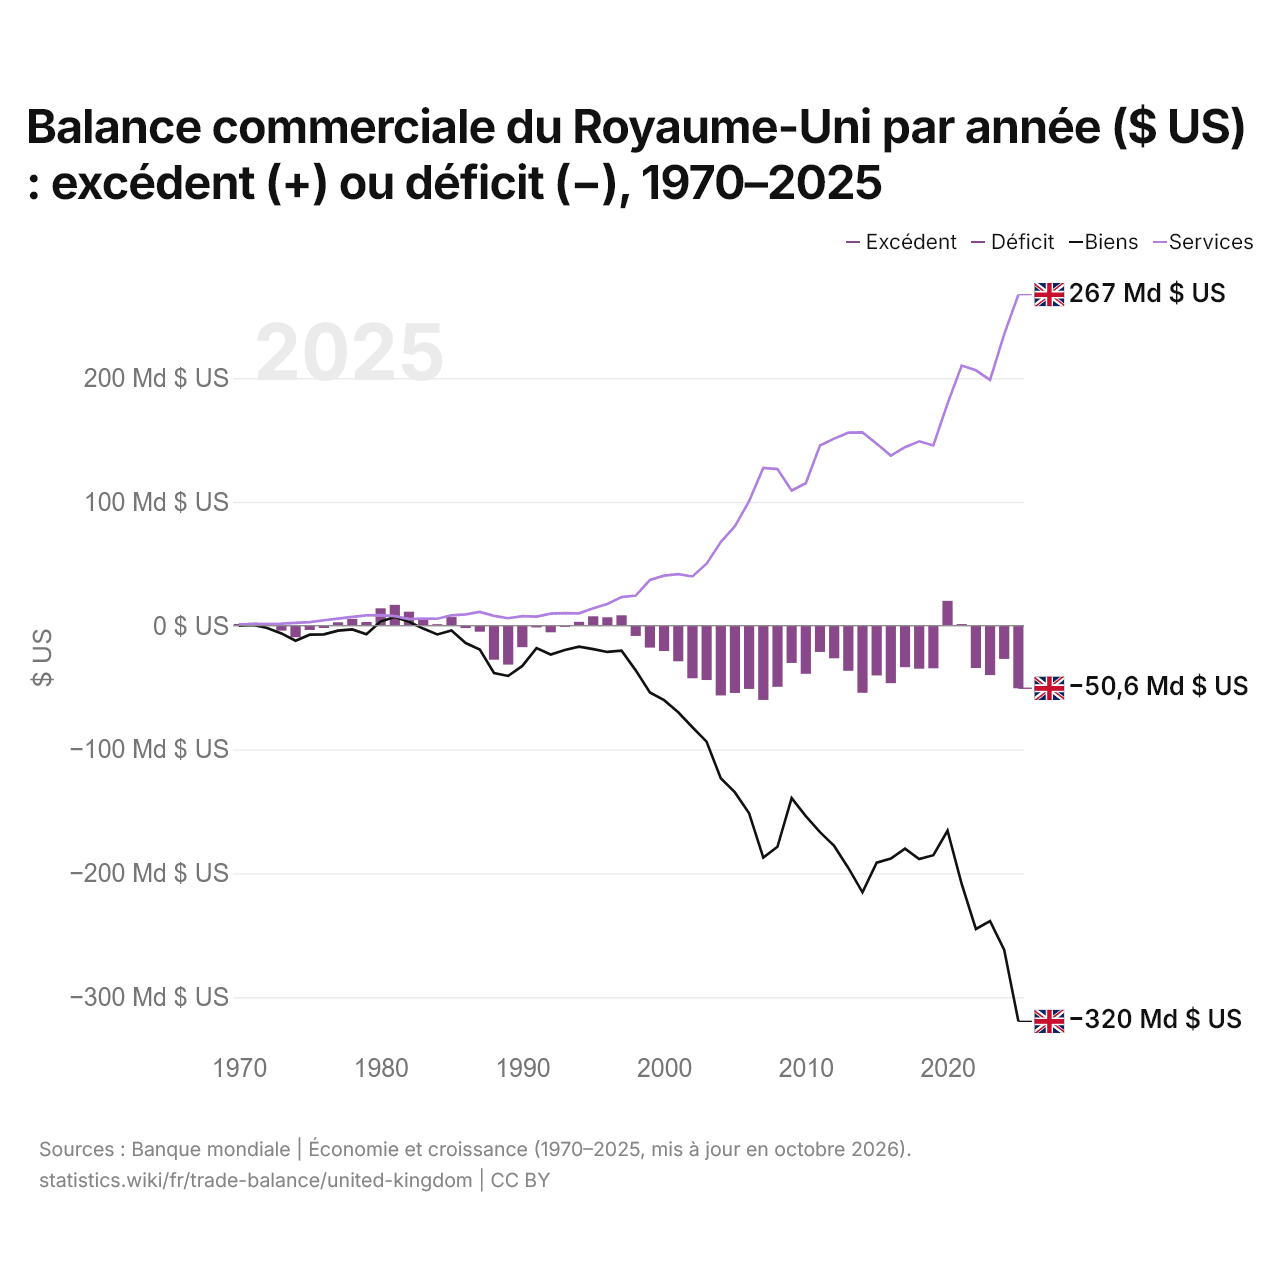
Balance commerciale du Royaume-Uni par année ($ US) : excédent (+) ou déficit (−), 1970–2025
| Année | $ US | ||
|---|---|---|---|
| Biens et services | Biens | Services | |
| 2025 | −50 569 212 583 $ US | −319 614 852 175 $ US | 267 366 699 324 $ US |
| 2024 | −26 857 883 928 $ US | −261 956 076 977 $ US | 235 542 440 560 $ US |
| 2023 | −39 949 590 667 $ US | −238 643 186 133 $ US | 198 516 242 877 $ US |
| 2022 | −34 200 593 267 $ US | −245 024 931 302 $ US | 206 243 969 621 $ US |
| 2021 | 1 291 493 981 $ US | −208 678 427 617 $ US | 210 097 951 986 $ US |
| 2020 | 20 087 190 388 $ US | −165 635 742 225 $ US | 179 482 701 691 $ US |
| 2019 | −34 446 574 055 $ US | −185 429 220 012 $ US | 145 599 582 268 $ US |
| 2018 | −34 784 736 832 $ US | −188 502 154 062 $ US | 148 924 292 867 $ US |
| 2017 | −33 530 132 413 $ US | −180 100 855 214 $ US | 144 176 423 655 $ US |
| 2016 | −46 460 165 826 $ US | −188 188 519 275 $ US | 137 389 676 688 $ US |
| 2015 | −40 263 054 056 $ US | −191 418 792 619 $ US | 146 994 532 522 $ US |
| 2014 | −54 209 962 034 $ US | −215 419 724 599 $ US | 156 062 348 534 $ US |
| 2013 | −36 480 284 727 $ US | −195 695 415 679 $ US | 155 902 749 342 $ US |
| 2012 | −26 375 609 226 $ US | −177 897 882 101 $ US | 151 092 285 686 $ US |
| 2011 | −21 250 011 601 $ US | −166 801 552 109 $ US | 145 589 878 505 $ US |
| 2010 | −38 910 388 863 $ US | −153 918 207 187 $ US | 114 983 671 968 $ US |
| 2009 | −30 099 704 004 $ US | −139 332 668 858 $ US | 109 153 364 286 $ US |
| 2008 | −49 411 764 706 $ US | −178 638 048 542 $ US | 126 453 673 300 $ US |
| 2007 | −60 026 010 404 $ US | −187 357 513 299 $ US | 127 357 752 049 $ US |
| 2006 | −51 102 115 915 $ US | −151 550 571 858 $ US | 100 592 634 867 $ US |
| 2005 | −54 350 909 091 $ US | −134 690 537 229 $ US | 80 328 858 160 $ US |
| 2004 | −56 358 476 748 $ US | −123 322 554 121 $ US | 67 558 551 510 $ US |
| 2003 | −43 920 000 000 $ US | −93 698 642 254 $ US | 50 060 797 628 $ US |
| 2002 | −42 492 505 995 $ US | −82 076 397 931 $ US | 39 750 401 387 $ US |
| 2001 | −28 744 781 920 $ US | −69 977 738 988 $ US | 41 553 055 375 $ US |
| 2000 | −20 482 675 140 $ US | −60 141 161 553 $ US | 40 368 980 818 $ US |
| 1999 | −17 736 612 199 $ US | −54 038 801 079 $ US | 36 848 695 122 $ US |
| 1998 | −8 272 606 823 $ US | −36 127 373 161 $ US | 24 296 763 551 $ US |
| 1997 | 8 370 988 867 $ US | −20 202 529 919 $ US | 23 100 607 977 $ US |
| 1996 | 6 794 071 763 $ US | −21 228 440 868 $ US | 17 565 669 836 $ US |
| 1995 | 7 601 388 670 $ US | −19 005 967 488 $ US | 14 119 445 236 $ US |
| 1994 | 3 075 209 672 $ US | −16 947 269 952 $ US | 9 966 438 810 $ US |
| 1993 | −895 112 478 $ US | −19 648 141 094 $ US | 10 070 503 759 $ US |
| 1992 | −5 413 362 583 $ US | −23 332 078 377 $ US | 9 704 070 530 $ US |
| 1991 | −1 423 382 716 $ US | −18 167 985 741 $ US | 7 277 923 862 $ US |
| 1990 | −17 387 460 938 $ US | −32 548 589 086 $ US | 7 685 238 986 $ US |
| 1989 | −31 467 719 241 $ US | −40 615 609 561 $ US | 5 988 241 719 $ US |
| 1988 | −27 479 980 434 $ US | −38 291 290 970 $ US | 7 942 265 055 $ US |
| 1987 | −4 905 373 427 $ US | −19 208 575 205 $ US | 11 116 194 037 $ US |
| 1986 | −1 914 626 209 $ US | −14 058 473 623 $ US | 9 098 725 050 $ US |
| 1985 | 6 960 758 470 $ US | −3 955 189 671 $ US | 8 349 468 668 $ US |
| 1984 | 1 166 102 687 $ US | −7 114 234 876 $ US | 5 600 922 214 $ US |
| 1983 | 6 137 257 844 $ US | −2 376 939 980 $ US | 5 800 147 196 $ US |
| 1982 | 11 288 424 179 $ US | 3 167 233 655 $ US | 5 307 335 246 $ US |
| 1981 | 16 850 128 617 $ US | 6 959 577 032 $ US | 7 703 899 769 $ US |
| 1980 | 14 021 626 772 $ US | 3 352 967 864 $ US | 8 519 007 010 $ US |
| 1979 | 2 950 108 005 $ US | −6 972 966 171 $ US | 8 303 673 300 $ US |
| 1978 | 5 468 285 714 $ US | −3 063 606 710 $ US | 7 126 441 214 $ US |
| 1977 | 2 715 295 657 $ US | −4 004 451 962 $ US | 5 657 200 130 $ US |
| 1976 | −1 885 504 043 $ US | −7 069 934 747 $ US | 4 329 228 853 $ US |
| 1975 | −3 440 595 133 $ US | −7 272 498 848 $ US | 2 901 977 435 $ US |
| 1974 | −9 354 408 602 $ US | −12 241 824 923 $ US | 2 250 666 212 $ US |
| 1973 | −4 008 826 556 $ US | −6 255 733 328 $ US | 1 680 283 161 $ US |
| 1972 | 198 826 174 $ US | −1 843 860 850 $ US | 1 558 414 352 $ US |
| 1971 | 2 351 961 548 $ US | 520 443 545 $ US | 1 334 647 962 $ US |
| 1970 | 1 393 813 295 $ US | −33 599 973 $ US | 1 010 399 193 $ US |
En 2025, la balance commerciale du Royaume-Uni affichait un déficit de 50,6 milliards de dollars, contre un excédent de 1,39 milliard de dollars en 1970. Le plus grand déficit a été de 60 milliards de dollars, en 2007, et le plus grand excédent de 20,1 milliards de dollars, en 2020. La balance commerciale du Royaume-Uni est déficitaire chaque année depuis 2022. Le commerce de biens affichait un déficit de 320 milliards de dollars et celui de services un excédent de 267 milliards de dollars.
En 2025, le solde commercial du Royaume-Uni était le 40e plus élevé de 41 pays situés en Europe, où les soldes allaient d'un déficit de 56,8 milliards de dollars en Ukraine à un excédent de 290 milliards de dollars en Irlande. De 2016 à 2025, les soldes commerciaux du Royaume-Uni ont totalisé un déficit de 279 milliards de dollars, contre un déficit de 408 milliards de dollars de 2006 à 2015. En 2025, les transactions courantes du Royaume-Uni affichaient un déficit de 3,1 % du PIB.
Commerce de biens du Royaume-Uni avec ses 10 principaux partenaires commerciaux, selon le Royaume-Uni, 2025
| Pays | Exportations vers | Importations depuis | Solde | |
|---|---|---|---|---|
 États-Unis |
87,9 Md $US | 112 Md $US | −23,8 Md $US | vs USA |
 Chine |
36,6 Md $US | 108 Md $US | −71,7 Md $US | vs Chine |
 Allemagne |
43,1 Md $US | 79,1 Md $US | −35,9 Md $US | vs Allemagne |
 Suisse |
31,4 Md $US | 51,7 Md $US | −20,3 Md $US | vs Suisse |
 France |
30,0 Md $US | 42,5 Md $US | −12,5 Md $US | vs France |
 Pays-Bas |
33,1 Md $US | 27,9 Md $US | +5,22 Md $US | vs Pays-Bas |
 Irlande |
30,6 Md $US | 21,4 Md $US | +9,23 Md $US | vs Irlande |
 Italie |
11,3 Md $US | 35,6 Md $US | −24,3 Md $US | vs Italie |
 Canada |
8,45 Md $US | 36,8 Md $US | −28,4 Md $US | vs Canada |
 Espagne |
13,8 Md $US | 26,6 Md $US | −12,8 Md $US | vs Espagne |
Balance commerciale du Royaume-Uni : excédent (+) ou déficit (−)
Comparer la balance commerciale du Royaume-Uni avec celle d'autres pays
Sources :
- TradeMap (2025, mis à jour en octobre 2026)
- Banque mondiale | Économie et croissance (1970–2025, mis à jour en octobre 2026)
Creative Commons Attribution (CC BY) : vous pouvez copier, partager, adapter et réutiliser ce contenu, y compris à des fins commerciales, à condition de citer statistics.wiki et d’indiquer les modifications apportées. Les sources citées ci-dessus peuvent avoir leurs propres conditions de licence.