
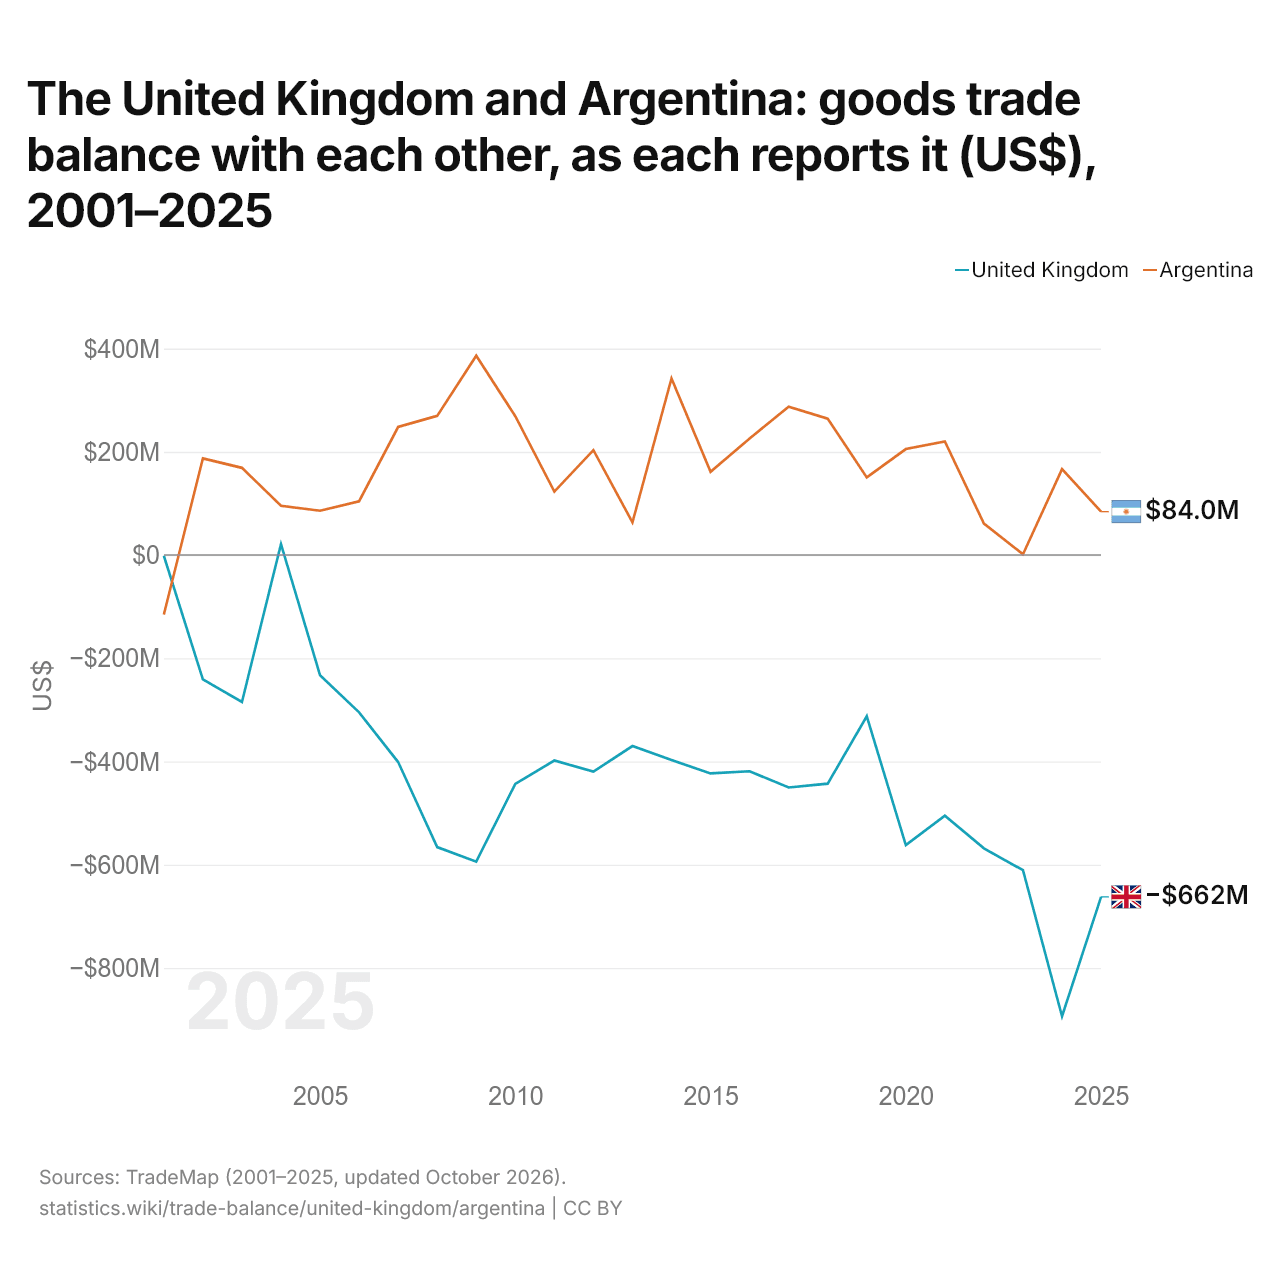
Le Royaume-Uni et l'Argentine : solde de leur commerce de biens bilatéral, selon chacun ($ US), 2001–2025
| Année | $ US | |
|---|---|---|
| Royaume-Uni | Argentine | |
| 2025 | −662 259 000 $ US | 84 035 000 $ US |
| 2024 | −893 583 000 $ US | 166 311 000 $ US |
| 2023 | −610 515 000 $ US | 1 547 000 $ US |
| 2022 | −568 149 000 $ US | 60 790 000 $ US |
| 2021 | −505 039 000 $ US | 219 916 000 $ US |
| 2020 | −561 987 000 $ US | 205 298 000 $ US |
| 2019 | −312 310 000 $ US | 150 354 000 $ US |
| 2018 | −442 903 000 $ US | 264 196 000 $ US |
| 2017 | −450 330 000 $ US | 287 325 000 $ US |
| 2016 | −418 859 000 $ US | 225 825 000 $ US |
| 2015 | −423 086 000 $ US | 161 339 000 $ US |
| 2014 | −397 162 000 $ US | 342 184 000 $ US |
| 2013 | −369 983 000 $ US | 63 243 000 $ US |
| 2012 | −419 639 000 $ US | 203 249 000 $ US |
| 2011 | −398 129 000 $ US | 122 836 000 $ US |
| 2010 | −443 297 000 $ US | 268 903 000 $ US |
| 2009 | −594 023 000 $ US | 386 168 000 $ US |
| 2008 | −565 844 000 $ US | 269 544 000 $ US |
| 2007 | −401 014 000 $ US | 248 058 000 $ US |
| 2006 | −304 744 000 $ US | 104 239 000 $ US |
| 2005 | −232 675 000 $ US | 85 779 000 $ US |
| 2004 | 21 213 000 $ US | 95 475 000 $ US |
| 2003 | −284 701 000 $ US | 168 926 000 $ US |
| 2002 | −240 995 000 $ US | 187 148 000 $ US |
| 2001 | −1 440 000 $ US | −115 313 000 $ US |
En 2025, selon le Royaume-Uni, son commerce de biens avec l'Argentine affichait un déficit de 662 millions de dollars ; selon l'Argentine, son commerce de biens avec le Royaume-Uni affichait un excédent de 84 millions de dollars. En 2001, les chiffres étaient un déficit de 1,44 million de dollars pour le Royaume-Uni et un déficit de 115 millions de dollars pour l'Argentine.
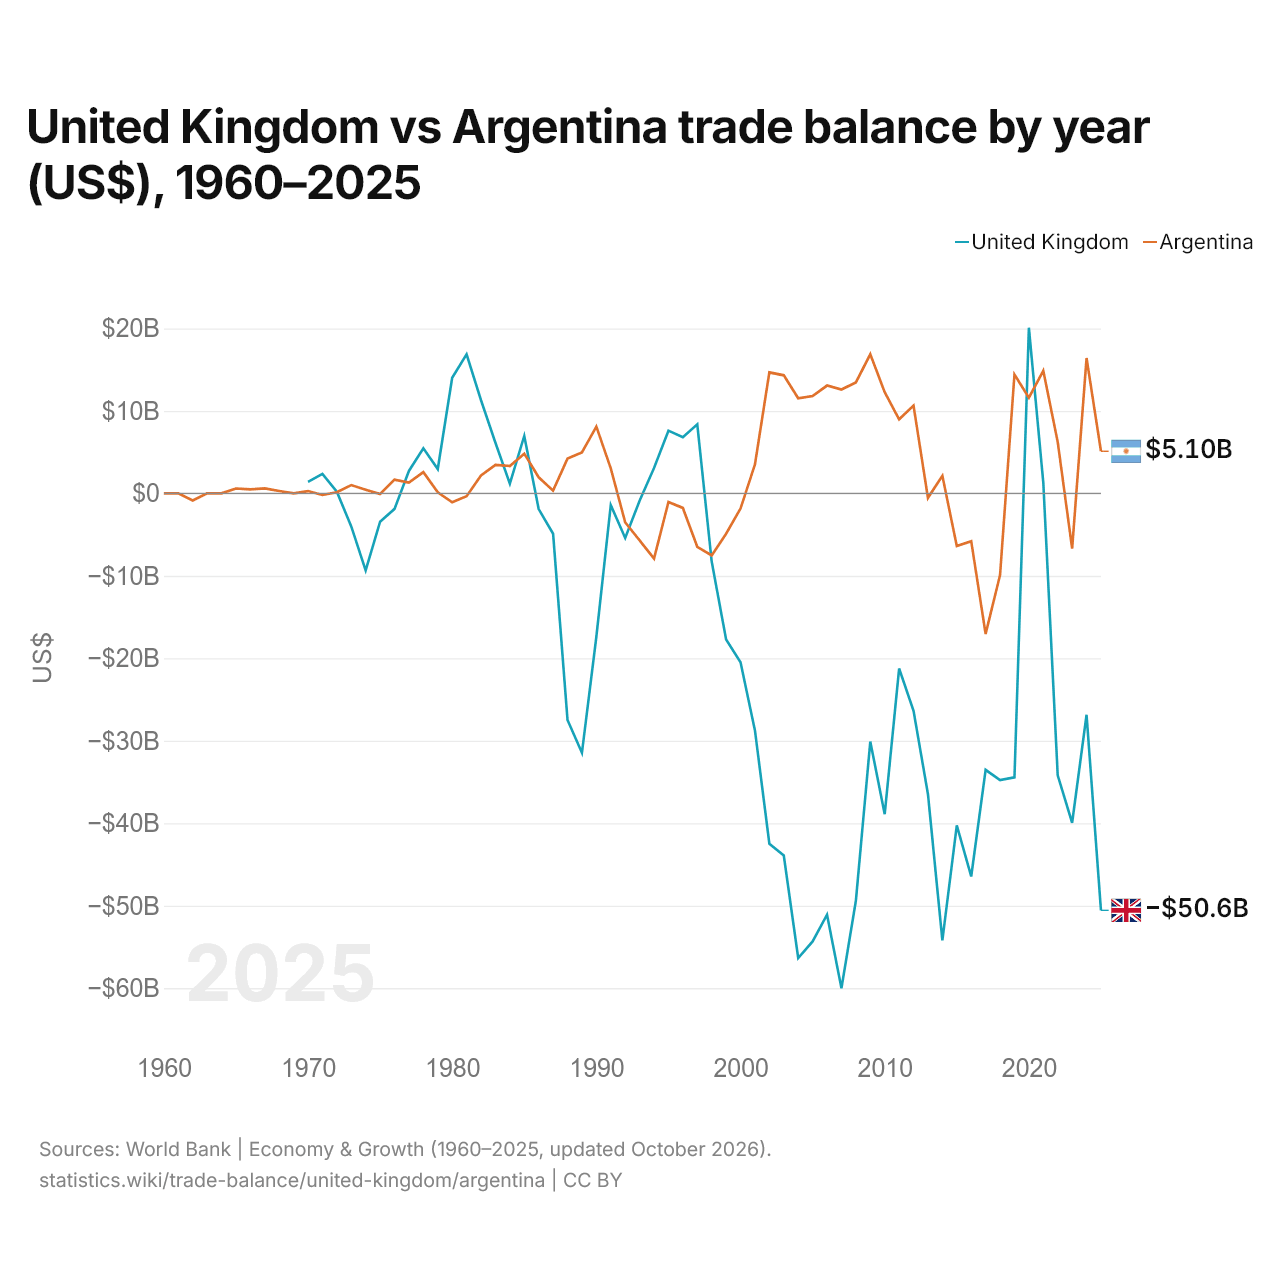
Royaume-Uni vs Argentine : balance commerciale par année ($ US), 1960–2025
| Année | $ US | |
|---|---|---|
 Royaume-Uni |
 Argentine |
|
| 2025 | −50 569 212 583 $ US | 5 100 613 800 $ US |
| 2024 | −26 857 883 928 $ US | 16 404 309 065 $ US |
| 2023 | −39 949 590 667 $ US | −6 704 568 723 $ US |
| 2022 | −34 200 593 267 $ US | 6 233 148 859 $ US |
| 2021 | 1 291 493 981 $ US | 14 863 213 107 $ US |
| 2020 | 20 087 190 388 $ US | 11 599 718 810 $ US |
| 2019 | −34 446 574 055 $ US | 14 413 857 778 $ US |
| 2018 | −34 784 736 832 $ US | −9 914 710 860 $ US |
| 2017 | −33 530 132 413 $ US | −17 049 937 664 $ US |
| 2016 | −46 460 165 826 $ US | −5 796 649 660 $ US |
| 2015 | −40 263 054 056 $ US | −6 393 090 843 $ US |
| 2014 | −54 209 962 034 $ US | 2 127 192 191 $ US |
| 2013 | −36 480 284 727 $ US | −549 718 918 $ US |
| 2012 | −26 375 609 226 $ US | 10 642 160 447 $ US |
| 2011 | −21 250 011 601 $ US | 8 971 671 281 $ US |
| 2010 | −38 910 388 863 $ US | 12 270 934 023 $ US |
| 2009 | −30 099 704 004 $ US | 16 864 736 859 $ US |
| 2008 | −49 411 764 706 $ US | 13 446 803 975 $ US |
| 2007 | −60 026 010 404 $ US | 12 594 785 133 $ US |
| 2006 | −51 102 115 915 $ US | 13 069 507 212 $ US |
| 2005 | −54 350 909 091 $ US | 11 805 942 344 $ US |
| 2004 | −56 358 476 748 $ US | 11 530 324 282 $ US |
| 2003 | −43 920 000 000 $ US | 14 311 606 659 $ US |
| 2002 | −42 492 505 995 $ US | 14 670 786 469 $ US |
| 2001 | −28 744 781 920 $ US | 3 508 536 600 $ US |
| 2000 | −20 482 675 140 $ US | −1 846 455 600 $ US |
| 1999 | −17 736 612 199 $ US | −4 900 400 000 $ US |
| 1998 | −8 272 606 823 $ US | −7 530 100 000 $ US |
| 1997 | 8 370 988 867 $ US | −6 485 300 000 $ US |
| 1996 | 6 794 071 763 $ US | −1 767 000 000 $ US |
| 1995 | 7 601 388 670 $ US | −1 059 485 000 $ US |
| 1994 | 3 075 209 672 $ US | −7 914 860 000 $ US |
| 1993 | −895 112 478 $ US | −5 692 332 332 $ US |
| 1992 | −5 413 362 583 $ US | −3 510 854 173 $ US |
| 1991 | −1 423 382 716 $ US | 3 029 889 879 $ US |
| 1990 | −17 387 460 938 $ US | 8 096 982 795 $ US |
| 1989 | −31 467 719 241 $ US | 4 964 855 541 $ US |
| 1988 | −27 479 980 434 $ US | 4 212 460 577 $ US |
| 1987 | −4 905 373 427 $ US | 323 648 995 $ US |
| 1986 | −1 914 626 209 $ US | 1 945 851 942 $ US |
| 1985 | 6 960 758 470 $ US | 4 815 481 324 $ US |
| 1984 | 1 166 102 687 $ US | 3 312 681 836 $ US |
| 1983 | 6 137 257 844 $ US | 3 447 293 430 $ US |
| 1982 | 11 288 424 179 $ US | 2 166 280 922 $ US |
| 1981 | 16 850 128 617 $ US | −354 736 981 $ US |
| 1980 | 14 021 626 772 $ US | −1 094 188 525 $ US |
| 1979 | 2 950 108 005 $ US | 125 448 026 $ US |
| 1978 | 5 468 285 714 $ US | 2 576 185 988 $ US |
| 1977 | 2 715 295 657 $ US | 1 300 000 008 $ US |
| 1976 | −1 885 504 043 $ US | 1 665 000 247 $ US |
| 1975 | −3 440 595 133 $ US | −81 081 003 $ US |
| 1974 | −9 354 408 602 $ US | 444 444 350 $ US |
| 1973 | −4 008 826 556 $ US | 1 000 000 034 $ US |
| 1972 | 198 826 174 $ US | 125 000 068 $ US |
| 1971 | 2 351 961 548 $ US | −199 999 955 $ US |
| 1970 | 1 393 813 295 $ US | 273 421 120 $ US |
| 1969 | - | 0 $ US |
| 1968 | - | 285 714 230 $ US |
| 1967 | - | 606 060 620 $ US |
| 1966 | - | 476 190 459 $ US |
| 1965 | - | 588 235 264 $ US |
| 1964 | - | 392 $ US |
| 1963 | - | 396 $ US |
| 1962 | - | −860 375 152 $ US |
| 1961 | - | 338 $ US |
| 1960 | - | 338 $ US |
En 2025, la balance commerciale du Royaume-Uni affichait un déficit de 50,6 milliards de dollars et celle de l'Argentine un excédent de 5,1 milliards de dollars. En 1970, la balance commerciale du Royaume-Uni affichait un excédent de 1,39 milliard de dollars et celle de l'Argentine un excédent de 273 millions de dollars.
De 1970 à 2025, la balance commerciale du Royaume-Uni a été excédentaire pendant 18 des 56 années, et celle de l'Argentine pendant 37. Les balances commerciales du Royaume-Uni et de l'Argentine ont été déficitaires en même temps pendant 12 de ces années, la dernière fois en 2023.
Royaume-Uni vs Argentine : chiffres de la balance commerciale
|
Royaume-Uni
|
Argentine
|
|
|---|---|---|
| Biens et services, $ US | −50,6 Md $US (2025) | +5,10 Md $US (2025) |
| % du PIB | −1,3 % (2025) | +0,7 % (2025) |
| Années d'excédent depuis 2000 | 2 sur 26 | 19 sur 26 |
| Solde des biens entre les deux, chiffres propres | −662 M $US (2025) | +84,0 M $US (2025) |
| Premier excédent en biens avec | Irlande (+9,23 Md $US, 2025) | Chili (+5,47 Md $US, 2025) |
| Premier déficit en biens avec | Chine (−71,7 Md $US, 2025) | Chine (−6,88 Md $US, 2025) |
Comparer la balance commerciale de 2 pays au choix
Sources :
- Banque mondiale | Économie et croissance (1960–2025, mis à jour en octobre 2026)
- TradeMap (2001–2025, mis à jour en octobre 2026)
Creative Commons Attribution (CC BY) : vous pouvez copier, partager, adapter et réutiliser ce contenu, y compris à des fins commerciales, à condition de citer statistics.wiki et d’indiquer les modifications apportées. Les sources citées ci-dessus peuvent avoir leurs propres conditions de licence.