
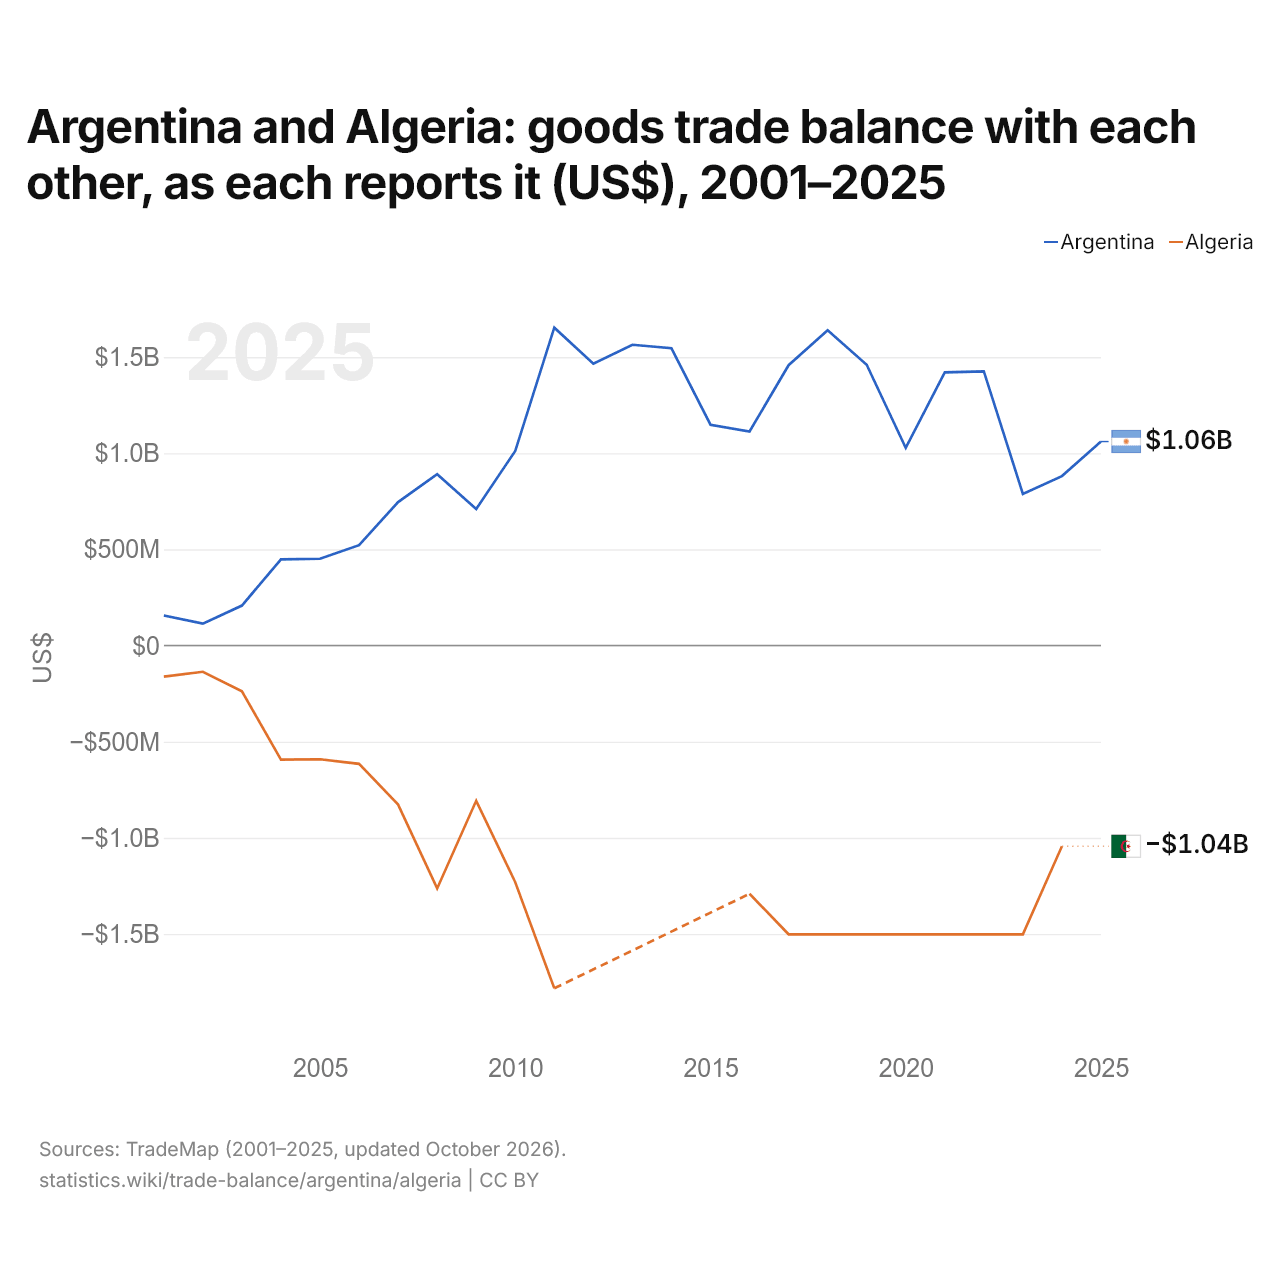
L'Argentine et l'Algérie : solde de leur commerce de biens bilatéral, selon chacun ($ US), 2001–2025
| Année | $ US | |
|---|---|---|
| Argentine | Algérie | |
| 2025 | 1 060 649 000 $ US | - |
| 2024 | 880 823 000 $ US | −1 043 882 000 $ US |
| 2023 | 788 322 000 $ US | −1 501 533 000 $ US |
| 2022 | 1 425 912 000 $ US | −1 501 533 000 $ US |
| 2021 | 1 420 682 000 $ US | −1 501 533 000 $ US |
| 2020 | 1 027 562 000 $ US | −1 501 533 000 $ US |
| 2019 | 1 460 131 000 $ US | −1 501 533 000 $ US |
| 2018 | 1 639 086 000 $ US | −1 501 533 000 $ US |
| 2017 | 1 457 634 000 $ US | −1 501 533 000 $ US |
| 2016 | 1 112 572 000 $ US | −1 290 829 000 $ US |
| 2015 | 1 147 963 000 $ US | - |
| 2014 | 1 545 663 000 $ US | - |
| 2013 | 1 563 977 000 $ US | - |
| 2012 | 1 465 521 000 $ US | - |
| 2011 | 1 652 608 000 $ US | −1 782 352 000 $ US |
| 2010 | 1 011 966 000 $ US | −1 230 661 000 $ US |
| 2009 | 709 905 000 $ US | −807 334 000 $ US |
| 2008 | 891 275 000 $ US | −1 263 112 000 $ US |
| 2007 | 746 085 000 $ US | −827 154 000 $ US |
| 2006 | 521 916 000 $ US | −615 321 000 $ US |
| 2005 | 451 355 000 $ US | −591 519 000 $ US |
| 2004 | 448 292 000 $ US | −593 231 000 $ US |
| 2003 | 207 863 000 $ US | −237 728 000 $ US |
| 2002 | 113 576 000 $ US | −136 367 000 $ US |
| 2001 | 155 894 000 $ US | −161 928 000 $ US |
Selon l'Argentine, son commerce de biens avec l'Algérie affichait un excédent de 881 millions de dollars ; selon l'Algérie, son commerce de biens avec l'Argentine affichait un déficit de 1,04 milliard de dollars. En 2001, les chiffres étaient un excédent de 156 millions de dollars pour l'Argentine et un déficit de 162 millions de dollars pour l'Algérie.
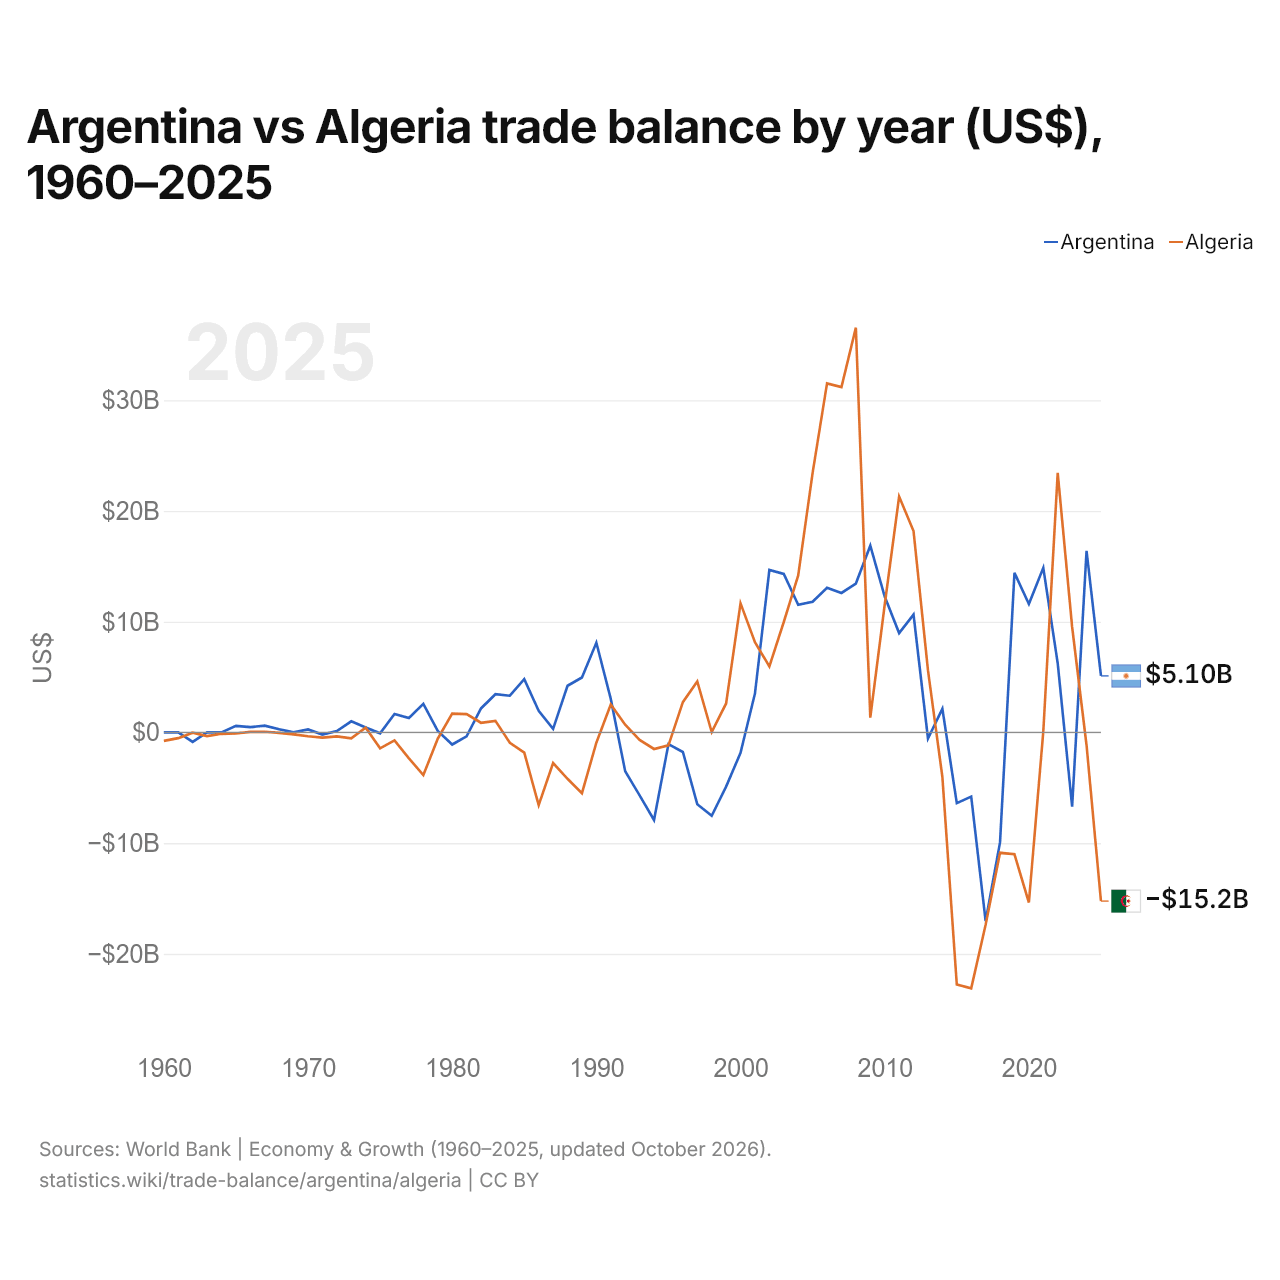
Argentine vs Algérie : balance commerciale par année ($ US), 1960–2025
| Année | $ US | |
|---|---|---|
 Argentine |
 Algérie |
|
| 2025 | 5 100 613 800 $ US | −15 239 617 821 $ US |
| 2024 | 16 404 309 065 $ US | −1 157 584 835 $ US |
| 2023 | −6 704 568 723 $ US | 9 521 076 816 $ US |
| 2022 | 6 233 148 859 $ US | 23 444 752 182 $ US |
| 2021 | 14 863 213 107 $ US | 96 235 574 $ US |
| 2020 | 11 599 718 810 $ US | −15 365 137 785 $ US |
| 2019 | 14 413 857 778 $ US | −11 009 709 489 $ US |
| 2018 | −9 914 710 860 $ US | −10 875 510 422 $ US |
| 2017 | −17 049 937 664 $ US | −17 380 666 509 $ US |
| 2016 | −5 796 649 660 $ US | −23 115 278 741 $ US |
| 2015 | −6 393 090 843 $ US | −22 777 389 612 $ US |
| 2014 | 2 127 192 191 $ US | −4 025 154 588 $ US |
| 2013 | −549 718 918 $ US | 5 622 451 757 $ US |
| 2012 | 10 642 160 447 $ US | 18 189 545 505 $ US |
| 2011 | 8 971 671 281 $ US | 21 300 645 647 $ US |
| 2010 | 12 270 934 023 $ US | 11 529 793 187 $ US |
| 2009 | 16 864 736 859 $ US | 1 333 701 926 $ US |
| 2008 | 13 446 803 975 $ US | 36 556 358 659 $ US |
| 2007 | 12 594 785 133 $ US | 31 196 364 969 $ US |
| 2006 | 13 069 507 212 $ US | 31 525 542 339 $ US |
| 2005 | 11 805 942 344 $ US | 23 445 463 437 $ US |
| 2004 | 11 530 324 282 $ US | 14 180 370 410 $ US |
| 2003 | 14 311 606 659 $ US | 9 970 802 368 $ US |
| 2002 | 14 670 786 469 $ US | 5 957 664 162 $ US |
| 2001 | 3 508 536 600 $ US | 8 147 248 966 $ US |
| 2000 | −1 846 455 600 $ US | 11 659 995 021 $ US |
| 1999 | −4 900 400 000 $ US | 2 612 547 339 $ US |
| 1998 | −7 530 100 000 $ US | 30 000 490 $ US |
| 1997 | −6 485 300 000 $ US | 4 609 976 585 $ US |
| 1996 | −1 767 000 000 $ US | 2 730 002 864 $ US |
| 1995 | −1 059 485 000 $ US | −1 170 007 106 $ US |
| 1994 | −7 914 860 000 $ US | −1 498 790 716 $ US |
| 1993 | −5 692 332 332 $ US | −676 792 326 $ US |
| 1992 | −3 510 854 173 $ US | 696 095 512 $ US |
| 1991 | 3 029 889 879 $ US | 2 522 617 373 $ US |
| 1990 | 8 096 982 795 $ US | −926 597 364 $ US |
| 1989 | 4 964 855 541 $ US | −5 493 813 611 $ US |
| 1988 | 4 212 460 577 $ US | −4 192 895 866 $ US |
| 1987 | 323 648 995 $ US | −2 763 033 271 $ US |
| 1986 | 1 945 851 942 $ US | −6 571 229 226 $ US |
| 1985 | 4 815 481 324 $ US | −1 829 825 550 $ US |
| 1984 | 3 312 681 836 $ US | −943 135 164 $ US |
| 1983 | 3 447 293 430 $ US | 1 044 102 802 $ US |
| 1982 | 2 166 280 922 $ US | 871 043 284 $ US |
| 1981 | −354 736 981 $ US | 1 645 114 472 $ US |
| 1980 | −1 094 188 525 $ US | 1 693 833 066 $ US |
| 1979 | 125 448 026 $ US | −570 943 669 $ US |
| 1978 | 2 576 185 988 $ US | −3 857 888 449 $ US |
| 1977 | 1 300 000 008 $ US | −2 339 177 208 $ US |
| 1976 | 1 665 000 247 $ US | −720 491 495 $ US |
| 1975 | −81 081 003 $ US | −1 443 254 204 $ US |
| 1974 | 444 444 350 $ US | 430 545 118 $ US |
| 1973 | 1 000 000 034 $ US | −529 969 047 $ US |
| 1972 | 125 000 068 $ US | −357 101 806 $ US |
| 1971 | −199 999 955 $ US | −468 180 171 $ US |
| 1970 | 273 421 120 $ US | −344 334 543 $ US |
| 1969 | 0 $ US | −182 294 787 $ US |
| 1968 | 285 714 230 $ US | −40 509 939 $ US |
| 1967 | 606 060 620 $ US | 60 764 909 $ US |
| 1966 | 476 190 459 $ US | 40 509 939 $ US |
| 1965 | 588 235 264 $ US | −101 274 848 $ US |
| 1964 | 392 $ US | −126 721 207 $ US |
| 1963 | 396 $ US | −328 164 535 $ US |
| 1962 | −860 375 152 $ US | −20 510 283 $ US |
| 1961 | 338 $ US | −517 608 091 $ US |
| 1960 | 338 $ US | −765 348 446 $ US |
En 2025, la balance commerciale de l'Argentine affichait un excédent de 5,1 milliards de dollars et celle de l'Algérie un déficit de 15,2 milliards de dollars. En 1960, la balance commerciale de l'Argentine affichait un excédent de 338 dollars et celle de l'Algérie un déficit de 765 millions de dollars.
Sur les années de 1960 à 2025 que les deux pays ont communiquées, la balance commerciale de l'Argentine a été excédentaire pendant 45 des 65 années, et celle de l'Algérie pendant 30. Les balances commerciales de l'Argentine et de l'Algérie ont été déficitaires en même temps pendant 10 de ces années, la dernière fois en 2018.
Argentine vs Algérie : chiffres de la balance commerciale
|
Argentine
|
Algérie
|
|
|---|---|---|
| Biens et services, $ US | +5,10 Md $US (2025) | −15,2 Md $US (2025) |
| % du PIB | +0,7 % (2025) | −5,3 % (2025) |
| Années d'excédent depuis 2000 | 19 sur 26 | 17 sur 26 |
| Solde des biens entre les deux, chiffres propres | +1,06 Md $US (2025) | −1,04 Md $US (2024) |
| Premier excédent en biens avec | Chili (+5,47 Md $US, 2025) | Italie (+9,26 Md $US, 2024) |
| Premier déficit en biens avec | Chine (−6,88 Md $US, 2025) | Chine (−8,59 Md $US, 2024) |
Comparer la balance commerciale de 2 pays au choix
Sources :
- Banque mondiale | Économie et croissance (1960–2025, mis à jour en octobre 2026)
- TradeMap (2001–2025, mis à jour en octobre 2026)
Creative Commons Attribution (CC BY) : vous pouvez copier, partager, adapter et réutiliser ce contenu, y compris à des fins commerciales, à condition de citer statistics.wiki et d’indiquer les modifications apportées. Les sources citées ci-dessus peuvent avoir leurs propres conditions de licence.