
La Belgique et l'Algérie : solde de leur commerce de biens bilatéral, selon chacun ($ US), 2001–2025
| Année | $ US | |
|---|---|---|
| Belgique | Algérie | |
| 2025 | 105 186 000 $ US | - |
| 2024 | −643 251 000 $ US | 866 798 000 $ US |
| 2023 | −1 094 043 000 $ US | 286 587 000 $ US |
| 2022 | −899 114 000 $ US | 286 587 000 $ US |
| 2021 | −217 202 000 $ US | 286 587 000 $ US |
| 2020 | 205 513 000 $ US | 286 587 000 $ US |
| 2019 | 139 128 000 $ US | 286 587 000 $ US |
| 2018 | −307 358 000 $ US | 286 587 000 $ US |
| 2017 | 16 922 000 $ US | 286 587 000 $ US |
| 2016 | −23 309 000 $ US | 382 190 000 $ US |
| 2015 | 148 467 000 $ US | 158 699 000 $ US |
| 2014 | −458 779 000 $ US | 832 959 000 $ US |
| 2013 | −631 206 000 $ US | 1 291 050 000 $ US |
| 2012 | −1 083 428 000 $ US | 1 260 915 000 $ US |
| 2011 | −642 313 000 $ US | 1 289 033 000 $ US |
| 2010 | −729 621 000 $ US | 1 143 258 000 $ US |
| 2009 | −30 916 000 $ US | 358 332 000 $ US |
| 2008 | −757 926 000 $ US | 1 197 288 000 $ US |
| 2007 | −764 498 000 $ US | 485 250 000 $ US |
| 2006 | −1 838 563 000 $ US | 1 469 938 000 $ US |
| 2005 | −1 411 150 000 $ US | 1 136 814 000 $ US |
| 2004 | −922 755 000 $ US | 246 361 000 $ US |
| 2003 | −962 181 000 $ US | 396 130 000 $ US |
| 2002 | −649 995 000 $ US | 181 957 000 $ US |
| 2001 | −67 667 000 $ US | 286 924 000 $ US |
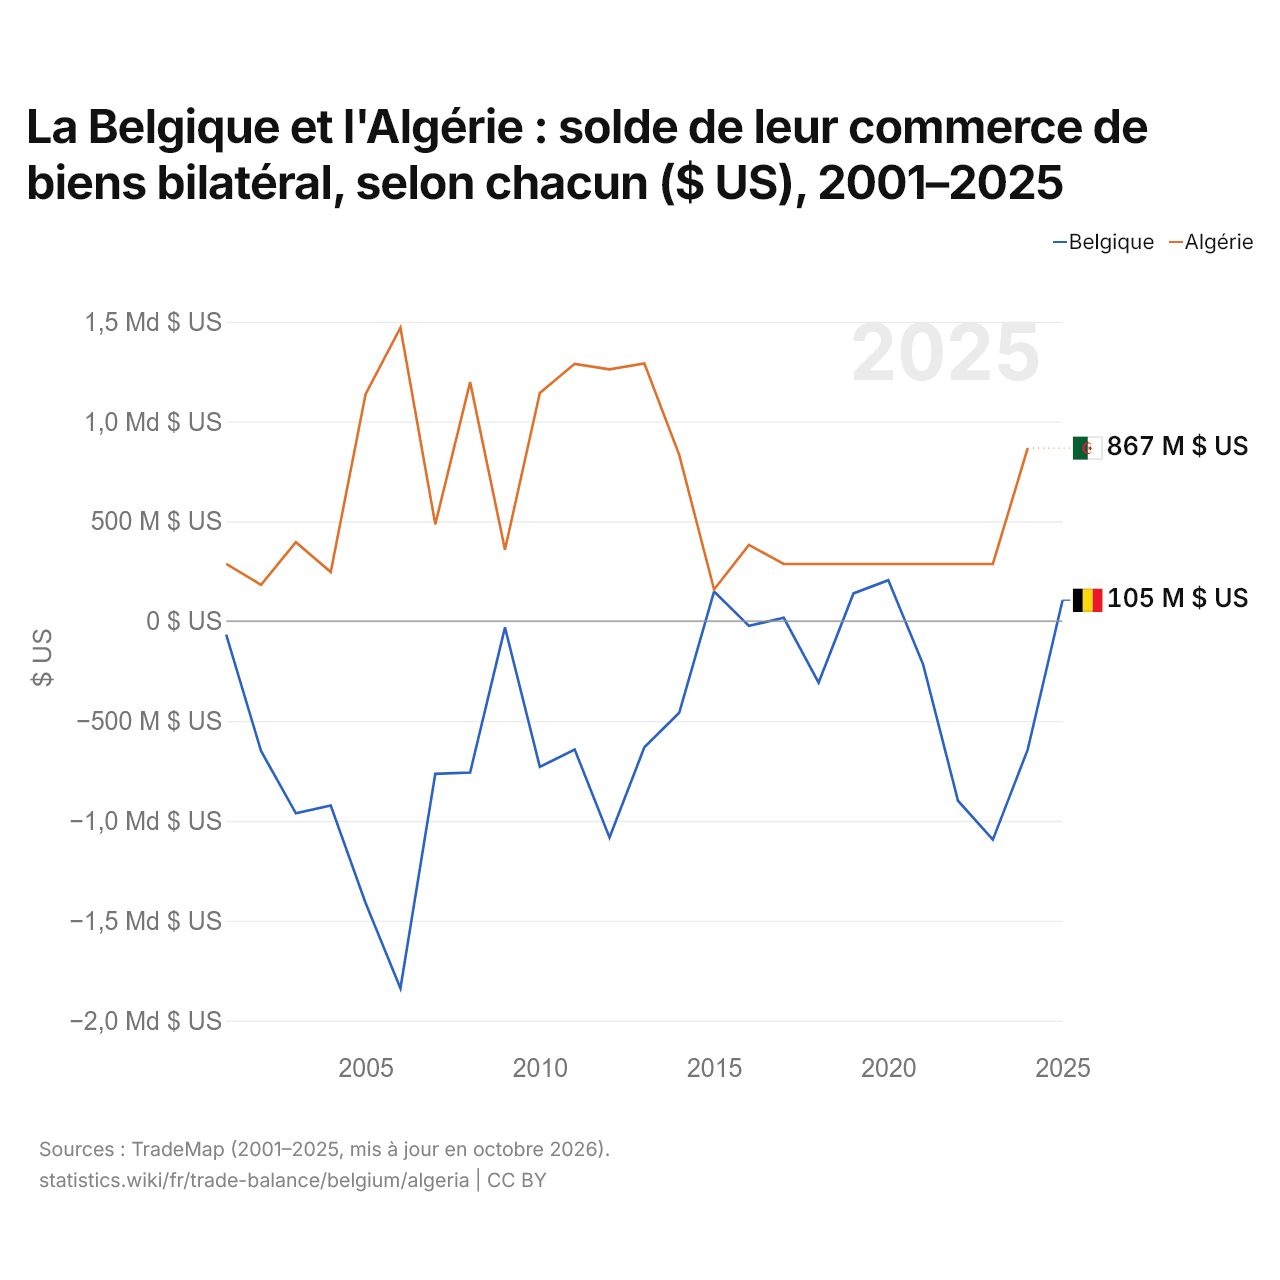
Selon la Belgique, son commerce de biens avec l'Algérie affichait un déficit de 643 millions de dollars ; selon l'Algérie, son commerce de biens avec la Belgique affichait un excédent de 867 millions de dollars. En 2001, les chiffres étaient un déficit de 67,7 millions de dollars pour la Belgique et un excédent de 287 millions de dollars pour l'Algérie.
Belgique vs Algérie : balance commerciale par année ($ US), 1960–2025
| Année | $ US | |
|---|---|---|
 Belgique |
 Algérie |
|
| 2025 | −14 637 349 567 $ US | −15 239 617 821 $ US |
| 2024 | −2 589 378 795 $ US | −1 157 584 835 $ US |
| 2023 | −2 348 299 205 $ US | 9 521 076 816 $ US |
| 2022 | −13 809 679 840 $ US | 23 444 752 182 $ US |
| 2021 | 11 185 411 660 $ US | 96 235 574 $ US |
| 2020 | 7 646 774 510 $ US | −15 365 137 785 $ US |
| 2019 | 2 519 265 437 $ US | −11 009 709 489 $ US |
| 2018 | −7 117 140 449 $ US | −10 875 510 422 $ US |
| 2017 | −76 479 416 $ US | −17 380 666 509 $ US |
| 2016 | 846 891 572 $ US | −23 115 278 741 $ US |
| 2015 | 3 166 438 839 $ US | −22 777 389 612 $ US |
| 2014 | 1 191 266 653 $ US | −4 025 154 588 $ US |
| 2013 | 1 306 071 280 $ US | 5 622 451 757 $ US |
| 2012 | −1 422 261 060 $ US | 18 189 545 505 $ US |
| 2011 | −1 174 531 842 $ US | 21 300 645 647 $ US |
| 2010 | 7 194 531 778 $ US | 11 529 793 187 $ US |
| 2009 | 9 960 978 144 $ US | 1 333 701 926 $ US |
| 2008 | 3 480 542 817 $ US | 36 556 358 659 $ US |
| 2007 | 19 473 396 555 $ US | 31 196 364 969 $ US |
| 2006 | 16 503 842 056 $ US | 31 525 542 339 $ US |
| 2005 | 15 569 789 759 $ US | 23 445 463 437 $ US |
| 2004 | 18 069 920 173 $ US | 14 180 370 410 $ US |
| 2003 | 17 041 157 540 $ US | 9 970 802 368 $ US |
| 2002 | 14 411 205 478 $ US | 5 957 664 162 $ US |
| 2001 | 8 634 316 460 $ US | 8 147 248 966 $ US |
| 2000 | 6 783 287 644 $ US | 11 659 995 021 $ US |
| 1999 | 10 216 533 029 $ US | 2 612 547 339 $ US |
| 1998 | 9 409 313 181 $ US | 30 000 490 $ US |
| 1997 | 9 815 741 994 $ US | 4 609 976 585 $ US |
| 1996 | 8 856 286 645 $ US | 2 730 002 864 $ US |
| 1995 | 11 089 490 969 $ US | −1 170 007 106 $ US |
| 1994 | 8 858 973 957 $ US | −1 498 790 716 $ US |
| 1993 | 7 197 266 791 $ US | −676 792 326 $ US |
| 1992 | 5 983 582 183 $ US | 696 095 512 $ US |
| 1991 | 3 934 812 758 $ US | 2 522 617 373 $ US |
| 1990 | 3 612 875 423 $ US | −926 597 364 $ US |
| 1989 | 3 607 222 563 $ US | −5 493 813 611 $ US |
| 1988 | 3 884 174 438 $ US | −4 192 895 866 $ US |
| 1987 | 2 713 639 114 $ US | −2 763 033 271 $ US |
| 1986 | 2 687 310 818 $ US | −6 571 229 226 $ US |
| 1985 | 890 002 718 $ US | −1 829 825 550 $ US |
| 1984 | 495 069 813 $ US | −943 135 164 $ US |
| 1983 | 344 979 882 $ US | 1 044 102 802 $ US |
| 1982 | −1 582 876 567 $ US | 871 043 284 $ US |
| 1981 | −2 193 369 187 $ US | 1 645 114 472 $ US |
| 1980 | −3 577 711 408 $ US | 1 693 833 066 $ US |
| 1979 | −2 010 039 901 $ US | −570 943 669 $ US |
| 1978 | −799 154 605 $ US | −3 857 888 449 $ US |
| 1977 | −549 247 046 $ US | −2 339 177 208 $ US |
| 1976 | 208 368 861 $ US | −720 491 495 $ US |
| 1975 | 202 501 919 $ US | −1 443 254 204 $ US |
| 1974 | 288 928 128 $ US | 430 545 118 $ US |
| 1973 | 916 582 488 $ US | −529 969 047 $ US |
| 1972 | 1 138 651 819 $ US | −357 101 806 $ US |
| 1971 | 581 774 525 $ US | −468 180 171 $ US |
| 1970 | 583 597 418 $ US | −344 334 543 $ US |
| 1969 | - | −182 294 787 $ US |
| 1968 | - | −40 509 939 $ US |
| 1967 | - | 60 764 909 $ US |
| 1966 | - | 40 509 939 $ US |
| 1965 | - | −101 274 848 $ US |
| 1964 | - | −126 721 207 $ US |
| 1963 | - | −328 164 535 $ US |
| 1962 | - | −20 510 283 $ US |
| 1961 | - | −517 608 091 $ US |
| 1960 | - | −765 348 446 $ US |
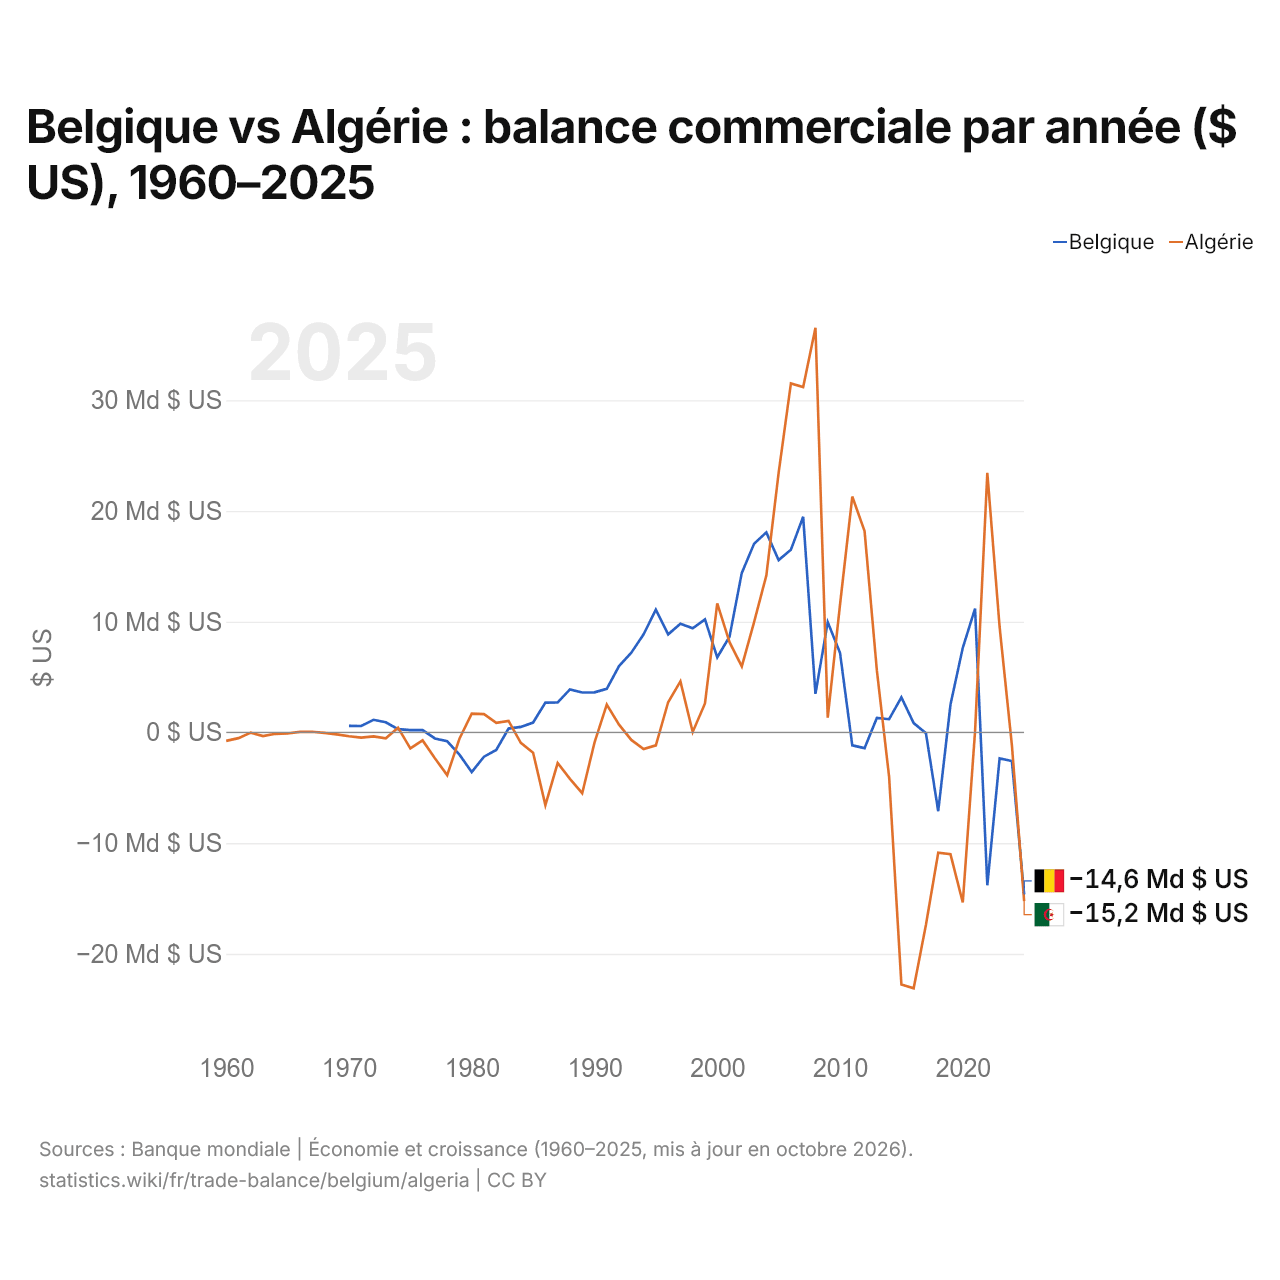
En 2025, la balance commerciale de la Belgique affichait un déficit de 14,6 milliards de dollars et celle de l'Algérie un déficit de 15,2 milliards de dollars ; le déficit de l'Algérie était plus grand de 4,1 %. En 1970, la balance commerciale de la Belgique affichait un excédent de 584 millions de dollars et celle de l'Algérie un déficit de 344 millions de dollars.
De 1970 à 2025, la balance commerciale de la Belgique a été excédentaire pendant 42 des 56 années, et celle de l'Algérie pendant 28. Les balances commerciales de la Belgique et de l'Algérie ont été déficitaires en même temps pendant 7 de ces années, la dernière fois en 2025.
Belgique vs Algérie : chiffres de la balance commerciale
|
Belgique
|
Algérie
|
|
|---|---|---|
| Biens et services, $ US | −14,6 Md $US (2025) | −15,2 Md $US (2025) |
| % du PIB | −2,0 % (2025) | −5,3 % (2025) |
| Années d'excédent depuis 2000 | 18 sur 26 | 17 sur 26 |
| Solde des biens entre les deux, chiffres propres | +105 M $US (2025) | +867 M $US (2024) |
| Premier excédent en biens avec | Allemagne (+42,1 Md $US, 2025) | Italie (+9,26 Md $US, 2024) |
| Premier déficit en biens avec | Pays-Bas (−33,2 Md $US, 2025) | Chine (−8,59 Md $US, 2024) |
Comparer la balance commerciale de 2 pays au choix
Sources :
- Banque mondiale | Économie et croissance (1960–2025, mis à jour en octobre 2026)
- TradeMap (2001–2025, mis à jour en octobre 2026)
Creative Commons Attribution (CC BY) : vous pouvez copier, partager, adapter et réutiliser ce contenu, y compris à des fins commerciales, à condition de citer statistics.wiki et d’indiquer les modifications apportées. Les sources citées ci-dessus peuvent avoir leurs propres conditions de licence.