
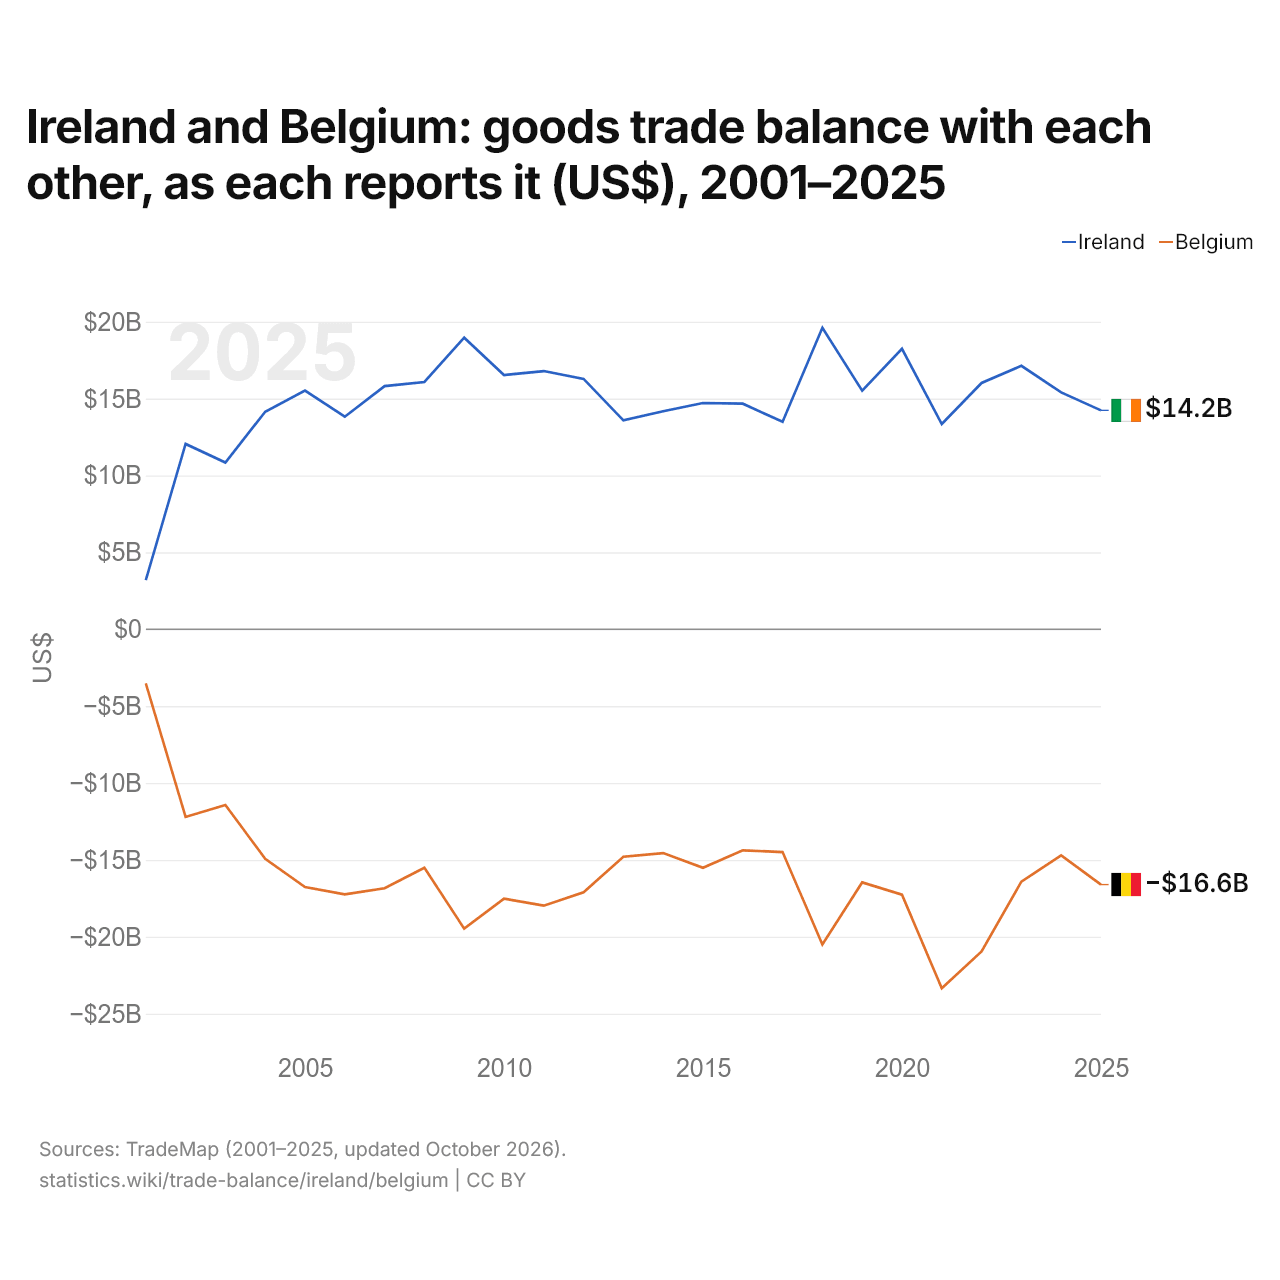
L'Irlande et la Belgique : solde de leur commerce de biens bilatéral, selon chacun ($ US), 2001–2025
| Année | $ US | |
|---|---|---|
| Irlande | Belgique | |
| 2025 | 14 232 139 000 $ US | −16 605 329 000 $ US |
| 2024 | 15 401 343 000 $ US | −14 704 492 000 $ US |
| 2023 | 17 129 183 000 $ US | −16 418 737 000 $ US |
| 2022 | 16 015 661 000 $ US | −20 958 409 000 $ US |
| 2021 | 13 340 777 000 $ US | −23 351 538 000 $ US |
| 2020 | 18 234 817 000 $ US | −17 261 258 000 $ US |
| 2019 | 15 509 675 000 $ US | −16 465 801 000 $ US |
| 2018 | 19 607 374 000 $ US | −20 507 324 000 $ US |
| 2017 | 13 488 271 000 $ US | −14 491 699 000 $ US |
| 2016 | 14 664 719 000 $ US | −14 381 185 000 $ US |
| 2015 | 14 709 588 000 $ US | −15 514 882 000 $ US |
| 2014 | 14 178 098 000 $ US | −14 560 450 000 $ US |
| 2013 | 13 583 362 000 $ US | −14 799 635 000 $ US |
| 2012 | 16 278 950 000 $ US | −17 109 253 000 $ US |
| 2011 | 16 788 184 000 $ US | −17 977 433 000 $ US |
| 2010 | 16 530 554 000 $ US | −17 519 170 000 $ US |
| 2009 | 18 958 766 000 $ US | −19 471 458 000 $ US |
| 2008 | 16 079 208 000 $ US | −15 508 434 000 $ US |
| 2007 | 15 807 350 000 $ US | −16 845 031 000 $ US |
| 2006 | 13 816 458 000 $ US | −17 237 299 000 $ US |
| 2005 | 15 518 543 000 $ US | −16 766 816 000 $ US |
| 2004 | 14 144 287 000 $ US | −14 928 702 000 $ US |
| 2003 | 10 837 040 000 $ US | −11 428 630 000 $ US |
| 2002 | 12 049 566 000 $ US | −12 205 856 000 $ US |
| 2001 | 3 194 313 000 $ US | −3 522 056 000 $ US |
En 2025, selon l'Irlande, son commerce de biens avec la Belgique affichait un excédent de 14,2 milliards de dollars ; selon la Belgique, son commerce de biens avec l'Irlande affichait un déficit de 16,6 milliards de dollars. En 2001, les chiffres étaient un excédent de 3,19 milliards de dollars pour l'Irlande et un déficit de 3,52 milliards de dollars pour la Belgique.
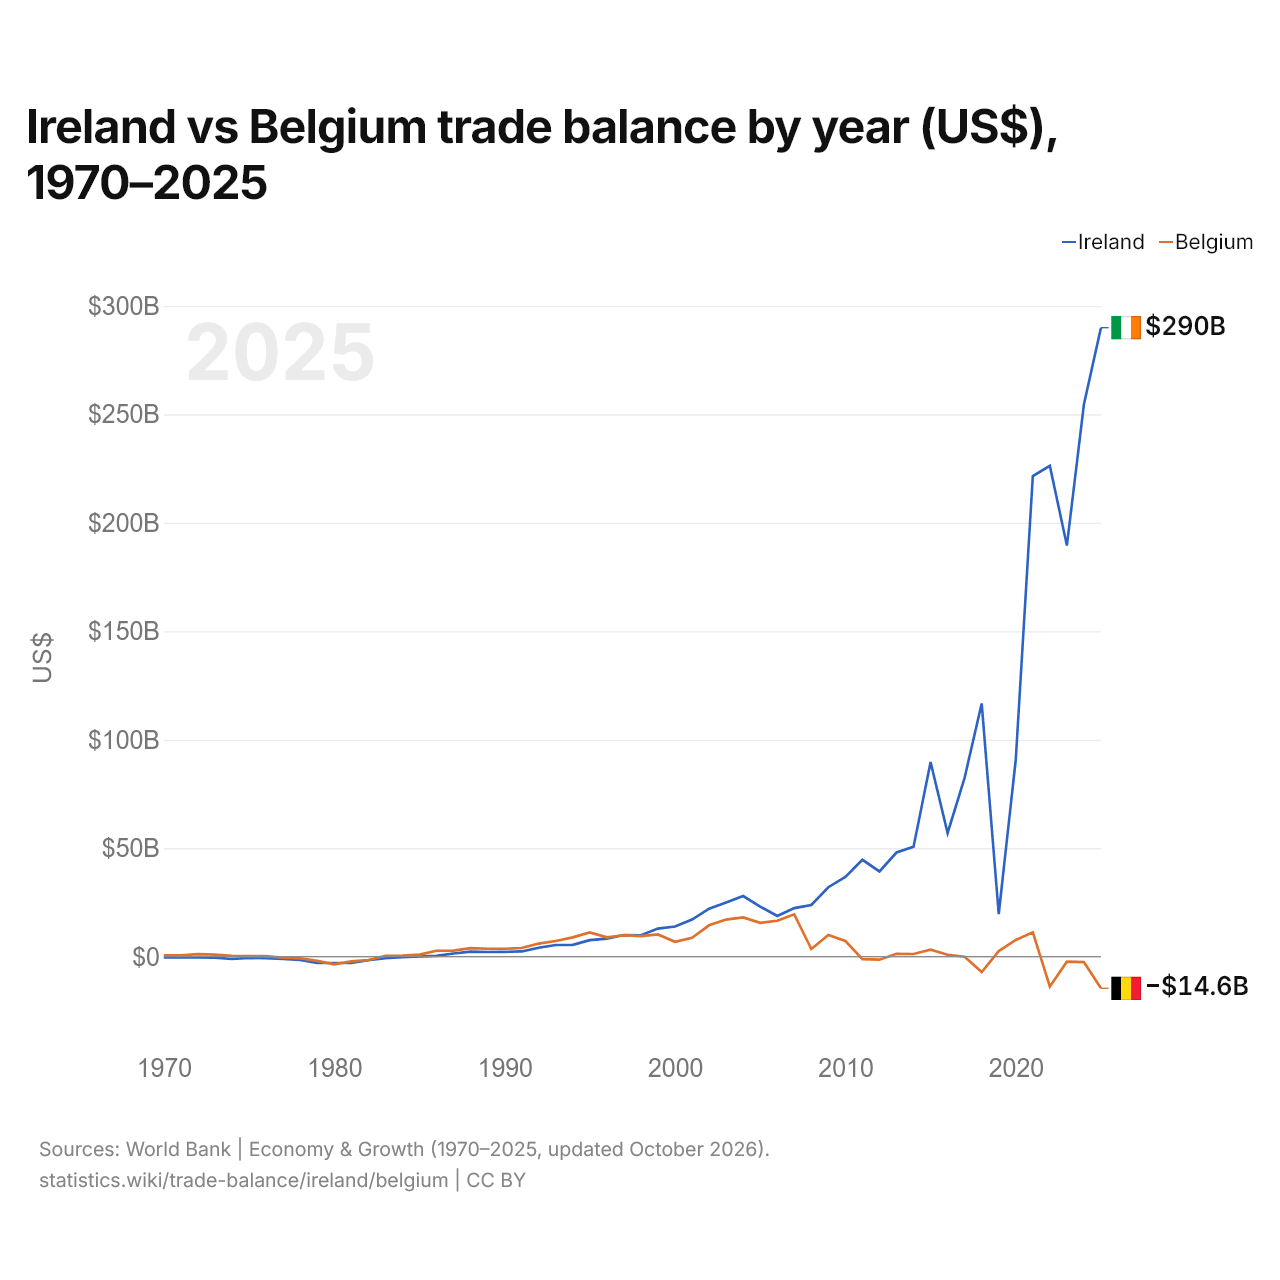
Irlande vs Belgique : balance commerciale par année ($ US), 1970–2025
| Année | $ US | |
|---|---|---|
 Irlande |
 Belgique |
|
| 2025 | 289 939 322 234 $ US | −14 637 349 567 $ US |
| 2024 | 254 623 727 467 $ US | −2 589 378 795 $ US |
| 2023 | 189 520 115 565 $ US | −2 348 299 205 $ US |
| 2022 | 226 226 860 149 $ US | −13 809 679 840 $ US |
| 2021 | 221 508 442 679 $ US | 11 185 411 660 $ US |
| 2020 | 90 878 856 252 $ US | 7 646 774 510 $ US |
| 2019 | 19 530 878 451 $ US | 2 519 265 437 $ US |
| 2018 | 116 690 741 020 $ US | −7 117 140 449 $ US |
| 2017 | 82 519 979 053 $ US | −76 479 416 $ US |
| 2016 | 56 957 858 132 $ US | 846 891 572 $ US |
| 2015 | 89 639 843 125 $ US | 3 166 438 839 $ US |
| 2014 | 50 667 638 273 $ US | 1 191 266 653 $ US |
| 2013 | 47 978 450 103 $ US | 1 306 071 280 $ US |
| 2012 | 39 229 583 132 $ US | −1 422 261 060 $ US |
| 2011 | 44 621 241 404 $ US | −1 174 531 842 $ US |
| 2010 | 36 749 740 973 $ US | 7 194 531 778 $ US |
| 2009 | 31 969 096 553 $ US | 9 960 978 144 $ US |
| 2008 | 23 763 202 014 $ US | 3 480 542 817 $ US |
| 2007 | 22 353 730 250 $ US | 19 473 396 555 $ US |
| 2006 | 18 684 829 769 $ US | 16 503 842 056 $ US |
| 2005 | 23 051 810 861 $ US | 15 569 789 759 $ US |
| 2004 | 27 918 902 374 $ US | 18 069 920 173 $ US |
| 2003 | 24 947 120 311 $ US | 17 041 157 540 $ US |
| 2002 | 22 092 289 965 $ US | 14 411 205 478 $ US |
| 2001 | 17 066 865 501 $ US | 8 634 316 460 $ US |
| 2000 | 13 853 052 192 $ US | 6 783 287 644 $ US |
| 1999 | 12 904 847 541 $ US | 10 216 533 029 $ US |
| 1998 | 9 809 846 361 $ US | 9 409 313 181 $ US |
| 1997 | 9 926 325 215 $ US | 9 815 741 994 $ US |
| 1996 | 8 295 972 782 $ US | 8 856 286 645 $ US |
| 1995 | 7 561 709 596 $ US | 11 089 490 969 $ US |
| 1994 | 5 384 972 909 $ US | 8 858 973 957 $ US |
| 1993 | 5 310 547 738 $ US | 7 197 266 791 $ US |
| 1992 | 4 062 749 565 $ US | 5 983 582 183 $ US |
| 1991 | 2 351 692 230 $ US | 3 934 812 758 $ US |
| 1990 | 2 161 072 033 $ US | 3 612 875 423 $ US |
| 1989 | 2 115 397 924 $ US | 3 607 222 563 $ US |
| 1988 | 2 253 683 263 $ US | 3 884 174 438 $ US |
| 1987 | 1 402 758 661 $ US | 2 713 639 114 $ US |
| 1986 | 308 043 663 $ US | 2 687 310 818 $ US |
| 1985 | 66 860 998 $ US | 890 002 718 $ US |
| 1984 | −338 802 288 $ US | 495 069 813 $ US |
| 1983 | −794 919 252 $ US | 344 979 882 $ US |
| 1982 | −1 695 763 470 $ US | −1 582 876 567 $ US |
| 1981 | −2 940 177 462 $ US | −2 193 369 187 $ US |
| 1980 | −2 953 078 168 $ US | −3 577 711 408 $ US |
| 1979 | −2 981 858 478 $ US | −2 010 039 901 $ US |
| 1978 | −1 510 371 489 $ US | −799 154 605 $ US |
| 1977 | −1 076 042 039 $ US | −549 247 046 $ US |
| 1976 | −795 849 137 $ US | 208 368 861 $ US |
| 1975 | −626 193 380 $ US | 202 501 919 $ US |
| 1974 | −1 142 008 838 $ US | 288 928 128 $ US |
| 1973 | −538 410 187 $ US | 916 582 488 $ US |
| 1972 | −363 749 017 $ US | 1 138 651 819 $ US |
| 1971 | −385 203 143 $ US | 581 774 525 $ US |
| 1970 | −362 337 932 $ US | 583 597 418 $ US |
En 2025, la balance commerciale de l'Irlande affichait un excédent de 290 milliards de dollars et celle de la Belgique un déficit de 14,6 milliards de dollars. En 1970, la balance commerciale de l'Irlande affichait un déficit de 362 millions de dollars et celle de la Belgique un excédent de 584 millions de dollars.
De 1970 à 2025, la balance commerciale de l'Irlande a été excédentaire pendant 41 des 56 années, et celle de la Belgique pendant 42. Les balances commerciales de l'Irlande et de la Belgique ont été déficitaires en même temps pendant 6 de ces années, la dernière fois en 1982.
Irlande vs Belgique : chiffres de la balance commerciale
|
Irlande
|
Belgique
|
|
|---|---|---|
| Biens et services, $ US | +290 Md $US (2025) | −14,6 Md $US (2025) |
| % du PIB | +40,2 % (2025) | −2,0 % (2025) |
| Années d'excédent depuis 2000 | 26 sur 26 | 18 sur 26 |
| Solde des biens entre les deux, chiffres propres | +14,2 Md $US (2025) | −16,6 Md $US (2025) |
| Premier excédent en biens avec | États-Unis (+98,2 Md $US, 2025) | Allemagne (+42,1 Md $US, 2025) |
| Premier déficit en biens avec | France (−7,48 Md $US, 2025) | Pays-Bas (−33,2 Md $US, 2025) |
Comparer la balance commerciale de 2 pays au choix
Sources :
- Banque mondiale | Économie et croissance (1970–2025, mis à jour en octobre 2026)
- TradeMap (2001–2025, mis à jour en octobre 2026)
Creative Commons Attribution (CC BY) : vous pouvez copier, partager, adapter et réutiliser ce contenu, y compris à des fins commerciales, à condition de citer statistics.wiki et d’indiquer les modifications apportées. Les sources citées ci-dessus peuvent avoir leurs propres conditions de licence.