
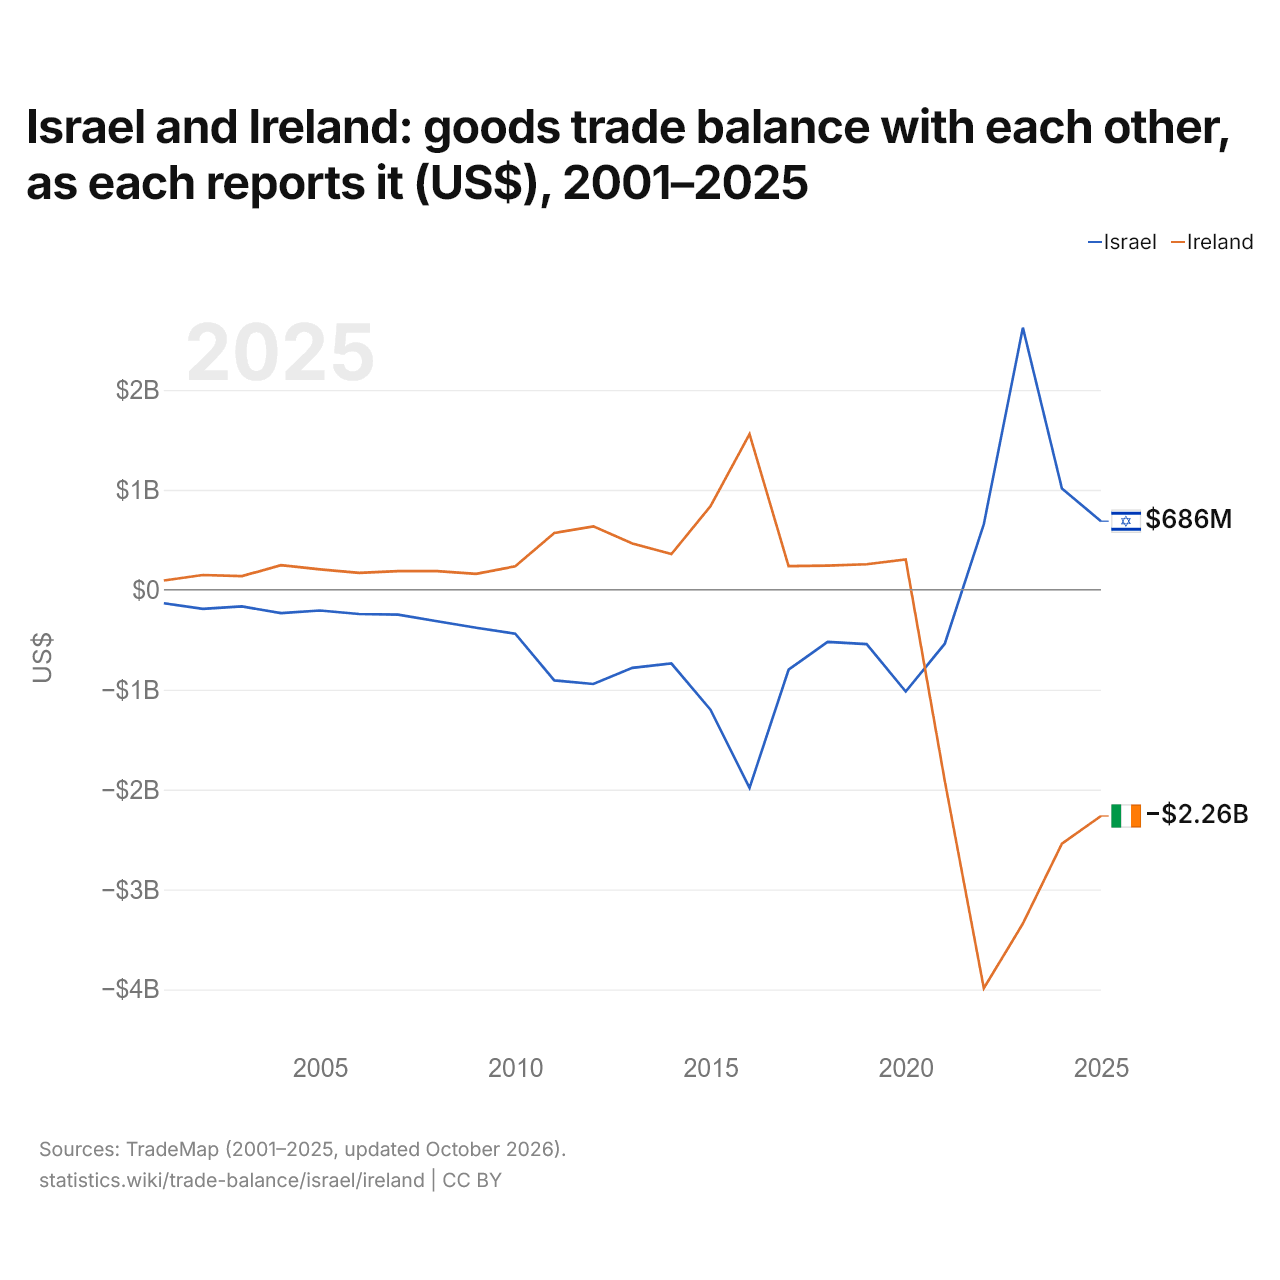
Israël et l'Irlande : solde de leur commerce de biens bilatéral, selon chacun ($ US), 2001–2025
| Année | $ US | |
|---|---|---|
| Israël | Irlande | |
| 2025 | 686 389 000 $ US | −2 264 236 000 $ US |
| 2024 | 1 012 981 000 $ US | −2 541 969 000 $ US |
| 2023 | 2 622 602 000 $ US | −3 340 582 000 $ US |
| 2022 | 656 307 000 $ US | −3 988 639 000 $ US |
| 2021 | −540 197 000 $ US | −1 912 775 000 $ US |
| 2020 | −1 018 265 000 $ US | 303 313 000 $ US |
| 2019 | −543 697 000 $ US | 255 624 000 $ US |
| 2018 | −522 292 000 $ US | 241 824 000 $ US |
| 2017 | −800 267 000 $ US | 235 664 000 $ US |
| 2016 | −1 983 088 000 $ US | 1 557 919 000 $ US |
| 2015 | −1 200 602 000 $ US | 836 449 000 $ US |
| 2014 | −738 134 000 $ US | 356 963 000 $ US |
| 2013 | −781 104 000 $ US | 462 593 000 $ US |
| 2012 | −943 198 000 $ US | 634 166 000 $ US |
| 2011 | −907 560 000 $ US | 567 546 000 $ US |
| 2010 | −440 131 000 $ US | 234 737 000 $ US |
| 2009 | −380 820 000 $ US | 159 407 000 $ US |
| 2008 | −315 340 000 $ US | 186 426 000 $ US |
| 2007 | −249 354 000 $ US | 186 549 000 $ US |
| 2006 | −242 800 000 $ US | 168 120 000 $ US |
| 2005 | −207 269 000 $ US | 203 424 000 $ US |
| 2004 | −234 562 000 $ US | 245 522 000 $ US |
| 2003 | −166 853 000 $ US | 136 261 000 $ US |
| 2002 | −190 993 000 $ US | 147 802 000 $ US |
| 2001 | −134 908 000 $ US | 93 121 000 $ US |
En 2025, selon Israël, son commerce de biens avec l'Irlande affichait un excédent de 686 millions de dollars ; selon l'Irlande, son commerce de biens avec Israël affichait un déficit de 2,26 milliards de dollars. En 2001, les chiffres étaient un déficit de 135 millions de dollars pour Israël et un excédent de 93,1 millions de dollars pour l'Irlande.
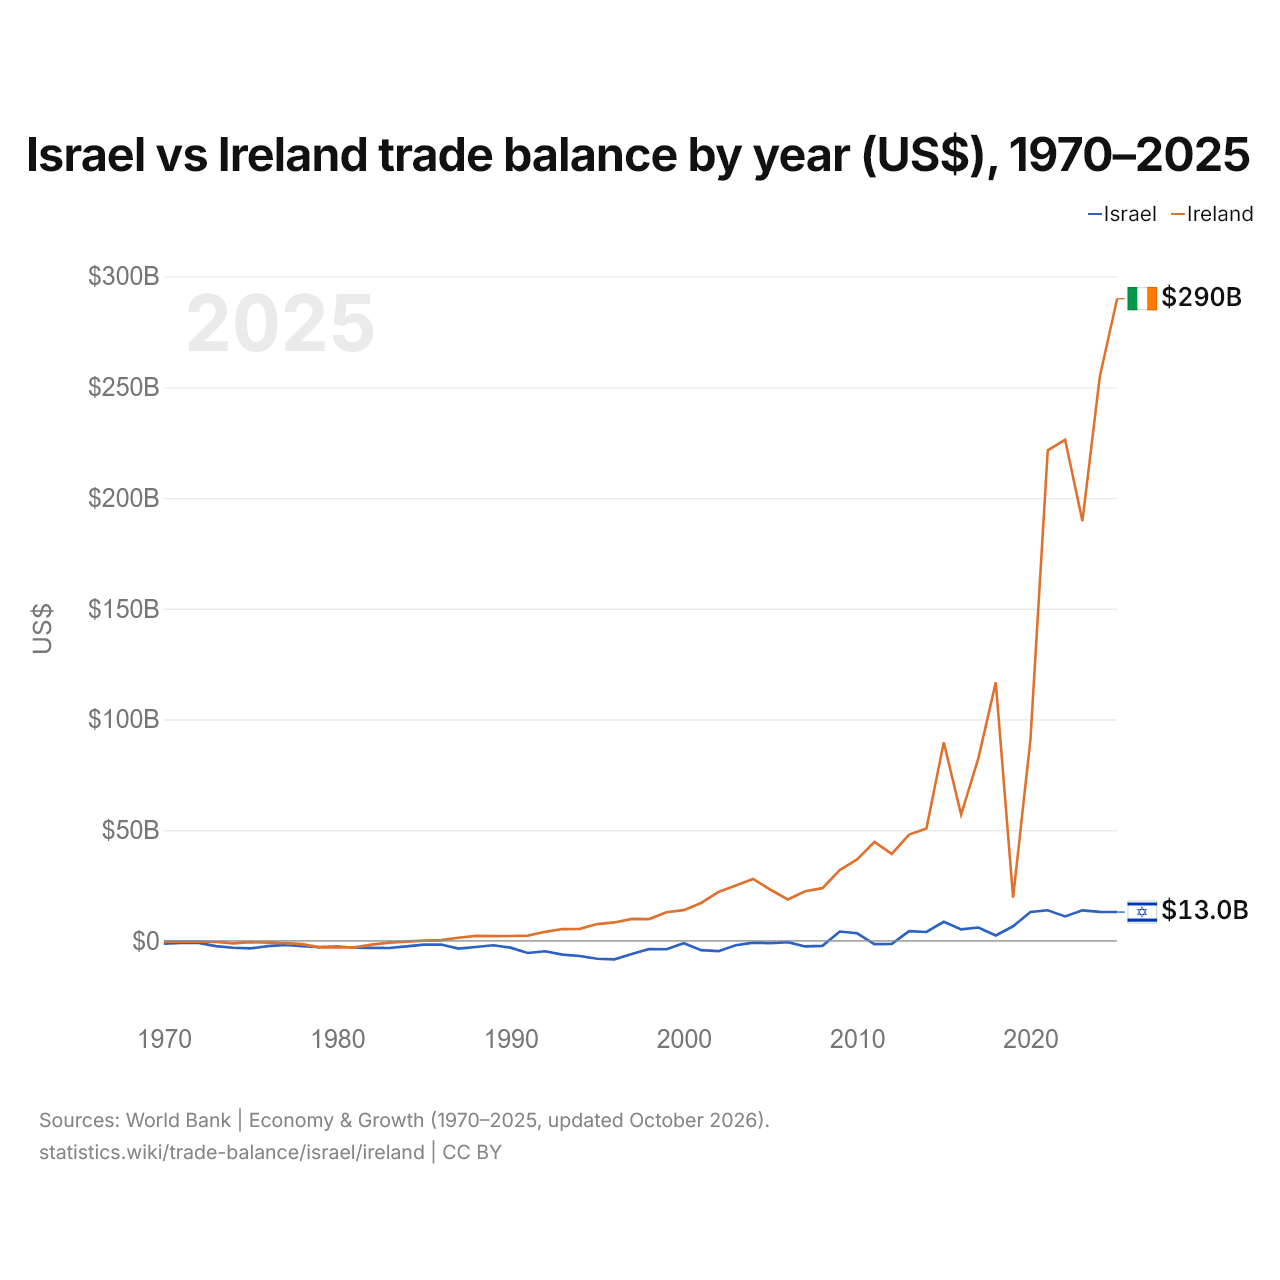
Israël vs Irlande : balance commerciale par année ($ US), 1970–2025
| Année | $ US | |
|---|---|---|
 Israël |
 Irlande |
|
| 2025 | 12 994 365 505 $ US | 289 939 322 234 $ US |
| 2024 | 13 100 279 099 $ US | 254 623 727 467 $ US |
| 2023 | 13 754 663 733 $ US | 189 520 115 565 $ US |
| 2022 | 11 000 808 302 $ US | 226 226 860 149 $ US |
| 2021 | 13 804 496 055 $ US | 221 508 442 679 $ US |
| 2020 | 13 021 165 408 $ US | 90 878 856 252 $ US |
| 2019 | 6 557 503 906 $ US | 19 530 878 451 $ US |
| 2018 | 2 413 018 727 $ US | 116 690 741 020 $ US |
| 2017 | 6 004 796 901 $ US | 82 519 979 053 $ US |
| 2016 | 5 128 475 225 $ US | 56 957 858 132 $ US |
| 2015 | 8 575 319 326 $ US | 89 639 843 125 $ US |
| 2014 | 3 984 226 053 $ US | 50 667 638 273 $ US |
| 2013 | 4 406 103 796 $ US | 47 978 450 103 $ US |
| 2012 | −1 392 248 402 $ US | 39 229 583 132 $ US |
| 2011 | −1 462 187 515 $ US | 44 621 241 404 $ US |
| 2010 | 3 412 251 219 $ US | 36 749 740 973 $ US |
| 2009 | 4 198 677 110 $ US | 31 969 096 553 $ US |
| 2008 | −2 287 048 495 $ US | 23 763 202 014 $ US |
| 2007 | −2 539 773 861 $ US | 22 353 730 250 $ US |
| 2006 | −575 153 283 $ US | 18 684 829 769 $ US |
| 2005 | −1 009 500 635 $ US | 23 051 810 861 $ US |
| 2004 | −793 186 301 $ US | 27 918 902 374 $ US |
| 2003 | −1 975 804 879 $ US | 24 947 120 311 $ US |
| 2002 | −4 669 753 894 $ US | 22 092 289 965 $ US |
| 2001 | −4 222 578 168 $ US | 17 066 865 501 $ US |
| 2000 | −1 098 518 628 $ US | 13 853 052 192 $ US |
| 1999 | −3 810 722 999 $ US | 12 904 847 541 $ US |
| 1998 | −3 730 624 984 $ US | 9 809 846 361 $ US |
| 1997 | −5 975 502 116 $ US | 9 926 325 215 $ US |
| 1996 | −8 351 877 056 $ US | 8 295 972 782 $ US |
| 1995 | −8 115 948 262 $ US | 7 561 709 596 $ US |
| 1994 | −6 867 235 894 $ US | 5 384 972 909 $ US |
| 1993 | −6 232 770 220 $ US | 5 310 547 738 $ US |
| 1992 | −4 720 523 362 $ US | 4 062 749 565 $ US |
| 1991 | −5 509 077 267 $ US | 2 351 692 230 $ US |
| 1990 | −3 103 552 723 $ US | 2 161 072 033 $ US |
| 1989 | −2 010 870 382 $ US | 2 115 397 924 $ US |
| 1988 | −2 800 375 258 $ US | 2 253 683 263 $ US |
| 1987 | −3 498 185 125 $ US | 1 402 758 661 $ US |
| 1986 | −1 649 481 113 $ US | 308 043 663 $ US |
| 1985 | −1 698 280 601 $ US | 66 860 998 $ US |
| 1984 | −2 488 666 439 $ US | −338 802 288 $ US |
| 1983 | −3 259 483 986 $ US | −794 919 252 $ US |
| 1982 | −3 188 683 128 $ US | −1 695 763 470 $ US |
| 1981 | −3 131 228 070 $ US | −2 940 177 462 $ US |
| 1980 | −2 559 607 843 $ US | −2 953 078 168 $ US |
| 1979 | −2 851 200 000 $ US | −2 981 858 478 $ US |
| 1978 | −2 447 647 059 $ US | −1 510 371 489 $ US |
| 1977 | −1 834 000 000 $ US | −1 076 042 039 $ US |
| 1976 | −2 433 750 000 $ US | −795 849 137 $ US |
| 1975 | −3 438 333 333 $ US | −626 193 380 $ US |
| 1974 | −3 132 500 000 $ US | −1 142 008 838 $ US |
| 1973 | −2 412 500 000 $ US | −538 410 187 $ US |
| 1972 | −925 000 000 $ US | −363 749 017 $ US |
| 1971 | −1 000 000 000 $ US | −385 203 143 $ US |
| 1970 | −1 283 333 333 $ US | −362 337 932 $ US |
En 2025, la balance commerciale d'Israël affichait un excédent de 13 milliards de dollars et celle de l'Irlande un excédent de 290 milliards de dollars ; l'excédent de l'Irlande était 22 fois plus grand. En 1970, la balance commerciale d'Israël affichait un déficit de 1,28 milliard de dollars et celle de l'Irlande un déficit de 362 millions de dollars.
De 1970 à 2025, la balance commerciale d'Israël a été excédentaire pendant 15 des 56 années, et celle de l'Irlande pendant 41. Les balances commerciales d'Israël et de l'Irlande ont été déficitaires en même temps pendant 15 de ces années, la dernière fois en 1984.
Israël vs Irlande : chiffres de la balance commerciale
|
Israël
|
Irlande
|
|
|---|---|---|
| Biens et services, $ US | +13,0 Md $US (2025) | +290 Md $US (2025) |
| % du PIB | +2,1 % (2025) | +40,2 % (2025) |
| Années d'excédent depuis 2000 | 15 sur 26 | 26 sur 26 |
| Solde des biens entre les deux, chiffres propres | +686 M $US (2025) | −2,26 Md $US (2025) |
| Premier excédent en biens avec | États-Unis (+6,12 Md $US, 2025) | États-Unis (+98,2 Md $US, 2025) |
| Premier déficit en biens avec | Chine (−18,0 Md $US, 2025) | France (−7,48 Md $US, 2025) |
Comparer la balance commerciale de 2 pays au choix
Sources :
- Banque mondiale | Économie et croissance (1970–2025, mis à jour en octobre 2026)
- TradeMap (2001–2025, mis à jour en octobre 2026)
Creative Commons Attribution (CC BY) : vous pouvez copier, partager, adapter et réutiliser ce contenu, y compris à des fins commerciales, à condition de citer statistics.wiki et d’indiquer les modifications apportées. Les sources citées ci-dessus peuvent avoir leurs propres conditions de licence.